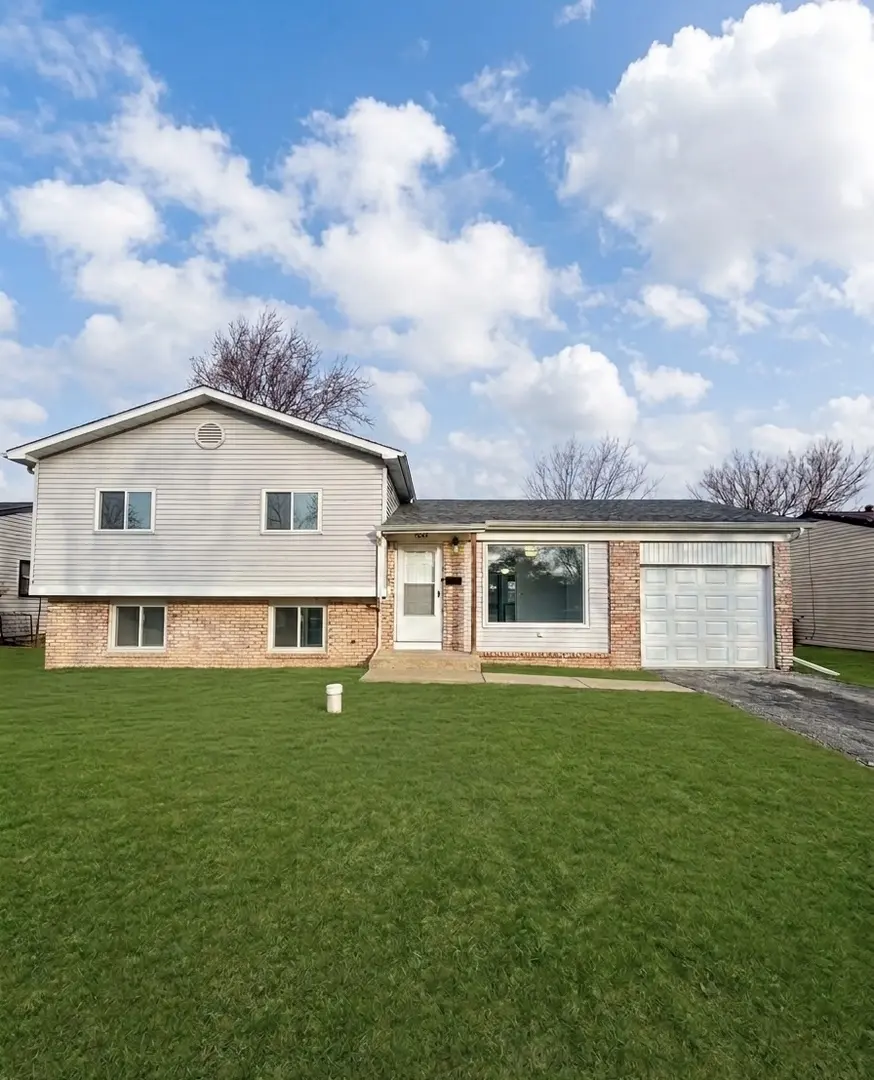
3704 Tamarind Ln · Hazel Crest, IL
Flood risk 1/10 · Minimal
- FEMA flood zone
- X (unshaded)
- Chance of flooding over 30 yrs
- 0.0%
- Est. flood insurance / yr
- $473 – $860
Fire risk 1/10 · Minimal
- Est. fire insurance / yr
- $804 – $1,492
Heat risk 3/10 · Minor
- Hot days now (above 101°F)
- 7 days/yr
- Hot days in 30 yrs
- 15 days/yr
Wind risk 2/10 · Minimal
- Chance of severe wind over 30 yrs
- —
Air-quality risk 3/10 · Minor
- Unhealthy air days now
- 4 days/yr
- Unhealthy air days in 30 yrs
- 4 days/yr
Risk factors via First Street. Map © Google.
Why this score? — see what drove the C- grade
The composite is a weighted blend of 9 inputs, each scored 0–100. Each bar is that input's sub-score; the figure is the points it added to the 100-point composite (weight × sub-score).
- Cash flow +18.5/30.0
- ARV discount +9.1/15.0
- 1% rule +8.4/10.0
- DSCR +5.8/10.0
- Livability +3.8/5.0
- Rent growth +2.5/5.0
- Condition / age +2.5/5.0
- Schools +1.5/10.0
- Appreciation +0.0/10.0
$184,000
🖨 Deal sheet 📄 Offer letter ✓ Due diligence
Listing remarks MLS
** SELLER NEEDS TO SELL ** BEAUTIFUL SPLIT LEVEL 3 BED [BIG MASTER BEDROOM WITH DOUBLE CLOSETS] 1.1 BATH. BIG BACK YARD, LOWER LEVEL WITH BIG FAMILY ROOM , LAUNDRY ROOM AND EXTRA BEDROOM. SELLER NEEDS TO SELL ** MAKE AN OFFER TODAY.
Key facts
- Large family room
- Dine-in area
- Spacious kitchen
Tags
Neighborhood map
What this means for you Summary
Snapshot
- This is a 2-bed/1.5-bath single-family listed at $184k.
Deal economics
- At list price, monthly cash flow is $174 ($2k/yr) — positive.
- The deal already cash-flows at list — no discount required.
- Meets the 1% rule at list price ($2k rent vs $184k).
Location & tenants
- Location reads 75/100 on livability (#229 in IL, #4,242 nationally) — a middle-class / working-renter tenant base. Strengths: commute A+, cost of living A+, housing A+; Watch: health & safety C-, schools D-, crime F.
- Bremen Chsd 228 (suburban): math 15% / reading 17% proficiency, ranked #468 of 620 in IL (top 76%) — low school quality limits family demand, transient renter base, plan for 1-2y turnover.
- Market conditions: 80 active listings in the ZIP; 5 comparable units currently listed for rent nearby; rentals leasing fast (median 2d on market — plan ~1-2 weeks tenant-placement turnaround); 6,272 units permitted in Cook County in 2024 (4,658 in 5+ unit buildings).
Forward outlook
- Local home prices are declining (-3.0%/yr); year-one equity from $1k of loan paydown is wiped out by about $6k of value loss. Plan a longer hold.
Negotiation context
- Only 11 days on market — expect competitive offers; lowballing is unlikely to land.
- 2 sale attempts since 19y ago with the ask held roughly flat each time — persistent listings suggest the price (not the market) is what's stuck; bring a comps-based counter.
- Current owner paid $127k; 45% above their basis — modest negotiation headroom, anchor on the comps not their cost.
Risks & watch-outs
- Watch-outs: property tax is 4.7% of price.
Questions for the listing agent
- Built in 1972 — when were the roof, HVAC, electrical panel, plumbing, and water heater last replaced?
- Property tax is high relative to price — has the assessment been appealed recently, and will the sale trigger a re-assessment?
- Is there a deadline driving the sale (1031 exchange, divorce, estate, relocation)? That informs how much negotiation room exists.
- Schools are D-rated, which usually means shorter tenancies and higher turnover. Who's the typical renter profile here, and what's been the actual vacancy rate?
- Crime grade is F in this area — have there been break-ins, vandalism, or insurance claims at this property in the last 3 years? What carrier currently insures it and at what premium?
- What's the average days-on-market for RENTAL listings here right now (not sales)? A rising rental-DOM trend means longer vacancies and softer asking-rent achievability than the comps imply.
- What's the recent tenant-quality profile in this submarket — average credit score on applications, eviction rate, late-payment / NSF rate, and stable-employment percentage? A property-management company in the area should have these aggregated.
- How much new for-sale + rental construction is in the pipeline within 1–3 miles? Heavy new supply typically softens prices + rents 12–24 months out; constrained supply supports both.
Investment metrics
- 1% rule
- 1.34% ✓
- Cap rate
- 7.43%
- Cash-on-cash
- 4.05%
- DSCR
- 1.18
- GRM
- 6.2
CMA / ARV
- ARV (on-the-fly)
- $190,814
- Comps found
- 12
Show comp detail 12 sales within ~0.75 mi
| Address | Dist | Beds/Ba | Sqft | Sold | Price | $/sf | Match |
|---|---|---|---|---|---|---|---|
| 3704 Tamarind Ln | 0.00mi | 3/1.5 (+1) | 1,066 (0%) | 1mo | $189,000 | $177 | 94 |
| 3617 Coventry Ct | 0.21mi | 3/2.0 (+1) | 1,064 (-0%) | 1mo | $240,000 | $226 | 82 |
| 3800 171st St | 0.22mi | 3/1.5 (+1) | 1,066 (0%) | 5mo | $280,000 | $263 | 81 |
| 3618 Peach Grove Ln | 0.13mi | 3/1.0 (+1) | 1,092 (+2%) | 5mo | $175,000 | $160 | 79 |
| 4050 Russet Way | 0.38mi | 3/2.0 (+1) | 1,058 (-1%) | 1mo | $259,000 | $245 | 73 |
| 17137 Coventry Ln | 0.36mi | 3/2.0 (+1) | 1,095 (+3%) | 2mo | $150,000 | $137 | 70 |
| 17304 Peach Grov Ave | 0.10mi | 3/1.0 (+1) | 960 (-10%) | 7mo | $143,500 | $149 | 66 |
| 16843 Briargate Dr | 0.60mi | 3/1.5 (+1) | 1,072 (+1%) | 2mo | $135,000 | $126 | 65 |
| 17620 Winston Dr | 0.47mi | 3/1.0 (+1) | 1,091 (+2%) | 3mo | $195,000 | $179 | 65 |
| 3318 Tulip Dr | 0.65mi | 3/1.5 (+1) | 1,093 (+2%) | 1mo | $225,000 | $206 | 59 |
| 17801 Yale Ln | 0.71mi | 3/1.5 (+1) | 1,040 (-2%) | 3mo | $206,000 | $198 | 55 |
| 3317 Birchwood Dr | 0.69mi | 3/1.5 (+1) | 1,223 (+15%) | 7mo | $189,000 | $155 | 32 |
Match score weights: distance 35% · size 25% · config 20% · recency 20%. Top-matched comps best support the ARV.
Projected returns pro-forma
-3.0% appreciation · 3.0% rent growth · sell at horizon
- IRR
- -9.7%
- Equity multiple
- 0.64×
- Total profit
- $-18,393
- Equity at exit
- $27,435
- IRR
- -0.1%
- Equity multiple
- 0.99×
- Total profit
- $-359
- Equity at exit
- $15,909
Cash invested: $51,520 (down + closing). Projections, not guarantees.
Landlord ↔ Tenant lean methodology
- Overall (STATE)
- 43 Moderately Tenant-Leaning
- State Illinois
- 43 Moderately Tenant-Leaning · D+7
- County
- — inherits STATE
- City
- — inherits STATE
ZIP-level market 60429
- Home prices YoY
- -14.0%
- Active inventory
- 80
- Price-to-rent
- 6.2×
Monthly cashflow live
- Estimated rent
- $2,457 high interval (Pro) →
- Mortgage (P&I)
- −$965
- Tax from tax record
- −$726 /mo · $8,708/yr
- Insurance
- −$77
- HOA
- −$0
- Vacancy / Maint / Mgmt
- −$516
- Net cashflow
- $174
Break-even live
UW: 25.0% down · 7.5% · 30yr · 1.5% tax · 5.0% vac · 8.0% maint · 8.0% mgmt
Financing live
Cash to close
- Down payment
- $46,000
- Closing costs
- $5,520
- Reserves months
- —
- Total cash needed
- —
Loan-product check · same deal, 3 products live
Conventional
25% down · 7.5% · 30yr
- Down + closing
- —
- Monthly P&I
- —
- Monthly cashflow
- —
- DSCR
- —
- Eligible?
- —
Personal DTI + credit; lowest rate.
DSCR
20% down · 8.5% · 30yr
- Down + closing
- —
- Monthly P&I
- —
- Monthly cashflow
- —
- DSCR
- —
- Eligible?
- —
No personal income docs; deal must DSCR.
Hard money
10% down · 12.0% · 12mo
- Down + closing
- —
- Monthly P&I
- —
- Monthly cashflow
- —
- DSCR
- —
- Eligible?
- —
Short-term bridge; refi at stabilization.
Rent comps 5 comps
| Address | Beds | Baths | Sqft | Rent | $/sqft | DOM | Units | Dist |
|---|---|---|---|---|---|---|---|---|
| 3501 177th St Country Club Hills, IL | 2.0 | 2.0 | 839 | $2,850 | $3.40 | 1d | 1 | 0.61mi |
| 17984 Amherst Ct Country Club Hills, IL | 2.0 | 1.0 | 1000 | $1,900 | $1.90 | 1d | 1 | 0.88mi |
| 18019 Ravisloe Ter Country Club Hills, IL | 3.0 | 1.5 | 1150 | $2,800 | $2.43 | 1d | 1 | 1.03mi |
| 2722 Larkspur Ln Hazel Crest, IL | 3.0 | 1.5 | 1441 | $2,650 | $1.84 | 12d | 1 | 1.33mi |
| 1153 Williamsburg Rd Country Club Hills, IL | 2.0 | 1.5 | 1216 | $1,900 | $1.56 | 1d | 1 | 1.49mi |
Listing history 7 events
-
2026-04-06status Pending
-
2026-03-26$184,000 Active
-
2008-01-03soldstatus $127,000
-
2007-12-20soldstatus $126,990 232-char remark
Show marketing remark (232 chars)
** SELLER NEEDS TO SELL ** BEAUTIFUL SPLIT LEVEL 3 BED [BIG MASTER BEDROOM WITH DOUBLE CLOSETS] 1.1 BATH. BIG BACK YARD, LOWER LEVEL WITH BIG FAMILY ROOM , LAUNDRY ROOM AND EXTRA BEDROOM. SELLER NEEDS TO SELL ** MAKE AN OFFER TODAY.
-
2007-10-30historical 232-char remark
Show marketing remark (232 chars)
** SELLER NEEDS TO SELL ** BEAUTIFUL SPLIT LEVEL 3 BED [BIG MASTER BEDROOM WITH DOUBLE CLOSETS] 1.1 BATH. BIG BACK YARD, LOWER LEVEL WITH BIG FAMILY ROOM , LAUNDRY ROOM AND EXTRA BEDROOM. SELLER NEEDS TO SELL ** MAKE AN OFFER TODAY.
-
2007-10-19$127,990 232-char remark
Show marketing remark (232 chars)
** SELLER NEEDS TO SELL ** BEAUTIFUL SPLIT LEVEL 3 BED [BIG MASTER BEDROOM WITH DOUBLE CLOSETS] 1.1 BATH. BIG BACK YARD, LOWER LEVEL WITH BIG FAMILY ROOM , LAUNDRY ROOM AND EXTRA BEDROOM. SELLER NEEDS TO SELL ** MAKE AN OFFER TODAY.
-
1989-05-09soldstatus $65,500
ⓘ Source: listings_history table (triggers on properties + properties_extension) + one-shot
backfill from property_details.listing_events for pre-trigger history.
Tax reassessment forecast IL · Partial reset (capped growth)
- Current annual tax
- $8,708 · $726/mo
- Projected year-2 tax
- $8,708 · $726/mo
- Expected delta
- $0/yr ($0/mo · 0.0%)
ⓘ Screening estimate from a state-policy table — verify with the county assessor before closing.
Climate risk First Street
- Flood 1/10 Low FEMA zone X (unshaded) · 0% chance over 30 yrs
- Wildfire 1/10 Low
- Heat 3/10 Moderate 7 d/yr ≥101°F today · 15 d/yr by 30 yrs out
- Wind 2/10 Low
- Air quality 3/10 Moderate 4 unhealthy d/yr today · 4 by 30 yrs out
Nearby sold comps map
Loading sold comps map…
Walkable amenities ~0.75 mi
Loading nearby amenities…
Taxation est. · year 1
- Rental income
- $29,488
- − Mortgage interest
- −$10,307
- − Property taxes
- −$8,708
- − Insurance
- −$920
- − Repairs & maintenance
- −$2,359
- − Management
- −$2,359
- − Depreciation
- −$5,353
- Taxable loss
- −$518
- Est. tax savings @ 24.0%
- +$124
- After-tax cash flow
- $2,212/yr
For passive investors: Depreciation is non-cash, so a rental often shows a tax loss while cash-flowing — sheltering income. Rental losses are passive: they offset passive income freely, and up to $25,000/yr can offset ordinary (W-2) income if you actively participate and your MAGI is under $100k (phasing out to $0 by $150k); unused losses carry forward. On sale, claimed depreciation is recaptured at up to 25%, and gains may owe capital-gains tax (a 1031 exchange can defer both). Figures are a year-1 estimate at your 24.0% rate — not tax advice; consult a CPA.
Schools (NCES district)
- District
- Bremen Chsd 228
- NCES district ID
- 1707050
- Math proficiency
- 15% ▼ -4.00%
- Reading proficiency
- 17% ▼ -5.00%
- Median HH income
- $57,625
- Composite
- 15.32/100
- National rank
- #9327
- State rank
- #468 of 620 in IL
Livability — Hazel Crest
- Score
- 75/100
- State rank
- #229
- US rank
- #4242
Category grades
Schools grade is shown separately in the Schools card above.
Census & demographics
- Census place
- Hazel Crest, IL
- City population
- 14,602
- Population (ZIP)
- 14,602
Population outlook (Cook County) Hauer SSP2
- Today (2025)
- 5,347,519 people
- By 2030
- 5,357,703 · +0.2%
- By 2040
- 5,324,924 · -0.4%
- By 2050
- 5,230,762 · -2.2%
- By 2075
- 4,785,735 · -10.5%
- By 2100
- 4,188,836 · -21.7%
Race, ethnicity, and origin ACS 2023
- Neighborhood character
- Predominantly Black (83%)
- Race & ethnicity
- Black 83% White 7% Hispanic / Latino 7% Two or more races 4%
- Hispanic origin (detail)
- Mexican 6%
- Common ancestry
- Romanian 1% Iranian 1%
- Foreign-born
- 5% · Canada
- Languages at home
- 93% English-only · Spanish 6%
Political lean MEDSL · Cook
- 2024 margin
- Solid D (+42.0) · D 70.4% · R 28.4% · Other 1.2%
- 2008→2024 swing
- -11.4pp toward R · 2008: 53.4pp · 2024: 42.0pp
- All cycles
- 2024: D+42.0 2020: D+50.3 2016: D+53.0 2012: D+49.4 2008: D+53.4
Not yet ingested
- Civics
- —
Market trends
- HPI YoY
- ▼ -46.04%
- Current HPI
- 282.3552
- Rent YoY
- —
- Metro
- —
- State GDP YoY
- ▲ 1.59%
- F500 in state
- 60
Industry mix (Fortune 500 HQ in IL)
| Industry | F500 HQs | Revenue |
|---|---|---|
| Insurance | 4 | $201B |
|
||
| Consumer Goods | 4 | $87B |
|
||
| Industrial Machinery | 3 | $64B |
|
||
| Healthcare | 2 | $55B |
|
||
| Retail / Pharmacy | 1 | $148B |
|
||
| Agriculture / Food | 1 | $86B |
|
||
Price history
+180.9% since first listed7 events — show timeline
- 2026-04-06 Pending — MRED as Distributed by MLS Grid
- 2026-03-26 Listed $184,000 MRED as Distributed by MLS Grid
- 2008-01-03 Sold (Public Records) $127,000 Public Records
- 2007-12-20 Sold (MLS) $126,990 MRED as Distributed by MLS Grid
- 2007-10-30 Listing Removed — MRED as Distributed by MLS Grid
- 2007-10-19 Listed $127,990 MRED as Distributed by MLS Grid
- 1989-05-09 Sold (Public Records) $65,500 Public Records
Property tax history
+7.9%/yrLatest (2023): $8,708 · +82.0% YoY. Source: county tax records.
Cash-flow waterfall
monthlySold comps — $/sqft
last 12 mo · ≤1 miLoading sold comps…