 🏷️ Likely Rental
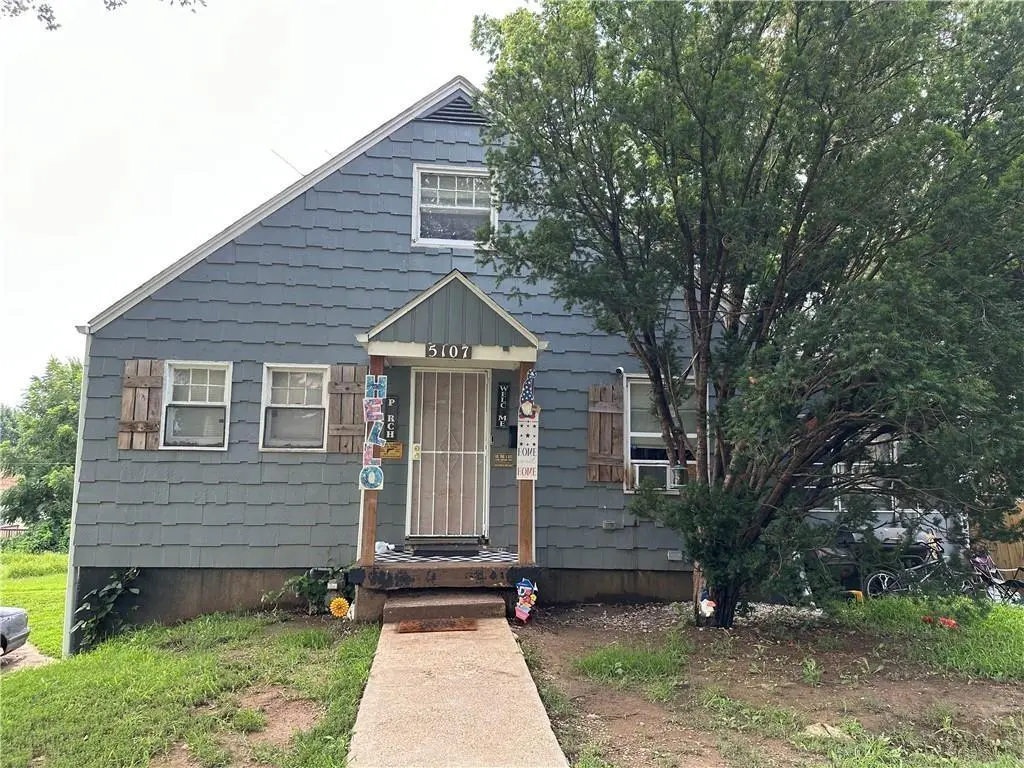
5107 E 40th St · Kansas City, MO
Flood risk 1/10 · Minimal
- FEMA flood zone
- X (unshaded)
- Chance of flooding over 30 yrs
- 0.0%
- Est. flood insurance / yr
- $473 – $860
Fire risk 1/10 · Minimal
- Est. fire insurance / yr
- $1,054 – $1,958
Heat risk 4/10 · Minor
- Hot days now (above 107°F)
- 7 days/yr
- Hot days in 30 yrs
- 17 days/yr
Wind risk 2/10 · Minimal
- Chance of severe wind over 30 yrs
- —
Air-quality risk 3/10 · Minor
- Unhealthy air days now
- 2 days/yr
- Unhealthy air days in 30 yrs
- 3 days/yr
Risk factors via First Street. Map © Google.
Why this score? — see what drove the B grade
The composite is a weighted blend of 9 inputs, each scored 0–100. Each bar is that input's sub-score; the figure is the points it added to the 100-point composite (weight × sub-score).
- Cash flow +28.9/30.0
- ARV discount +15.0/15.0
- DSCR +10.0/10.0
- 1% rule +8.0/10.0
- Livability +3.9/5.0
- Rent growth +3.6/5.0
- Condition / age +2.5/5.0
- Schools +1.5/10.0
- Appreciation +0.0/10.0
$103,400
🖨 Deal sheet 📄 Offer letter ✓ Due diligence
Listing remarks
INVESTOR OPPORTUNITY — Rent-ready 3BR 1.5-story SFR on a nearly quarter-acre lot in Vineyard Terrace. Buyer's choice at closing: property delivered vacant (current tenant has expressed intent to vacate) or with tenant in place — seller will accommodate. Over $9,000 in recent updates: new roof, upgraded electrical panel, remodeled kitchen and bath, new flooring, refinished hardwoods, replacement windows, three window AC units. 1,560 sqft, full unfinished basement, 9,084 sqft lot. Underwritten at market rent of $1,200/mo, 8.0% projected cap at asking with conservative underwriting (5% vacancy, 10% mgmt, 10% R & M). Part of a 4-property KC SFR portfolio — portfolio
Key facts
- Remodeled bathroom
- Remodeled kitchen
- Recent improvements
Tags
Property features AI
Exterior
- Parking: Off-street parking
- Security: Smoke detector(s)
- Utilities: Public water; Public sewer; High-speed internet available
- Home design: Single-family residence; Ranch / 1.5-story
- Construction: Frame construction; Composition roof; Built approximately 76–100 years ago
- Exterior features: City lot; Paved road with public maintenance; Not in a flood plain
Interior
- Kitchen: Cooktop; Refrigerator
- Bedrooms: 3 bedrooms
- Flooring: Vinyl flooring
- Bathrooms: 1 full bathroom
- Heating & cooling: Forced air heating; Window unit air conditioning
- Interior features: Eat-in kitchen; Full basement; Smoke detector(s)
- Laundry & utility: Laundry in basement
Neighborhood map
What this means for you Summary
Snapshot
- This is a 3-bed/1.0-bath single-family listed at $103k.
Deal economics
- At list price, monthly cash flow is $349 ($4k/yr) — positive.
- The deal already cash-flows at list — no discount required.
- Meets the 1% rule at list price ($1k rent vs $103k).
- Recommended offer: $100k (3.0% below list) — sets the bar for market timing.
- Cap rate 10.3% vs local median 3.9% in Kansas City — top-decile yield for the area; either an underpriced asset or a hidden risk that comps aren't pricing in. Stress-test before assuming the spread holds.
Location & tenants
- Location reads 78/100 on livability (#28 in MO, #2,671 nationally) — a middle-class / working-renter tenant base. Strengths: amenities A+, commute A+, cost of living A+; Watch: crime F.
- Kansas City 33 (urban): math 12% / reading 24% proficiency, ranked #308 of 324 in MO (top 95%) — low school quality limits family demand, transient renter base, plan for 1-2y turnover; 75% free/reduced lunch — lower-income household profile, screen leases tightly.
- Zoned schools: George Melcher Elementary (math 2% / reading 8%, grade F, #1,072 of 1,115 statewide, top 98%, 296 students, 99% FRL); Central High School (math 2% / reading 17%, grade F, #507 of 521 statewide, top 98%, 535 students, 99% FRL) — zoned schools average 99% FRL vs 75% district-wide (24 pts higher); higher-poverty schools than district average — tighter screening recommended.
- Market conditions: Rents rising fast (+4.4%/yr); 187 active listings in the ZIP; 23 comparable units currently listed for rent nearby; rentals at typical pace (median 16d on market — plan ~3-4 weeks tenant-placement turnaround); lower-income renter base — watch delinquency; 4,002 units permitted in Jackson County in 2024 (2,271 in 5+ unit buildings).
- This rent runs 38% of the median local income ($42k/yr) — at the standard rent-burdened threshold; future hikes will face affordability resistance.
Forward outlook
- Local home prices are declining (-3.0%/yr); year-one equity from $715 of loan paydown is wiped out by about $3k of value loss. Plan a longer hold.
- Jackson County population projected at +4% by 2050 — modest demand growth; plan on rents tracking national, not racing it.
- At projected returns (-3.0% appreciation + 4.4% rent growth), your $29k cash investment doubles in ~8 years — after that, you're playing with house money.
Negotiation context
- It's been on market 56 days — a 3% lower offer ($100k) is reasonable based on typical stale-listing flexibility.
- 4 sale attempts since 7y ago; this cycle's ask has dropped $12k (10%) from the opening price — seller is motivated, your offer sets the floor, not the list.
- Current owner paid $15k; list at $103k implies a 589% gain — meaningful room to come down on a strong offer.
Risks & watch-outs
- Watch-outs: built in 1953 — expect roof / HVAC / electrical / plumbing capex.
Questions for the listing agent
- It's been on market 56 days. Have you received any prior offers? Is the seller open to a 3% concession, seller financing, or rate buy-down credit?
- Built in 1953 — when were the roof, HVAC, electrical panel, plumbing, and water heater last replaced?
- Is there a deadline driving the sale (1031 exchange, divorce, estate, relocation)? That informs how much negotiation room exists.
- Crime grade is F in this area — have there been break-ins, vandalism, or insurance claims at this property in the last 3 years? What carrier currently insures it and at what premium?
- What's the average days-on-market for RENTAL listings here right now (not sales)? A rising rental-DOM trend means longer vacancies and softer asking-rent achievability than the comps imply.
- What's the recent tenant-quality profile in this submarket — average credit score on applications, eviction rate, late-payment / NSF rate, and stable-employment percentage? A property-management company in the area should have these aggregated.
- How much new for-sale + rental construction is in the pipeline within 1–3 miles? Heavy new supply typically softens prices + rents 12–24 months out; constrained supply supports both.
Investment metrics
- 1% rule
- 1.30% ✓
- Cap rate
- 10.35%
- Cash-on-cash
- 14.48%
- DSCR
- 1.64
- GRM
- 6.4
CMA / ARV
- ARV (median comp)
- $145,853
- List price
- $103,400
- Delta
- -29.11%
- Verdict
- UNDERPRICED
- Comps
- 20 within 1.0 mi
Show comp detail 12 sales within ~0.75 mi
| Address | Dist | Beds/Ba | Sqft | Sold | Price | $/sf | Match |
|---|---|---|---|---|---|---|---|
| 5200 E 39th Ter | 0.10mi | 2/1.0 (-1) | 910 (-2%) | 5mo | $140,000 | $154 | 84 |
| 4132 Spruce Ave | 0.59mi | 3/1.0 | 912 (-1%) | 2mo | $99,995 | $110 | 69 |
| 3918 Oakley Ave | 0.23mi | 3/1.0 | 816 (-12%) | 3mo | $106,000 | $130 | 67 |
| 4504 E 43rd St | 0.54mi | 2/1.0 (-1) | 907 (-2%) | 2mo | $140,000 | $154 | 65 |
| 5622 E 39th St | 0.33mi | 2/1.0 (-1) | 816 (-12%) | 2mo | $80,000 | $98 | 59 |
| 3920 Spruce Ave | 0.55mi | 2/1.0 (-1) | 968 (+5%) | 4mo | $105,000 | $108 | 58 |
| 3942 Myrtle Ave | 0.74mi | 2/1.0 (-1) | 890 (-4%) | 3mo | $85,000 | $96 | 52 |
| 4405 Elmwood Ave | 0.63mi | 2/1.0 (-1) | 966 (+4%) | 8mo | $140,000 | $145 | 52 |
| 3630 Jackson Ave | 0.74mi | 2/1.0 (-1) | 888 (-4%) | 4mo | $59,000 | $66 | 50 |
| 4521 Lawn Ave | 0.73mi | 3/1.0 | 816 (-12%) | 4mo | $88,000 | $108 | 43 |
| 3938 Myrtle Ave | 0.74mi | 2/1.0 (-1) | 805 (-13%) | 0mo | $65,000 | $81 | 39 |
| 4519 Lister Ave | 0.71mi | 2/1.0 (-1) | 816 (-12%) | 6mo | $93,000 | $114 | 37 |
Match score weights: distance 35% · size 25% · config 20% · recency 20%. Top-matched comps best support the ARV.
Projected returns pro-forma
-3.0% appreciation · 4.42% rent growth · sell at horizon
- IRR
- 6.5%
- Equity multiple
- 1.26×
- Total profit
- $7,471
- Equity at exit
- $15,417
- IRR
- 17.1%
- Equity multiple
- 2.50×
- Total profit
- $43,488
- Equity at exit
- $8,940
Cash invested: $28,952 (down + closing). Projections, not guarantees.
Landlord ↔ Tenant lean methodology
- Overall (STATE)
- 81 Strongly Landlord-Friendly
- State Missouri
- 81 Strongly Landlord-Friendly · R+10
- County
- — inherits STATE
- City
- — inherits STATE
ZIP-level market 64130
- Home prices YoY
- -21.5%
- Rents YoY
- 4.4%
- Active inventory
- 187
- Price-to-rent
- 6.4×
Monthly cashflow live
- Estimated rent
- $1,347 high interval (Pro) →
- Mortgage (P&I)
- −$542
- Tax est. 1.5%
- −$129 /mo · $1,551/yr
- Insurance
- −$43
- HOA
- −$0
- Vacancy / Maint / Mgmt
- −$283
- Net cashflow
- $349
Break-even live
UW: 25.0% down · 7.5% · 30yr · 1.5% tax · 5.0% vac · 8.0% maint · 8.0% mgmt
Financing live
Cash to close
- Down payment
- $25,850
- Closing costs
- $3,102
- Reserves months
- —
- Total cash needed
- —
Loan-product check · same deal, 3 products live
Conventional
25% down · 7.5% · 30yr
- Down + closing
- —
- Monthly P&I
- —
- Monthly cashflow
- —
- DSCR
- —
- Eligible?
- —
Personal DTI + credit; lowest rate.
DSCR
20% down · 8.5% · 30yr
- Down + closing
- —
- Monthly P&I
- —
- Monthly cashflow
- —
- DSCR
- —
- Eligible?
- —
No personal income docs; deal must DSCR.
Hard money
10% down · 12.0% · 12mo
- Down + closing
- —
- Monthly P&I
- —
- Monthly cashflow
- —
- DSCR
- —
- Eligible?
- —
Short-term bridge; refi at stabilization.
Rent comps 23 comps
| Address | Beds | Baths | Sqft | Rent | $/sqft | DOM | Units | Dist |
|---|---|---|---|---|---|---|---|---|
| 5601 E 39th Ter Kansas City, MO | 3.0 | 1.0 | 816 | $1,225 | $1.50 | 3d | 1 | 0.25mi |
| 4902 E 39th St Kansas City, MO | 2.0 | 1.0 | 820 | $1,300 | $1.59 | 16d | 1 | 0.25mi |
| 3911 Oakley Ave Kansas City, MO | 2.0 | 1.0 | 816 | $1,195 | $1.46 | 12d | 1 | 0.25mi |
| 4206 Vineyard Rd Kansas City, MO | 4.0 | 1.5 | 1056 | $1,500 | $1.42 | 14d | 1 | 0.26mi |
| 5636 E 40th St Kansas City, MO | 3.0 | 1.0 | 816 | $1,225 | $1.50 | 3d | 1 | 0.32mi |
| 5700 E 40th St Kansas City, MO | 3.0 | 1.0 | 816 | $1,245 | $1.53 | 21d | 1 | 0.33mi |
| 5707 E 40th St Kansas City, MO | 3.0 | 1.0 | 816 | $1,295 | $1.59 | 12d | 1 | 0.36mi |
| 3736 Cypress Ave Kansas City, MO | 3.0 | 1.0 | 1100 | $1,200 | $1.09 | 7d | 1 | 0.50mi |
| 4028 Myrtle Ave Kansas City, MO | 3.0 | 1.0 | 1100 | $1,490 | $1.35 | 43d | 1 | 0.75mi |
| 3414 Elmwood Ave Kansas City, MO | 4.0 | 1.0 | 1109 | $1,300 | $1.17 | 16d | 1 | 0.78mi |
| 3437 Jackson Ave Kansas City, MO | 2.0 | 1.0 | 700 | $1,150 | $1.64 | 16d | 1 | 0.87mi |
| 3243 Denver Dr Kansas City, MO | 1.0–3.0 | 1.0 | 862 | $1,226 | $1.42 | 43d | 1 | 0.92mi |
| 4216 Cleveland Ave Kansas City, MO | 2.0 | 1.0 | 780 | $1,125 | $1.44 | 16d | 1 | 0.92mi |
| 4005 Bales Ave Kansas City, MO | 2.0 | 1.0 | 792 | $1,050 | $1.33 | 43d | 1 | 1.03mi |
| 3118 Chelsea Ave Kansas City, MO | 2.0 | 1.0 | 864 | $980 | $1.13 | 43d | 1 | 1.08mi |
| 3032 Elmwood Ave Kansas City, MO | 3.0 | 1.0 | 1027 | $1,275 | $1.24 | 7d | 1 | 1.20mi |
| 4144 College Ave Kansas City, MO | 3.0 | 1.0 | 1108 | $1,095 | $0.99 | 23d | 1 | 1.21mi |
| 4309 College Ave Kansas City, MO | 3.0 | 2.0 | 1040 | $1,550 | $1.49 | 16d | 1 | 1.22mi |
| 5108 E 30th St Kansas City, MO | 3.0 | 1.0 | 960 | $1,400 | $1.46 | 3d | 1 | 1.24mi |
| 2855 Van Brunt Blvd Unit A Kansas City, MO | 2.0 | 1.0 | 744 | $1,080 | $1.45 | 43d | 1 | 1.37mi |
| 3310 College Ave Kansas City, MO | 3.0 | 1.0 | 874 | $995 | $1.14 | 43d | 1 | 1.43mi |
| 4427 Agnes Ave Kansas City, MO | 3.0 | 1.0 | 1100 | $1,350 | $1.23 | 16d | 1 | 1.46mi |
| 3949 Doctor Martin Luther King Junior Blvd Kansas City, MO | 1.0–2.0 | 1.0–2.0 | 945 | $1,565 | $1.66 | 2d | 3 | 1.49mi |
Listing history 27 events
-
2026-06-18days on market $103,400 Active 56 DOM
-
2026-06-17days on market $103,400 Active 55 DOM
-
2026-06-16days on market $103,400 Active 54 DOM
-
2026-06-15price $103,400 Active 53 DOM
-
2026-06-15days on market $109,000 Active 53 DOM
-
2026-06-13remarks 677-char remark
-
2026-06-13days on market $109,000 Active 51 DOM
-
2026-06-10price $109,000 Active 47 DOM
-
2026-06-09days on market $115,000 Active 47 DOM
-
2026-06-08days on market $115,000 Active 46 DOM
-
2026-06-07days on market $115,000 Active 45 DOM
-
2026-06-05days on market $115,000 Active 42 DOM
-
2026-06-03days on market $115,000 Active 41 DOM
-
2026-06-02days on market $115,000 Active 40 DOM
-
2026-06-01days on market $115,000 Active 39 DOM
-
2026-05-31days on market $115,000 Active 38 DOM
-
2026-04-23$115,000 Active 631-char remark
-
2025-10-13historical
-
2025-08-02$115,000 Active
-
2025-07-25historical
-
2025-05-28price $117,950
-
2025-01-23$118,950 Active
-
2020-01-28soldstatus Sold
-
2020-01-28soldstatus $15,000
-
2020-01-22status Pending
-
2020-01-13historical Contingent - Accepting Backup Offers
-
2019-11-13$19,900 Active
ⓘ Source: listings_history table (triggers on properties + properties_extension) + one-shot
backfill from property_details.listing_events for pre-trigger history.
Climate risk First Street
- Flood 1/10 Low FEMA zone X (unshaded) · 0% chance over 30 yrs
- Wildfire 1/10 Low
- Heat 4/10 Moderate 7 d/yr ≥107°F today · 17 d/yr by 30 yrs out
- Wind 2/10 Low
- Air quality 3/10 Moderate 2 unhealthy d/yr today · 3 by 30 yrs out
Nearby sold comps map
Loading sold comps map…
Walkable amenities ~0.75 mi
Loading nearby amenities…
Taxation est. · year 1
- Rental income
- $16,162
- − Mortgage interest
- −$5,792
- − Property taxes
- −$1,551
- − Insurance
- −$517
- − Repairs & maintenance
- −$1,293
- − Management
- −$1,293
- − Depreciation
- −$3,008
- Taxable income
- $2,708
- Est. tax owed @ 24.0%
- −$650
- After-tax cash flow
- $3,543/yr
For passive investors: Depreciation is non-cash, so a rental often shows a tax loss while cash-flowing — sheltering income. Rental losses are passive: they offset passive income freely, and up to $25,000/yr can offset ordinary (W-2) income if you actively participate and your MAGI is under $100k (phasing out to $0 by $150k); unused losses carry forward. On sale, claimed depreciation is recaptured at up to 25%, and gains may owe capital-gains tax (a 1031 exchange can defer both). Figures are a year-1 estimate at your 24.0% rate — not tax advice; consult a CPA.
Schools (NCES district)
- District
- Kansas City 33
- NCES district ID
- 2916400
- Math proficiency
- 12% ▼ -8.00%
- Reading proficiency
- 24% ▬ 0.00%
- Median HH income
- $35,227
- Composite
- 14.8/100
- National rank
- #9387
- State rank
- #308 of 324 in MO
Livability — Kansas City
- Score
- 78/100
- State rank
- #28
- US rank
- #2671
Category grades
Schools grade is shown separately in the Schools card above.
Census & demographics
- Census place
- Kansas City, MO
- County
- Jackson County · 687,798 people
- City population
- 439,467
- Metro
- Kansas City, MO-KS
- Population (ZIP)
- 19,644
- Household income
- $42,221
- Rent vs Own
- Severe rent burden
- 1132.0
Population outlook (Jackson County) Hauer SSP2
- Today (2025)
- 719,589 people
- By 2030
- 731,456 · +1.6%
- By 2040
- 746,689 · +3.8%
- By 2050
- 749,289 · +4.1%
- By 2075
- 736,227 · +2.3%
- By 2100
- 668,210 · -7.1%
Race, ethnicity, and origin ACS 2023
- Neighborhood character
- Predominantly Black (80%)
- Race & ethnicity
- Black 80% White 9% Hispanic / Latino 8% Two or more races 6%
- Hispanic origin (detail)
- Mexican 5%
- Common ancestry
- Lithuanian 1% Swedish 0%
- Foreign-born
- 6% · Canada
- Languages at home
- 92% English-only · Spanish 7%
Political lean MEDSL · Jackson
- 2024 margin
- D (+19.3) · D 58.9% · R 39.5% · Other 1.6%
- 2008→2024 swing
- -6.1pp toward R · 2008: 25.4pp · 2024: 19.3pp
- All cycles
- 2024: D+19.3 2020: D+22.0 2016: D+16.6 2012: D+19.0 2008: D+25.4
Not yet ingested
- Civics
- —
Market trends
- HPI YoY
- ▼ -73.32%
- Current HPI
- 267.491
- Rent YoY
- ▲ 4.42%
- Metro
- Kansas City, MO-KS
- State GDP YoY
- ▲ 1.84%
- F500 in state
- 20
Industry mix (Fortune 500 HQ in MO)
| Industry | F500 HQs | Revenue |
|---|---|---|
| Healthcare | 1 | $163B |
|
||
| Insurance | 1 | $21B |
|
||
| Industrial Technology | 1 | $17B |
|
||
| Retail | 1 | $16B |
|
||
| Industrial Distribution | 1 | $10B |
|
||
| Utilities | 1 | $9B |
|
||
Price history
+419.6% since first listed13 events — show timeline
- 2026-06-15 Price Changed $103,400 Heartland MLS as Distributed by MLS Grid
- 2026-06-09 Price Changed $109,000 Heartland MLS as Distributed by MLS Grid
- 2026-04-23 Listed $115,000 Heartland MLS as Distributed by MLS Grid
- 2025-10-13 Listing Removed — Heartland MLS as Distributed by MLS Grid
- 2025-08-02 Listed $115,000 Heartland MLS as Distributed by MLS Grid
- 2025-07-25 Listing Removed — Heartland MLS as Distributed by MLS Grid
- 2025-05-28 Price Changed $117,950 Heartland MLS as Distributed by MLS Grid
- 2025-01-23 Listed $118,950 Heartland MLS as Distributed by MLS Grid
- 2020-01-28 Sold (Public Records) $15,000 Public Records
- 2020-01-28 Sold (MLS) — Heartland MLS as Distributed by MLS Grid
- 2020-01-22 Pending — Heartland MLS as Distributed by MLS Grid
- 2020-01-13 Contingent — Heartland MLS as Distributed by MLS Grid
- 2019-11-13 Listed $19,900 Heartland MLS as Distributed by MLS Grid
Property tax history
+35.4%/yrLatest (2025): $5,826 · +11.0% YoY. Source: county tax records.
Cash-flow waterfall
monthlySold comps — $/sqft
last 12 mo · ≤1 miLoading sold comps…