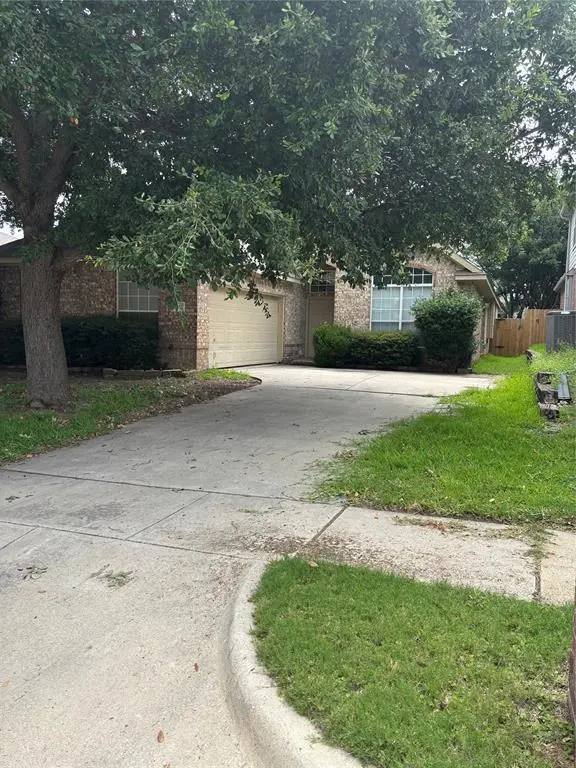
5012 Woodmeadow Dr · Fort Worth, TX
Flood risk 1/10 · Minimal
- FEMA flood zone
- X (unshaded)
- Chance of flooding over 30 yrs
- 0.0%
- Est. flood insurance / yr
- $507 – $1,088
Fire risk 3/10 · Minor
- Est. fire insurance / yr
- $1,222 – $2,270
Heat risk 7/10 · Major
- Hot days now (above 109°F)
- 7 days/yr
- Hot days in 30 yrs
- 24 days/yr
Wind risk 4/10 · Minor
- Chance of severe wind over 30 yrs
- 20.0%
Air-quality risk 3/10 · Minor
- Unhealthy air days now
- 3 days/yr
- Unhealthy air days in 30 yrs
- 4 days/yr
Risk factors via First Street. Map © Google.
Why this score? — see what drove the D grade
The composite is a weighted blend of 9 inputs, each scored 0–100. Each bar is that input's sub-score; the figure is the points it added to the 100-point composite (weight × sub-score).
- ARV discount +15.0/15.0
- Cash flow +7.4/30.0
- 1% rule +4.0/10.0
- Livability +4.0/5.0
- Schools +3.5/10.0
- Rent growth +2.6/5.0
- Condition / age +2.5/5.0
- DSCR +1.5/10.0
- Appreciation +0.0/10.0
$240,000
🖨 Deal sheet (PDF) 📄 Offer letter ✓ Due diligence
Listing remarks MLS
Immaculate open floor plan with split bedrooms and large island kitchen. This home boasts laminate and tile flooring throughout. Clean and ready for new owners.
Key facts
- 5,750 sq ft lot
- 2 garage spots
- Community pool
Tags
Property features AI
Finance
- Financial info: Listing terms: Cash
- HOA & community: Mandatory association; Annual HOA fee covers grounds maintenance; Community pool
Exterior
- Parking: 2 covered parking spaces; 2-car garage with garage door opener (approx. 19' wide x 20' deep x 8' high)
- Security: Burglar alarm; Fire alarm
- Utilities: City water; City sewer; Cable available
- Home design: Single-family residence; Single-story
- Construction: Brick exterior; Composition roof; Slab foundation; Built in 2001
- Exterior features: Gutters; Wood fencing; Interior lot
Interior
- Kitchen: Dishwasher; Disposal; Electric oven; Gas range; Breakfast bar; Breakfast room adjacent to kitchen
- Bedrooms: 3 bedrooms (all on the main level); Primary bedroom on main level with ensuite bath, garden tub, separate shower, and walk-in closet
- Flooring: Tile flooring
- Bathrooms: 2 full bathrooms
- Heating & cooling: Central air conditioning; Fireplace heating with gas logs
- Interior features: Cable TV available; Eat-in kitchen; High-speed internet available; One living area; One dining area; 9 total rooms
- Laundry & utility: Washer hookup; Electric dryer hookup; Utility room on main level
Neighborhood map
What this means for you Summary
Snapshot
- This is a 3-bed/2.0-bath single-family listed at $240k.
Deal economics
- At list price, monthly cash flow is $-313 ($-4k/yr) — negative.
- To cash-flow at today's rent, offer at most $185k (23.0% below list).
- To meet the 1% rule (rent ≥ 1% of price), the offer needs to be $215k (10.2% below list).
- Recommended offer: $185k (23.0% below list) — sets the bar for cash-flow.
- Cap rate 4.7% vs local median 3.9% in Fort Worth — meaningfully above typical; check what's discounted (condition, days-on-market, listing class) to confirm the premium yield is real.
Location & tenants
- Location reads 80/100 on livability (#49 in TX, #1,954 nationally) — a professional / high-income tenant draw. Strengths: amenities A+, cost of living A+, housing A+; Watch: crime F.
- Eagle Mt-Saginaw ISD (urban): math 35% / reading 42% proficiency, ranked #361 of 826 in TX (top 44%) — families likely to look elsewhere, expect single-tenant / working-renter base with shorter leases.
- Zoned schools: Saginaw El (math 22% / reading 27%, grade F, #3,052 of 4,322 statewide, top 74%, 333 students, 69% FRL); Ed Willkie Middle (math 35% / reading 43%, grade F, #690 of 1,662 statewide, top 42%, 730 students, 48% FRL); Chisholm Trail H S (math 27% / reading 55%, grade F, #774 of 1,632 statewide, top 49%, 2,493 students, 48% FRL) — zoned schools average 55% FRL vs 36% district-wide (20 pts higher); higher-poverty schools than district average — tighter screening recommended.
- Market conditions: Rents flat; 160 active listings in the ZIP; 40 comparable units currently listed for rent nearby; rentals at typical pace (median 21d on market — plan ~3-4 weeks tenant-placement turnaround); 18,938 units permitted in Tarrant County in 2024 (8,336 in 5+ unit buildings).
- This rent runs 35% of the median local income ($75k/yr) — at the standard rent-burdened threshold; future hikes will face affordability resistance.
Forward outlook
- Local home prices are declining (-3.0%/yr); year-one equity from $2k of loan paydown is wiped out by about $7k of value loss. Plan a longer hold.
- Tarrant County population projected at +41% by 2050 — long-run rental-demand tailwind backs the buy-and-hold thesis.
Negotiation context
- Only 4 days on market — expect competitive offers; lowballing is unlikely to land.
- 3 sale attempts since 19y ago with the ask held roughly flat each time — persistent listings suggest the price (not the market) is what's stuck; bring a comps-based counter.
Risks & watch-outs
- Watch-outs: property tax is 3.1% of price.
- Climate carrying-cost: extreme-heat days projected 7→24/yr by 2055 (HVAC capex compounding) — expect insurance premiums to compound above CPI over the hold.
Questions for the listing agent
- What do current leases actually rent for vs. the listed asking? Can we see a recent rent roll and the last 12 months of T-12 income?
- Property tax is high relative to price — has the assessment been appealed recently, and will the sale trigger a re-assessment?
- What does the HOA fee cover, when was the last increase, and are there any pending special assessments or reserve-fund shortfalls?
- Is there a deadline driving the sale (1031 exchange, divorce, estate, relocation)? That informs how much negotiation room exists.
- Schools are D-rated, which usually means shorter tenancies and higher turnover. Who's the typical renter profile here, and what's been the actual vacancy rate?
- Crime grade is F in this area — have there been break-ins, vandalism, or insurance claims at this property in the last 3 years? What carrier currently insures it and at what premium?
- The area grade is low — what's the realistic commute time and amenity access for the typical tenant pool here? Any planned neighborhood developments (good or bad) we should know about?
- What's the average days-on-market for RENTAL listings here right now (not sales)? A rising rental-DOM trend means longer vacancies and softer asking-rent achievability than the comps imply.
- What's the recent tenant-quality profile in this submarket — average credit score on applications, eviction rate, late-payment / NSF rate, and stable-employment percentage? A property-management company in the area should have these aggregated.
- How much new for-sale + rental construction is in the pipeline within 1–3 miles? Heavy new supply typically softens prices + rents 12–24 months out; constrained supply supports both.
Investment metrics
- 1% rule
- 0.90% ✗
- Cap rate
- 4.73%
- Cash-on-cash
- -5.58%
- DSCR
- 0.75
- GRM
- 9.3
CMA / ARV
- ARV (on-the-fly)
- $320,760
- Comps found
- 12
Show comp detail 12 sales within ~0.75 mi
| Address | Dist | Beds/Ba | Sqft | Sold | Price | $/sf | Match |
|---|---|---|---|---|---|---|---|
| 5000 Coral Creek Dr | 0.11mi | 3/2.0 | 2,008 (+1%) | 5mo | $289,900 | $144 | 89 |
| 5709 Fair Wind St | 0.34mi | 3/2.0 | 2,048 (+3%) | 5mo | $335,000 | $164 | 75 |
| 6208 S Ridge Rd | 0.19mi | 3/2.0 | 1,824 (-8%) | 5mo | $310,000 | $170 | 73 |
| 5013 Royal Burgess Dr | 0.40mi | 3/2.0 | 1,864 (-6%) | 4mo | $297,400 | $160 | 68 |
| 5741 Starboardway Dr | 0.22mi | 3/2.0 | 1,705 (-14%) | 2mo | $300,000 | $176 | 65 |
| 5713 Glenshee Dr | 0.57mi | 3/2.0 | 1,868 (-6%) | 4mo | $270,000 | $145 | 61 |
| 5244 Hill Ridge Dr | 0.34mi | 3/2.0 | 1,715 (-13%) | 2mo | $294,000 | $171 | 60 |
| 5357 Kingsknowe Pkwy | 0.67mi | 3/2.0 | 1,868 (-6%) | 2mo | $265,000 | $142 | 58 |
| 5404 Royal Birkdale Dr | 0.58mi | 3/2.0 | 1,732 (-12%) | 4mo | $299,900 | $173 | 49 |
| 5709 Crowder Dr | 0.71mi | 3/2.0 | 1,806 (-9%) | 4mo | $285,000 | $158 | 49 |
| 5632 Broken Gap Dr | 0.73mi | 3/2.0 | 1,788 (-10%) | 5mo | $289,000 | $162 | 45 |
| 5633 Broken Gap Dr | 0.73mi | 4/2.0 (+1) | 2,125 (+7%) | 5mo | $324,999 | $153 | 45 |
Match score weights: distance 35% · size 25% · config 20% · recency 20%. Top-matched comps best support the ARV.
Projected returns pro-forma
-3.0% appreciation · 0.48% rent growth · sell at horizon
- IRR
- -29.3%
- Equity multiple
- 0.05×
- Total profit
- $-63,880
- Equity at exit
- $35,785
- IRR
- -49.1%
- Equity multiple
- -0.50×
- Total profit
- $-101,037
- Equity at exit
- $20,751
Cash invested: $67,200 (down + closing). Projections, not guarantees.
Landlord ↔ Tenant lean methodology
- Overall (STATE)
- 87 Strongly Landlord-Friendly
- State Texas
- 87 Strongly Landlord-Friendly · R+5
- County
- — inherits STATE
- City
- — inherits STATE
ZIP-level market 76135
- Home prices YoY
- -17.3%
- Rents YoY
- 0.5%
- Active inventory
- 160
- Price-to-rent
- 9.3×
Monthly cashflow live
- Estimated rent
- $2,155 high interval (Pro) →
- Mortgage (P&I)
- −$1,259
- Tax from tax record
- −$629 /mo · $7,554/yr
- Insurance
- −$100
- HOA
- −$27
- Vacancy / Maint / Mgmt
- −$453
- Net cashflow
- $-313
Break-even live
Sensitivity live
| Price | -10% $-177 | -5% $-245 | +0% $-313 | +5% $-381 | +10% $-448 |
|---|---|---|---|---|---|
| Rent | -10% $-483 | -5% $-398 | +0% $-313 | +5% $-228 | +10% $-142 |
| Rate | -1.0pp $-192 | -0.5pp $-252 | base $-313 | +0.5pp $-375 | +1.0pp $-438 |
UW: 25.0% down · 7.5% · 30yr · 1.5% tax · 5.0% vac · 8.0% maint · 8.0% mgmt
Financing live
Cash to close
- Down payment
- $60,000
- Closing costs
- $7,200
- Reserves months
- —
- Total cash needed
- —
Loan-product check · same deal, 3 products live
Conventional
25% down · 7.5% · 30yr
- Down + closing
- —
- Monthly P&I
- —
- Monthly cashflow
- —
- DSCR
- —
- Eligible?
- —
Personal DTI + credit; lowest rate.
DSCR
20% down · 8.5% · 30yr
- Down + closing
- —
- Monthly P&I
- —
- Monthly cashflow
- —
- DSCR
- —
- Eligible?
- —
No personal income docs; deal must DSCR.
Hard money
10% down · 12.0% · 12mo
- Down + closing
- —
- Monthly P&I
- —
- Monthly cashflow
- —
- DSCR
- —
- Eligible?
- —
Short-term bridge; refi at stabilization.
Rent comps 40 comps
| Address | Beds | Baths | Sqft | Rent | $/sqft | DOM | Units | Dist |
|---|---|---|---|---|---|---|---|---|
| 4729 Oarlock Dr Fort Worth, TX | 3.0 | 2.0 | 1384 | $1,700 | $1.23 | 14d | 1 | 0.20mi |
| 5604 Nacona Dr Fort Worth, TX | 4.0 | 2.5 | 2267 | $2,349 | $1.04 | 17d | 1 | 0.47mi |
| 5424 Royal Birkdale Dr Fort Worth, TX | 3.0 | 2.0 | 1560 | $1,820 | $1.17 | 45d | 1 | 0.54mi |
| 5308 Newcastle Ln Fort Worth, TX | 3.0 | 2.0 | 1640 | $1,781 | $1.09 | 17d | 1 | 0.62mi |
| 5312 Newcastle Ln Fort Worth, TX | 3.0 | 2.0 | 1904 | $2,120 | $1.11 | 7d | 1 | 0.62mi |
| 5301 Prestwick Dr Fort Worth, TX | 3.0 | 2.0 | 1722 | $2,075 | $1.20 | 1d | 1 | 0.64mi |
| 5421 Lansdowne Ave Fort Worth, TX | 4.0 | 2.5 | 2524 | $2,200 | $0.87 | 20d | 1 | 0.65mi |
| 5920 Paloma Blanca Dr Fort Worth, TX | 3.0 | 2.0 | 2110 | $2,450 | $1.16 | 22d | 1 | 0.65mi |
| 5920 Paloma Blanca Dr Fort Worth, TX | 3.0 | 2.0 | 2110 | $2,450 | $1.16 | 26d | 1 | 0.65mi |
| 5920 Paloma Blanca Dr Fort Worth, TX | 3.0 | 2.0 | 2110 | $2,450 | $1.16 | 9d | 1 | 0.65mi |
| 5437 New Castleton Ln Fort Worth, TX | 3.0 | 2.5 | 2323 | $1,995 | $0.86 | 45d | 1 | 0.68mi |
| 6037 Horse Trap Dr Fort Worth, TX | 3.0 | 2.0 | 1864 | $2,200 | $1.18 | 26d | 1 | 0.75mi |
| 5800 Pearl Oyster Ln Fort Worth, TX | 3.0 | 2.0 | 1858 | $2,050 | $1.10 | 20d | 1 | 0.76mi |
| 5400 Huffines Blvd Fort Worth, TX | 1.0–3.0 | 1.0–3.0 | 1151 | $2,564 | $2.23 | 1d | 28 | 0.78mi |
| 5740 Brookville Dr Fort Worth, TX | 3.0 | 2.0 | 1990 | $2,650 | $1.33 | 26d | 1 | 0.78mi |
| 4809 Maryannes Meadow Dr Fort Worth, TX | 3.0 | 2.5 | 1418 | $2,200 | $1.55 | 9d | 1 | 0.79mi |
| 5920 Westgate Dr Fort Worth, TX | 3.0 | 2.0 | 1996 | $2,200 | $1.10 | 6d | 1 | 0.80mi |
| 4804 Deal Dr Fort Worth, TX | 3.0 | 2.0 | 1325 | $1,995 | $1.51 | 8d | 1 | 0.83mi |
| 6424 Canyon Trl Fort Worth, TX | 3.0 | 2.0 | 1801 | $2,160 | $1.20 | 14d | 1 | 0.86mi |
| 4804 Saint Thomas Pl Fort Worth, TX | 3.0 | 2.0 | 1776 | $2,070 | $1.17 | 1d | 1 | 0.88mi |
| 5222 Shadydell Dr Unit 13205 Fort Worth, TX | 2.0 | 2.0 | 1401 | $2,350 | $1.68 | 14d | 1 | 0.89mi |
| 5222 Shadydell Dr Unit 7205 Fort Worth, TX | 2.0 | 2.0 | 1401 | $2,275 | $1.62 | 6d | 1 | 0.89mi |
| 5222 Shadydell Dr Unit 10308 Fort Worth, TX | 2.0 | 2.0 | 1324 | $1,985 | $1.50 | 14d | 1 | 0.89mi |
| 5820 Water Ridge Ct Fort Worth, TX | 4.0 | 2.5 | 2402 | $2,100 | $0.87 | 1d | 1 | 0.89mi |
| 4920 Lemon Grove Dr Fort Worth, TX | 3.0 | 2.0 | 1608 | $2,075 | $1.29 | 22d | 1 | 0.91mi |
| 5817 Brookville Dr Fort Worth, TX | 3.0 | 2.0 | 1620 | $2,295 | $1.42 | 26d | 1 | 0.91mi |
| 6201 Azle Ave Fort Worth, TX | 1.0–3.0 | 1.0–2.0 | 1039 | $2,177 | $2.09 | 0d | 22 | 0.93mi |
| 4109 Ridgecrest Cir Lake Worth, TX | 3.0 | 2.0 | 1640 | $1,850 | $1.13 | 22d | 1 | 1.00mi |
| 5712 Azle Ave Unit 5745 Fort Worth, TX | 3.0 | 2.0 | 1246 | $1,453 | $1.17 | 45d | 1 | 1.19mi |
| 5712 Azle Ave Unit 3121 Fort Worth, TX | 3.0 | 2.0 | 1246 | $1,402 | $1.13 | 1d | 1 | 1.19mi |
| 3917 Mantis St Fort Worth, TX | 4.0 | 2.0 | 1821 | $2,200 | $1.21 | 45d | 1 | 1.20mi |
| 5920 Halls Lake Loop Fort Worth, TX | 4.0 | 3.0 | 2390 | $2,950 | $1.23 | 0d | 1 | 1.30mi |
| 6220 Obsidian Creek Dr Fort Worth, TX | 3.0 | 2.0 | 2017 | $2,045 | $1.01 | 26d | 1 | 1.33mi |
| 6209 Obsidian Creek Dr Fort Worth, TX | 3.0 | 2.0 | 1583 | $2,150 | $1.36 | 22d | 1 | 1.35mi |
| 4400 Hodgkins Rd Lake Worth, TX | 4.0 | 1.0 | 1788 | $2,000 | $1.12 | 22d | 1 | 1.37mi |
| 6320 White Jade Dr Fort Worth, TX | 3.0 | 2.0 | 1597 | $2,200 | $1.38 | 26d | 1 | 1.38mi |
| 4876 E Williams Spring Rd Fort Worth, TX | 3.0 | 3.0 | 2221 | $2,650 | $1.19 | 26d | 1 | 1.42mi |
| 6260 Trinity Creek Dr Fort Worth, TX | 3.0 | 2.0 | 1310 | $2,150 | $1.64 | 14d | 1 | 1.45mi |
| 5729 Spirit Lake Dr Fort Worth, TX | 3.0 | 2.0 | 1925 | $2,575 | $1.34 | 21d | 1 | 1.47mi |
| 6644 Windfall Dr Fort Worth, TX | 4.0 | 3.5 | 2362 | $2,600 | $1.10 | 26d | 1 | 1.47mi |
HOA detail
- Monthly dues
- $27 · $324/yr
Listing history 3 events
-
2026-06-21days on market $240,000 Active 4 DOM
-
2026-06-17remarks 499-char remark
-
2026-06-17$240,000 Active 1 DOM
ⓘ Source: listings_history table (triggers on properties + properties_extension) + one-shot
backfill from property_details.listing_events for pre-trigger history.
Tax reassessment forecast TX · Resets to sale price
- Current annual tax
- $7,554 · $629/mo
- Projected year-2 tax
- $7,554 · $629/mo
- Expected delta
- $0/yr ($0/mo · 0.0%)
ⓘ Screening estimate from a state-policy table — verify with the county assessor before closing.
Climate risk First Street
- Flood 1/10 Low FEMA zone X (unshaded) · 0% chance over 30 yrs
- Wildfire 3/10 Moderate
- Heat 7/10 Severe 7 d/yr ≥109°F today · 24 d/yr by 30 yrs out
- Wind 4/10 Moderate 20% chance of damaging wind over 30 yrs
- Air quality 3/10 Moderate 3 unhealthy d/yr today · 4 by 30 yrs out
Nearby sold comps map
Loading sold comps map…
Walkable amenities ~0.75 mi
Loading nearby amenities…
Taxation est. · year 1
- Rental income
- $25,860
- − Mortgage interest
- −$13,444
- − Property taxes
- −$7,554
- − Insurance
- −$1,200
- − Repairs & maintenance
- −$2,069
- − Management
- −$2,069
- − HOA
- −$324
- − Depreciation
- −$6,982
- Taxable loss
- −$7,781
- Est. tax savings @ 24.0%
- +$1,867
- After-tax cash flow
- $-1,884/yr
For passive investors: Depreciation is non-cash, so a rental often shows a tax loss while cash-flowing — sheltering income. Rental losses are passive: they offset passive income freely, and up to $25,000/yr can offset ordinary (W-2) income if you actively participate and your MAGI is under $100k (phasing out to $0 by $150k); unused losses carry forward. On sale, claimed depreciation is recaptured at up to 25%, and gains may owe capital-gains tax (a 1031 exchange can defer both). Figures are a year-1 estimate at your 24.0% rate — not tax advice; consult a CPA.
Schools (NCES district)
- District
- Eagle Mt-Saginaw ISD
- NCES district ID
- 4817700
- Math proficiency
- 35% ▼ -16.00%
- Reading proficiency
- 42% ▼ -9.00%
- Median HH income
- $72,781
- Composite
- 35.41/100
- National rank
- #4945
- State rank
- #361 of 826 in TX
Livability — Fort Worth
- Score
- 80/100
- State rank
- #49
- US rank
- #1954
Category grades
Schools grade is shown separately in the Schools card above.
Census & demographics
- Census place
- Fort Worth, TX
- County
- Tarrant County · 2,033,669 people
- City population
- 911,619
- Metro
- Dallas-Fort Worth-Arlington, TX
- Population (ZIP)
- 19,445
- Household income
- $74,621
- Rent vs Own
- Severe rent burden
- 798.0
Population outlook (Tarrant County) Hauer SSP2
- Today (2025)
- 2,380,417 people
- By 2030
- 2,578,900 · +8.3%
- By 2040
- 2,974,995 · +25.0%
- By 2050
- 3,350,489 · +40.8%
- By 2075
- 4,216,909 · +77.2%
- By 2100
- 4,741,527 · +99.2%
Race, ethnicity, and origin ACS 2023
- Neighborhood character
- Majority White (63%)
- Race & ethnicity
- White 63% Hispanic / Latino 26% Two or more races 11% Black 8%
- Hispanic origin (detail)
- Mexican 22%
- Common ancestry
- Italian 2% Romanian 2% Russian 2%
- Foreign-born
- 7% · Canada, Jamaica
- Languages at home
- 80% English-only · Spanish 19% Russian/Polish/Slavic 1%
Political lean MEDSL · Tarrant
- 2024 margin
- Lean R (+5.1) · D 46.7% · R 51.9% · Other 1.4%
- 2008→2024 swing
- +6.6pp toward D · 2008: -11.7pp · 2024: -5.1pp
- All cycles
- 2024: R+5.1 2020: D+0.2 2016: R+8.7 2012: R+15.7 2008: R+11.7
Not yet ingested
- Civics
- —
Market trends
- HPI YoY
- ▼ -63.93%
- Current HPI
- 305.0929
- Rent YoY
- ▲ 0.48%
- Metro
- Dallas-Fort Worth-Arlington, TX
- State GDP YoY
- ▲ 3.95%
- F500 in state
- 110
Industry mix (Fortune 500 HQ in TX)
| Industry | F500 HQs | Revenue |
|---|---|---|
| Energy | 16 | $1,198B |
|
||
| Technology | 5 | $198B |
|
||
| Engineering / Construction | 4 | $72B |
|
||
| Energy Services | 3 | $60B |
|
||
| Utilities | 3 | $41B |
|
||
| Healthcare | 2 | $330B |
|
||
Price history
+88.2% since first listed10 events — show timeline
- 2026-06-17 Listed $240,000 NTREIS
- 2009-07-07 Sold (Public Records) — Public Records
- 2009-06-26 Sold (MLS) — NTREIS
- 2009-06-01 Listing Removed — NTREIS
- 2009-05-04 Listed $137,500 NTREIS
- 2007-06-29 Sold (Public Records) — Public Records
- 2007-06-29 Sold (Public Records) — Public Records
- 2007-06-25 Sold (MLS) — NTREIS
- 2007-06-12 Listing Removed — NTREIS
- 2007-03-19 Listed $127,500 NTREIS
Property tax history
+4.8%/yrLatest (2025): $7,554 · +8.5% YoY. Source: county tax records.
Cash-flow waterfall
monthlySold comps — $/sqft
last 12 mo · ≤1 miLoading sold comps…