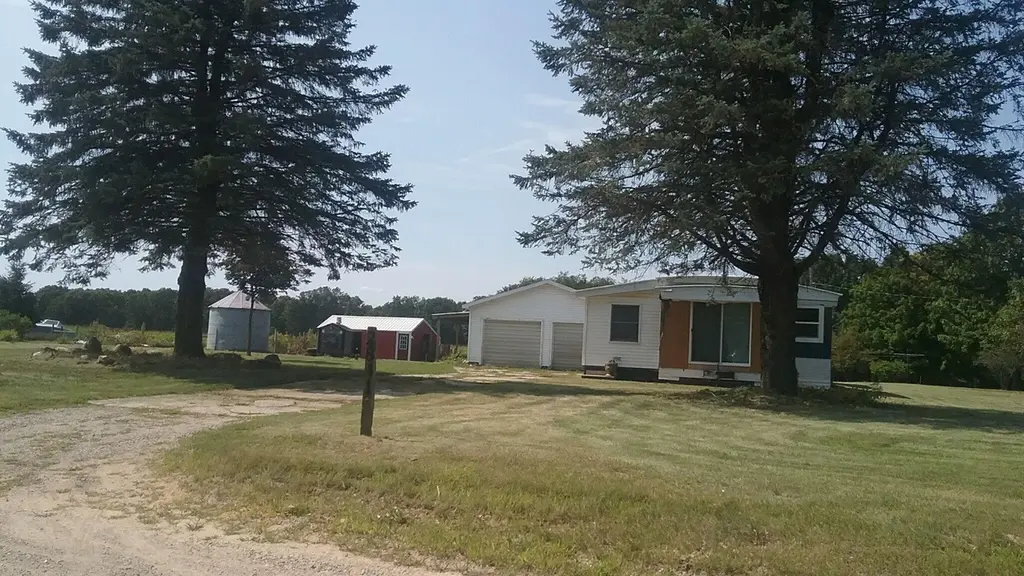
2841 Whites Brg · Keene, MI
Flood risk 1/10 · Minimal
- FEMA flood zone
- X (unshaded)
- Chance of flooding over 30 yrs
- 0.0%
- Est. flood insurance / yr
- $507 – $1,088
Fire risk 1/10 · Minimal
- Est. fire insurance / yr
- $784 – $1,456
Heat risk 2/10 · Minimal
- Hot days now (above 98°F)
- 7 days/yr
- Hot days in 30 yrs
- 15 days/yr
Wind risk 2/10 · Minimal
- Chance of severe wind over 30 yrs
- —
Air-quality risk 2/10 · Minimal
- Unhealthy air days now
- 1 days/yr
- Unhealthy air days in 30 yrs
- 2 days/yr
Risk factors via First Street. Map © Google.
Why this score? — see what drove the D- grade
The composite is a weighted blend of 9 inputs, each scored 0–100. Each bar is that input's sub-score; the figure is the points it added to the 100-point composite (weight × sub-score).
- Appreciation +10.0/10.0
- ARV discount +7.5/15.0
- Cash flow +7.4/30.0
- Rent growth +2.5/5.0
- Livability +2.5/5.0
- Condition / age +2.5/5.0
- Schools +2.3/10.0
- DSCR +1.5/10.0
- 1% rule +1.4/10.0
$175,000
🖨 Deal sheet 📄 Offer letter ✓ Due diligence
Listing remarks MLS
3 bedroom, 1 bath, kitchen dinning open floor bed. 2 stall garage sitting on 1.63acres over looking over the river. Mobile home. On a fixed foundation basement partially. With furnace and hot water heater in it. Home has additional barn for horse. Go see it today ! Get accepted offer today!!
Key facts
- Fixed foundation
- Over looking river
- Additional barn
Tags
Property features AI
Exterior
- Parking: Detached 2-car garage
- Utilities: Well water; Electricity available; High-speed internet
- Home design: Residential property; Other architectural style; Built in 1971
- Construction: Aluminum siding; Aluminum/metal roof; Partial crawl space basement
- Exterior features: 1.63-acre lot
Interior
- Kitchen: Microwave; Range; Refrigerator
- Bedrooms: Total of 5 rooms (includes living areas and kitchen)
- Bathrooms: 1 full bathroom
- Heating & cooling: Forced air heating; Hot water heating
- Interior features: LP tank is rented; Replacement windows; 36-inch entrance door
- Laundry & utility: Laundry room
Neighborhood map
What this means for you Summary
Snapshot
- This is a 2-bed/1.0-bath manufactured listed at $175k.
Deal economics
- At list price, monthly cash flow is $-228 ($-3k/yr) — negative.
- To cash-flow at today's rent, offer at most $135k (23.0% below list).
- To meet the 1% rule (rent ≥ 1% of price), the offer needs to be $112k (35.7% below list).
- Recommended offer: $112k (35.7% below list) — sets the bar for 1% rule.
Location & tenants
- Location reads: area grade D — affects rentability + tenant quality, not the cash-flow math above.
- Belding Area School District (town): math 23% / reading 31% proficiency, ranked #398 of 540 in MI (top 74%) — low school quality limits family demand, transient renter base, plan for 1-2y turnover.
- Market conditions: 72 active listings in the ZIP; 94 units permitted in Ionia County in 2024 (0 in 5+ unit buildings).
Forward outlook
- In year one you build about $19k of equity ($1k loan paydown + $18k appreciation (10.0% local appreciation)).
- Ionia County population projected to shrink 8% by 2050 — rents likely to lag national; underwrite the cash flow, not the appreciation.
- By year 2, paydown + projected appreciation supports a ~$30k cash-out refi (75% LTV) — recoverable capital for the next deal without selling this one.
Negotiation context
- Only 11 days on market — expect competitive offers; lowballing is unlikely to land.
- 3 sale attempts with the ask held roughly flat each time — persistent listings suggest the price (not the market) is what's stuck; bring a comps-based counter.
- Current owner paid $30k; list at $175k implies a 483% gain — meaningful room to come down on a strong offer.
Questions for the listing agent
- What do current leases actually rent for vs. the listed asking? Can we see a recent rent roll and the last 12 months of T-12 income?
- Built in 1971 — when were the roof, HVAC, electrical panel, plumbing, and water heater last replaced?
- Is there a deadline driving the sale (1031 exchange, divorce, estate, relocation)? That informs how much negotiation room exists.
- The area grade is low — what's the realistic commute time and amenity access for the typical tenant pool here? Any planned neighborhood developments (good or bad) we should know about?
- What's the average days-on-market for RENTAL listings here right now (not sales)? A rising rental-DOM trend means longer vacancies and softer asking-rent achievability than the comps imply.
- What's the recent tenant-quality profile in this submarket — average credit score on applications, eviction rate, late-payment / NSF rate, and stable-employment percentage? A property-management company in the area should have these aggregated.
- How much new for-sale + rental construction is in the pipeline within 1–3 miles? Heavy new supply typically softens prices + rents 12–24 months out; constrained supply supports both.
Investment metrics
- 1% rule
- 0.64% ✗
- Cap rate
- 4.73%
- Cash-on-cash
- -5.59%
- DSCR
- 0.75
- GRM
- 13.0
CMA / ARV
No comps found within radius.
Projected returns pro-forma
10.0% appreciation · 3.0% rent growth · sell at horizon
- IRR
- 20.3%
- Equity multiple
- 2.65×
- Total profit
- $80,733
- Equity at exit
- $157,654
- IRR
- 18.5%
- Equity multiple
- 6.08×
- Total profit
- $249,098
- Equity at exit
- $339,987
Cash invested: $49,000 (down + closing). Projections, not guarantees.
Landlord ↔ Tenant lean methodology
- Overall (STATE)
- 62 Landlord-Friendly
- State Michigan
- 62 Landlord-Friendly · EVEN
- County
- — inherits STATE
- City
- — inherits STATE
ZIP-level market 48809
- Home prices YoY
- 3.3%
- Active inventory
- 72
- Price-to-rent
- 13.0×
Monthly cashflow live
- Estimated rent
- $1,125 medium interval (Pro) →
- Mortgage (P&I)
- −$918
- Tax from tax record
- −$126 /mo · $1,512/yr
- Insurance
- −$73
- HOA
- −$0
- Vacancy / Maint / Mgmt
- −$236
- Net cashflow
- $-228
Break-even live
UW: 25.0% down · 7.5% · 30yr · 1.5% tax · 5.0% vac · 8.0% maint · 8.0% mgmt
Financing live
Cash to close
- Down payment
- $43,750
- Closing costs
- $5,250
- Reserves months
- —
- Total cash needed
- —
Loan-product check · same deal, 3 products live
Conventional
25% down · 7.5% · 30yr
- Down + closing
- —
- Monthly P&I
- —
- Monthly cashflow
- —
- DSCR
- —
- Eligible?
- —
Personal DTI + credit; lowest rate.
DSCR
20% down · 8.5% · 30yr
- Down + closing
- —
- Monthly P&I
- —
- Monthly cashflow
- —
- DSCR
- —
- Eligible?
- —
No personal income docs; deal must DSCR.
Hard money
10% down · 12.0% · 12mo
- Down + closing
- —
- Monthly P&I
- —
- Monthly cashflow
- —
- DSCR
- —
- Eligible?
- —
Short-term bridge; refi at stabilization.
Listing history 9 events
-
2026-06-18days on market $175,000 Active 11 DOM
-
2026-06-17days on market $175,000 Active 10 DOM
-
2026-06-16days on market $175,000 Active 9 DOM
-
2026-06-15days on market $175,000 Active 8 DOM
-
2026-06-14days on market $175,000 Active 6 DOM
-
2026-06-10days on market $175,000 Active 3 DOM
-
2026-06-09days on market $175,000 Active 2 DOM
-
2026-06-08remarks 294-char remark
-
2026-06-08$175,000 Active 1 DOM
ⓘ Source: listings_history table (triggers on properties + properties_extension) + one-shot
backfill from property_details.listing_events for pre-trigger history.
Tax reassessment forecast MI · Partial reset (capped growth)
- Current annual tax
- $1,512 · $126/mo
- Projected year-2 tax
- $2,104 · $175/mo
- Expected delta
- +$591/yr (+$49/mo · 39.1%)
ⓘ Screening estimate from a state-policy table — verify with the county assessor before closing.
Climate risk First Street
- Flood 1/10 Low FEMA zone X (unshaded) · 0% chance over 30 yrs
- Wildfire 1/10 Low
- Heat 2/10 Low 7 d/yr ≥98°F today · 15 d/yr by 30 yrs out
- Wind 2/10 Low
- Air quality 2/10 Low 1 unhealthy d/yr today · 2 by 30 yrs out
Nearby sold comps map
Loading sold comps map…
Walkable amenities ~0.75 mi
Loading nearby amenities…
Taxation est. · year 1
- Rental income
- $13,495
- − Mortgage interest
- −$9,803
- − Property taxes
- −$1,512
- − Insurance
- −$875
- − Repairs & maintenance
- −$1,080
- − Management
- −$1,080
- − Depreciation
- −$5,091
- Taxable loss
- −$5,945
- Est. tax savings @ 24.0%
- +$1,427
- After-tax cash flow
- $-1,312/yr
For passive investors: Depreciation is non-cash, so a rental often shows a tax loss while cash-flowing — sheltering income. Rental losses are passive: they offset passive income freely, and up to $25,000/yr can offset ordinary (W-2) income if you actively participate and your MAGI is under $100k (phasing out to $0 by $150k); unused losses carry forward. On sale, claimed depreciation is recaptured at up to 25%, and gains may owe capital-gains tax (a 1031 exchange can defer both). Figures are a year-1 estimate at your 24.0% rate — not tax advice; consult a CPA.
Schools (NCES district)
- District
- Belding Area School District
- NCES district ID
- 2604530
- Math proficiency
- 23% ▼ -9.00%
- Reading proficiency
- 31% ▼ -8.00%
- Median HH income
- $46,310
- Composite
- 23.33/100
- National rank
- #7915
- State rank
- #398 of 540 in MI
Livability — Keene
No livability data for this city. (Only ~50 U.S. cities are tracked.)
Census & demographics
- Population (ZIP)
- 11,292
Population outlook (Ionia County) Hauer SSP2
- Today (2025)
- 63,958 people
- By 2030
- 63,321 · -1.0%
- By 2040
- 61,544 · -3.8%
- By 2050
- 58,682 · -8.2%
- By 2075
- 48,909 · -23.5%
- By 2100
- 35,867 · -43.9%
Race, ethnicity, and origin ACS 2023
- Neighborhood character
- Predominantly White (91%)
- Race & ethnicity
- White 91% Hispanic / Latino 4% Two or more races 4%
- Common ancestry
- Iranian 7% Romanian 4% Lithuanian 3%
- Foreign-born
- 1% · Canada, China
- Languages at home
- 95% English-only · Spanish 3% Russian/Polish/Slavic 1%
Political lean MEDSL · Ionia
- 2024 margin
- Solid R (+31.9) · D 33.3% · R 65.2% · Other 1.5%
- 2008→2024 swing
- -26.0pp toward R · 2008: -5.8pp · 2024: -31.9pp
- All cycles
- 2024: R+31.9 2020: R+30.3 2016: R+31.0 2012: R+12.8 2008: R+5.8
Not yet ingested
- Civics
- —
Market trends
- HPI YoY
- ▲ 13.30%
- Current HPI
- 412.5108
- Rent YoY
- —
- Metro
- —
- State GDP YoY
- ▲ 1.37%
- F500 in state
- 28
Industry mix (Fortune 500 HQ in MI)
| Industry | F500 HQs | Revenue |
|---|---|---|
| Automotive Parts | 3 | $48B |
|
||
| Automotive | 2 | $372B |
|
||
| Chemicals | 1 | $45B |
|
||
| Automotive Retail | 1 | $29B |
|
||
| Healthcare / Medical Devices | 1 | $23B |
|
||
| Automotive Technology | 1 | $20B |
|
||
Price history
+483.3% since first listed4 events — show timeline
- 2026-06-07 Listed $175,000 REALCOMP
- 2026-06-07 Listed $175,000 MiRealSource-MiMLS
- 2026-06-07 Listed $175,000 SW Michigan MLS
- 2016-03-28 Sold (Public Records) $30,000 Public Records
Property tax history
+11.0%/yrLatest (2025): $1,512 · +4.2% YoY. Source: county tax records.
Cash-flow waterfall
monthlySold comps — $/sqft
last 12 mo · ≤1 miLoading sold comps…