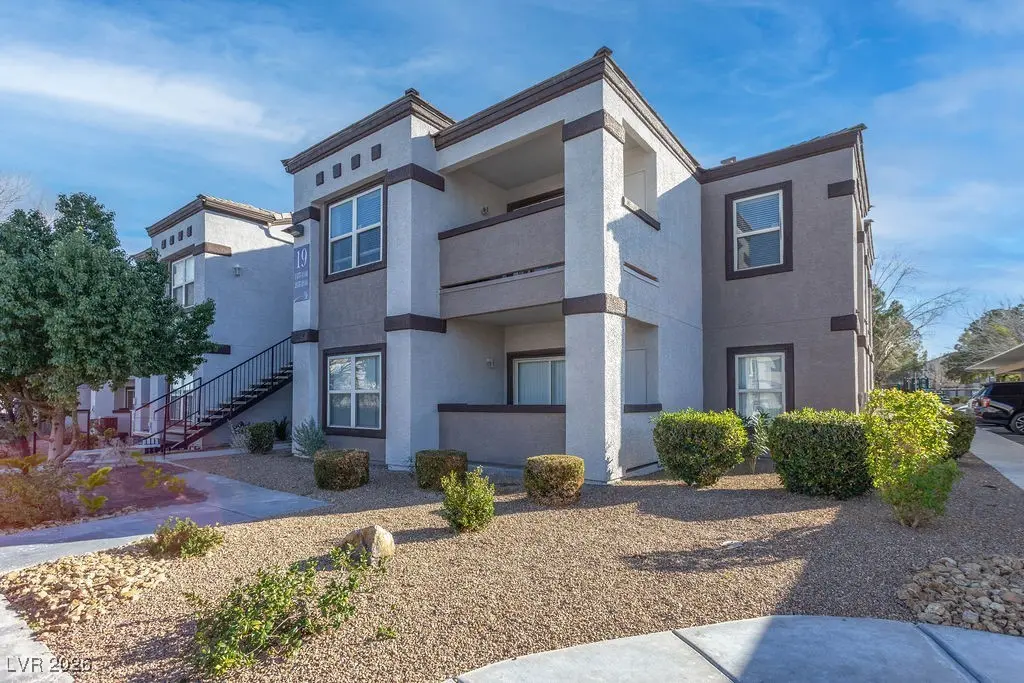
7255 W Sunset Rd #1140 · Spring Valley, NV
Flood risk 1/10 · Minimal
- FEMA flood zone
- X (unshaded)
- Chance of flooding over 30 yrs
- 0.0%
- Est. flood insurance / yr
- $507 – $1,088
Fire risk 5/10 · Moderate
- Est. fire insurance / yr
- $490 – $910
Heat risk 7/10 · Major
- Hot days now (above 105°F)
- 5 days/yr
- Hot days in 30 yrs
- 12 days/yr
Wind risk 1/10 · Minimal
- Chance of severe wind over 30 yrs
- —
Air-quality risk 3/10 · Minor
- Unhealthy air days now
- 2 days/yr
- Unhealthy air days in 30 yrs
- 3 days/yr
Risk factors via First Street. Map © Google.
Why this score? — see what drove the C- grade
The composite is a weighted blend of 9 inputs, each scored 0–100. Each bar is that input's sub-score; the figure is the points it added to the 100-point composite (weight × sub-score).
- Cash flow +22.0/30.0
- ARV discount +7.5/15.0
- DSCR +7.0/10.0
- 1% rule +6.1/10.0
- Livability +3.5/5.0
- Rent growth +2.6/5.0
- Schools +2.6/10.0
- Condition / age +2.5/5.0
- Appreciation +0.0/10.0
$230,000
🖨 Deal sheet (PDF) 📄 Offer letter ✓ Due diligence
Listing remarks MLS
Simple elegance best describes this delightful condo on the south side of town. This bright first-floor condo features 2 bedrooms & 2 bathrooms in a quiet gated community. The tranquil living room has attractive floors with crisp walls, and is filled with natural light. The kitchen inspires casual suppers with its custom cabinets, modern stainless steel appliances & attractive granite counter tops. Two quiet bedrooms ensure a good night's rest with their plush carpets & spacious walk-in closets, each with separate bathrooms for early-morning convenience. A washer & dryer are in the kitchen closet making laundry a breeze. Enjoy relaxing breakfasts or afternoon drinks on the private covered patio for a stress-free lifestyle. Close to shopping, restaurants & Hwy 215, it is the perfect home in an ideal location. This charming community includes a community pool & gate, covered carports plus ample guest parking for visitors. This condo is a "must-see" so please visit today!
Key facts
- Gated community
- Custom cabinets
- Community pool
Tags
Neighborhood map
What this means for you Summary
Snapshot
- This is a 2-bed/2.0-bath condo listed at $230k.
Deal economics
- At list price, monthly cash flow is $367 ($4k/yr) — positive.
- The deal already cash-flows at list — no discount required.
- Meets the 1% rule at list price ($3k rent vs $230k).
- Recommended offer: $202k (12.0% below list) — sets the bar for market timing.
Location & tenants
- Location reads 70/100 on livability (#28 in NV) — a middle-class / working-renter tenant base. Strengths: housing A+, commute A; Watch: crime C-, amenities F, health & safety F.
- Clark County School District (urban): math 21% / reading 39% proficiency, ranked #11 of 17 in NV (top 65%) — families likely to look elsewhere, expect single-tenant / working-renter base with shorter leases.
- Zoned schools: Earl Marion B Es (math 13% / reading 31%, grade F, #266 of 402 statewide, top 68%, 505 students, 100% FRL); Sawyer Grant Ms (math 14% / reading 28%, grade F, #74 of 109 statewide, top 69%, 1,142 students, 100% FRL); Durango Hs (math 12% / reading 31%, grade F, #91 of 131 statewide, top 70%, 2,330 students, 100% FRL) — zoned schools average 100% FRL vs 52% district-wide (48 pts higher); higher-poverty schools than district average — tighter screening recommended.
- Market conditions: Rents flat; 429 active listings in the ZIP; 22 comparable units currently listed for rent nearby; rentals leasing fast (median 6d on market — plan ~1-2 weeks tenant-placement turnaround); solid renter incomes; 14,754 units permitted in Clark County in 2024 (2,301 in 5+ unit buildings).
- This rent runs 32% of the median local income ($94k/yr) — at the standard rent-burdened threshold; future hikes will face affordability resistance.
Forward outlook
- Local home prices are declining (-3.0%/yr); year-one equity from $2k of loan paydown is wiped out by about $7k of value loss. Plan a longer hold.
- Clark County population projected at +36% by 2050 — long-run rental-demand tailwind backs the buy-and-hold thesis.
Negotiation context
- It's been on market 161 days — a 12% lower offer ($202k) is reasonable based on typical stale-listing flexibility.
- 5 sale attempts since 17y ago; this cycle's ask has dropped $18k (7%) from the opening price — seller is motivated, your offer sets the floor, not the list.
- Current owner paid $55k; list at $230k implies a 318% gain — meaningful room to come down on a strong offer.
Risks & watch-outs
- Climate carrying-cost: moderate wildfire risk; extreme-heat days projected 5→12/yr by 2055 (HVAC capex compounding) — expect insurance premiums to compound above CPI over the hold.
Questions for the listing agent
- It's been on market 161 days. Have you received any prior offers? Is the seller open to a 12% concession, seller financing, or rate buy-down credit?
- What does the HOA fee cover, when was the last increase, and are there any pending special assessments or reserve-fund shortfalls?
- Any open or pending special assessments — roof, HVAC, plumbing, elevator, façade? What's the per-unit balance and payoff schedule, and is the seller paying it off at close or rolling it to the buyer?
- Why hasn't it sold? Are there any deal-killer items the seller is aware of (foundation, flood, title, zoning, code violations)?
- Is there a deadline driving the sale (1031 exchange, divorce, estate, relocation)? That informs how much negotiation room exists.
- Schools are D-rated, which usually means shorter tenancies and higher turnover. Who's the typical renter profile here, and what's been the actual vacancy rate?
- What's the average days-on-market for RENTAL listings here right now (not sales)? A rising rental-DOM trend means longer vacancies and softer asking-rent achievability than the comps imply.
- What's the recent tenant-quality profile in this submarket — average credit score on applications, eviction rate, late-payment / NSF rate, and stable-employment percentage? A property-management company in the area should have these aggregated.
- How much new apartment / multifamily construction is in the pipeline within 1–3 miles? Heavy new supply (>2% of stock underway) typically softens rents 12–24 months out; light construction supports rent growth.
Investment metrics
- 1% rule
- 1.11% ✓
- Cap rate
- 8.21%
- Cash-on-cash
- 6.83%
- DSCR
- 1.30
- GRM
- 7.5
CMA / ARV
No comps found within radius.
Projected returns pro-forma
-3.0% appreciation · 0.26% rent growth · sell at horizon
- IRR
- -9.0%
- Equity multiple
- 0.68×
- Total profit
- $-20,683
- Equity at exit
- $34,294
- IRR
- -3.8%
- Equity multiple
- 0.78×
- Total profit
- $-14,187
- Equity at exit
- $19,886
Cash invested: $64,400 (down + closing). Projections, not guarantees.
Landlord ↔ Tenant lean methodology
- Overall (STATE)
- 71 Landlord-Friendly
- State Nevada
- 71 Landlord-Friendly · R+1
- County
- — inherits STATE
- City
- — inherits STATE
ZIP-level market 89113
- Home prices YoY
- -15.1%
- Rents YoY
- 0.3%
- Active inventory
- 429
- Price-to-rent
- 7.5×
Monthly cashflow live
- Estimated rent
- $2,545 high interval (Pro) →
- Mortgage (P&I)
- −$1,206
- Tax from tax record
- −$64 /mo · $769/yr
- Insurance
- −$96
- HOA
- −$278
- Lot rent
- −$0
- Vacancy / Maint / Mgmt
- −$534
- Net cashflow
- $367
Break-even live
Sensitivity live
| Price | -10% $497 | -5% $432 | +0% $367 | +5% $301 | +10% $236 |
|---|---|---|---|---|---|
| Rent | -10% $165 | -5% $266 | +0% $367 | +5% $467 | +10% $568 |
| Rate | -1.0pp $482 | -0.5pp $425 | base $367 | +0.5pp $307 | +1.0pp $246 |
UW: 25.0% down · 7.5% · 30yr · 1.5% tax · 5.0% vac · 8.0% maint · 8.0% mgmt
Financing live
Cash to close
- Down payment
- $57,500
- Closing costs
- $6,900
- Reserves months
- —
- Total cash needed
- —
Loan-product check · same deal, 3 products live
Conventional
25% down · 7.5% · 30yr
- Down + closing
- —
- Monthly P&I
- —
- Monthly cashflow
- —
- DSCR
- —
- Eligible?
- —
Personal DTI + credit; lowest rate.
DSCR
20% down · 8.5% · 30yr
- Down + closing
- —
- Monthly P&I
- —
- Monthly cashflow
- —
- DSCR
- —
- Eligible?
- —
No personal income docs; deal must DSCR.
Hard money
10% down · 12.0% · 12mo
- Down + closing
- —
- Monthly P&I
- —
- Monthly cashflow
- —
- DSCR
- —
- Eligible?
- —
Short-term bridge; refi at stabilization.
Rent comps 22 comps
| Address | Beds | Baths | Sqft | Rent | $/sqft | DOM | Units | Dist |
|---|---|---|---|---|---|---|---|---|
| 7255 W Sunset Rd Las Vegas, NV | 1.0–2.0 | 1.0–2.0 | 875 | $3,200 | $3.66 | 14d | 10 | 0.20mi |
| 7255 W Sunset Rd Las Vegas, NV | 1.0–2.0 | 1.0–2.0 | 875 | $3,200 | $3.66 | 6d | 7 | 0.20mi |
| 7255 W Sunset Rd Las Vegas, NV | 1.0–2.0 | 1.0–2.0 | 875 | $3,200 | $3.66 | 24d | 10 | 0.20mi |
| 7255 W Sunset Rd Las Vegas, NV | 1.0–2.0 | 1.0–2.0 | 875 | $3,200 | $3.66 | 1d | 8 | 0.20mi |
| 7255 W Sunset Rd Las Vegas, NV | 1.0–2.0 | 1.0–2.0 | 875 | $3,200 | $3.66 | 13d | 9 | 0.20mi |
| 6775 Badura Ave Las Vegas, NV | 1.0–3.0 | 1.0–2.0 | 1085 | $2,138 | $1.97 | 1d | 115 | 0.80mi |
| 7960 Rafael Rivera Way Las Vegas, NV | 1.0–3.0 | 1.0–2.0 | 1017 | $1,866 | $1.84 | 0d | 26 | 0.83mi |
| 6755 W Arby Ave Las Vegas, NV | 2.0 | 1.0–2.0 | 830 | $3,073 | $3.70 | 5d | 18 | 0.95mi |
| 6650 W Warm Springs Rd Las Vegas, NV | 1.0–2.0 | 1.0–2.0 | 899 | $1,500 | $1.67 | 14d | 2 | 0.96mi |
| 6650 W Warm Springs Rd Las Vegas, NV | 1.0–2.0 | 1.0–2.0 | 862 | $1,750 | $2.03 | 1d | 10 | 0.96mi |
| 6650 W Warm Springs Rd Las Vegas, NV | 1.0–2.0 | 1.0–2.0 | 862 | $1,750 | $2.03 | 26d | 6 | 0.96mi |
| 7413 W Russell Rd Las Vegas, NV | 1.0–3.0 | 1.0–2.0 | 1020 | $1,780 | $1.75 | 0d | 13 | 0.96mi |
| 7017 S Buffalo Dr Las Vegas, NV | 1.0–3.0 | 1.0–2.0 | 1113 | $1,800 | $1.62 | 5d | 21 | 1.06mi |
| 8030 W Maule Ave Las Vegas, NV | 2.0 | 1.0–2.0 | 1013 | $3,038 | $3.00 | 1d | 63 | 1.07mi |
| 7340 W Russell Rd Las Vegas, NV | 1.0–3.0 | 1.0–2.0 | 1152 | $1,916 | $1.66 | 0d | 12 | 1.10mi |
| 8000 Badura Ave Las Vegas, NV | 1.0–3.0 | 1.0–2.0 | 928 | $1,362 | $1.47 | 46d | 12 | 1.11mi |
| 8000 Badura Ave Las Vegas, NV | 1.0–3.0 | 1.0–2.0 | 928 | $1,410 | $1.52 | 1d | 11 | 1.11mi |
| 8000 Badura Ave Las Vegas, NV | 1.0–3.0 | 1.0–2.0 | 928 | $1,388 | $1.49 | 46d | 11 | 1.11mi |
| 8150 Rafael Rivera Way Las Vegas, NV | 3.0 | 1.0–2.0 | 1069 | $2,408 | $2.25 | 4d | 29 | 1.12mi |
| 8251 W Sunset Rd Las Vegas, NV | 1.0–2.0 | 1.0–2.0 | 1011 | $2,379 | $2.35 | 1d | 15 | 1.25mi |
| 8025 W Russell Rd Las Vegas, NV | 1.0–2.0 | 1.0–2.0 | 1007 | $1,740 | $1.73 | 46d | 1 | 1.50mi |
| 8070 W Russell Rd Las Vegas, NV | 1.0–2.0 | 1.0–2.0 | 816 | $1,699 | $2.08 | 46d | 5 | 1.50mi |
HOA detail condo
- Monthly dues
- $278 · $3,336/yr
- Likely covers
- poolsecurity
- Assessments
- None detected in remarks — confirm with the listing agent.
Listing history 27 events
-
2026-06-22days on market $230,000 Active Under Contract 161 DOM
-
2026-06-21statusdays on market $230,000 Active Under Contract 160 DOM
-
2026-06-18days on market $230,000 Active 157 DOM
-
2026-06-18price $230,000 Active 156 DOM
-
2026-06-17days on market $248,000 Active 156 DOM
-
2026-06-16days on market $248,000 Active 155 DOM
-
2026-06-15days on market $248,000 Active 154 DOM
-
2026-06-13days on market $248,000 Active 152 DOM
-
2026-06-09days on market $248,000 Active 148 DOM
-
2026-06-08days on market $248,000 Active 147 DOM
-
2026-06-07days on market $248,000 Active 146 DOM
-
2026-06-03days on market $248,000 Active 142 DOM
-
2026-06-02days on market $248,000 Active 141 DOM
-
2026-06-01days on market $248,000 Active 140 DOM
-
2026-05-31days on market $248,000 Active 139 DOM
-
2026-01-12$248,000 Active 1029-char remark
Show marketing remark (1029 chars)
Simple elegance best describes this delightful condo on the south side of town. This bright first-floor condo features 2 bedrooms & 2 bathrooms in a quiet gated community. The tranquil living room has attractive floors with crisp walls, and is filled with natural light. The kitchen inspires casual suppers with its custom cabinets, modern stainless steel appliances & attractive granite counter tops. Two quiet bedrooms ensure a good night's rest with their plush carpets & spacious walk-in closets, each with separate bathrooms for early-morning convenience. A washer & dryer are in the kitchen closet making laundry a breeze. Enjoy relaxing breakfasts or afternoon drinks on the private covered patio for a stress-free lifestyle. Close to shopping, restaurants & Hwy 215, it is the perfect home in an ideal location. This charming community includes a community pool & gate, covered carports plus ample guest parking for visitors. This condo is a "must-see" so please visit today!
-
2025-05-08historical
-
2025-03-10status Active
-
2025-03-05historical Active Under Contract
-
2025-01-04status Active
-
2024-12-22historical Active Under Contract
-
2024-10-26$265,000 Active
-
2009-09-10soldstatus $55,000
-
2009-09-10historical
-
2009-03-12$59,000
-
2005-10-20soldstatus $17,346,571
-
2000-05-25soldstatus $3,000,000
ⓘ Source: listings_history table (triggers on properties + properties_extension) + one-shot
backfill from property_details.listing_events for pre-trigger history.
Tax reassessment forecast NV · Resets to sale price
- Current annual tax
- $769 · $64/mo
- Projected year-2 tax
- $1,357 · $113/mo
- Expected delta
- +$588/yr (+$49/mo · 76.5%)
ⓘ Screening estimate from a state-policy table — verify with the county assessor before closing.
Climate risk First Street
- Flood 1/10 Low FEMA zone X (unshaded) · 0% chance over 30 yrs
- Wildfire 5/10 Major
- Heat 7/10 Severe 5 d/yr ≥105°F today · 12 d/yr by 30 yrs out
- Wind 1/10 Low
- Air quality 3/10 Moderate 2 unhealthy d/yr today · 3 by 30 yrs out
Nearby sold comps map
Loading sold comps map…
Walkable amenities ~0.75 mi
Loading nearby amenities…
Taxation est. · year 1
- Rental income
- $30,541
- − Mortgage interest
- −$12,884
- − Property taxes
- −$769
- − Insurance
- −$1,150
- − Repairs & maintenance
- −$2,443
- − Management
- −$2,443
- − HOA
- −$3,336
- − Depreciation
- −$6,691
- Taxable income
- $825
- Est. tax owed @ 24.0%
- −$198
- After-tax cash flow
- $4,200/yr
For passive investors: Depreciation is non-cash, so a rental often shows a tax loss while cash-flowing — sheltering income. Rental losses are passive: they offset passive income freely, and up to $25,000/yr can offset ordinary (W-2) income if you actively participate and your MAGI is under $100k (phasing out to $0 by $150k); unused losses carry forward. On sale, claimed depreciation is recaptured at up to 25%, and gains may owe capital-gains tax (a 1031 exchange can defer both). Figures are a year-1 estimate at your 24.0% rate — not tax advice; consult a CPA.
Schools (NCES district)
- District
- Clark County School District
- NCES district ID
- 3200060
- Math proficiency
- 21% ▼ -13.00%
- Reading proficiency
- 39% ▼ -8.00%
- Median HH income
- $53,611
- Composite
- 26.48/100
- National rank
- #7211
- State rank
- #11 of 17 in NV
Livability — Spring Valley
- Score
- 70/100
- State rank
- #28
- US rank
- #8005
Category grades
Schools grade is shown separately in the Schools card above.
Census & demographics
- Census place
- Spring Valley, NV
- County
- Clark County · 2,306,105 people
- City population
- 251,006
- Metro
- Las Vegas-Henderson-Paradise, NV
- Population (ZIP)
- 38,094
- Household income
- $94,461
- Rent vs Own
- Severe rent burden
- 1515.0
Population outlook (Clark County) Hauer SSP2
- Today (2025)
- 2,504,101 people
- By 2030
- 2,693,770 · +7.6%
- By 2040
- 3,061,208 · +22.2%
- By 2050
- 3,400,072 · +35.8%
- By 2075
- 4,139,522 · +65.3%
- By 2100
- 4,596,916 · +83.6%
Race, ethnicity, and origin ACS 2023
- Neighborhood character
- Highly diverse neighborhood (Simpson 0.74)
- Race & ethnicity
- White 40% Asian 25% Hispanic / Latino 18% Two or more races 14% Black 10% Pacific Islander 1%
- Hispanic origin (detail)
- Mexican 13% Puerto Rican 1%
- Common ancestry
- Romanian 2% Lithuanian 1% Italian 1%
- Foreign-born
- 25% · China, Canada, South Korea
- Languages at home
- 66% English-only · Spanish 10% Chinese 7% Tagalog/Filipino 5%
Political lean MEDSL · Clark
- 2024 margin
- Toss-up / Even · D 50.4% · R 47.8% · Other 1.7%
- 2008→2024 swing
- -16.5pp toward R · 2008: 19.1pp · 2024: 2.6pp
- All cycles
- 2024: D+2.6 2020: D+9.3 2016: D+10.7 2012: D+14.5 2008: D+19.1
Not yet ingested
- Civics
- —
Market trends
- HPI YoY
- ▼ -45.80%
- Current HPI
- 257.7992
- Rent YoY
- ▲ 0.26%
- Metro
- Las Vegas-Henderson-Paradise, NV
- State GDP YoY
- ▲ 3.08%
- F500 in state
- 6
Industry mix (Fortune 500 HQ in NV)
| Industry | F500 HQs | Revenue |
|---|---|---|
| Hotels / Casinos | 3 | $36B |
|
||
Price history
-91.7% since first listed12 events — show timeline
- 2026-01-12 Listed $248,000 GLVAR
- 2025-05-08 Listing Removed — GLVAR
- 2025-03-10 Relisted — GLVAR
- 2025-03-05 Contingent — GLVAR
- 2025-01-04 Relisted — GLVAR
- 2024-12-22 Contingent — GLVAR
- 2024-10-26 Listed $265,000 GLVAR
- 2009-09-10 Listing Removed — GLVAR
- 2009-09-10 Sold (MLS) $55,000 GLVAR
- 2009-03-12 Listed $59,000 GLVAR
- 2005-10-20 Sold (Public Records) $17,346,571 Public Records
- 2000-05-25 Sold (Public Records) $3,000,000 Public Records
Property tax history
+0.1%/yrLatest (2025): $769 · +7.6% YoY. Source: county tax records.
Cash-flow waterfall
monthlySold comps — $/sqft
last 12 mo · ≤1 miLoading sold comps…