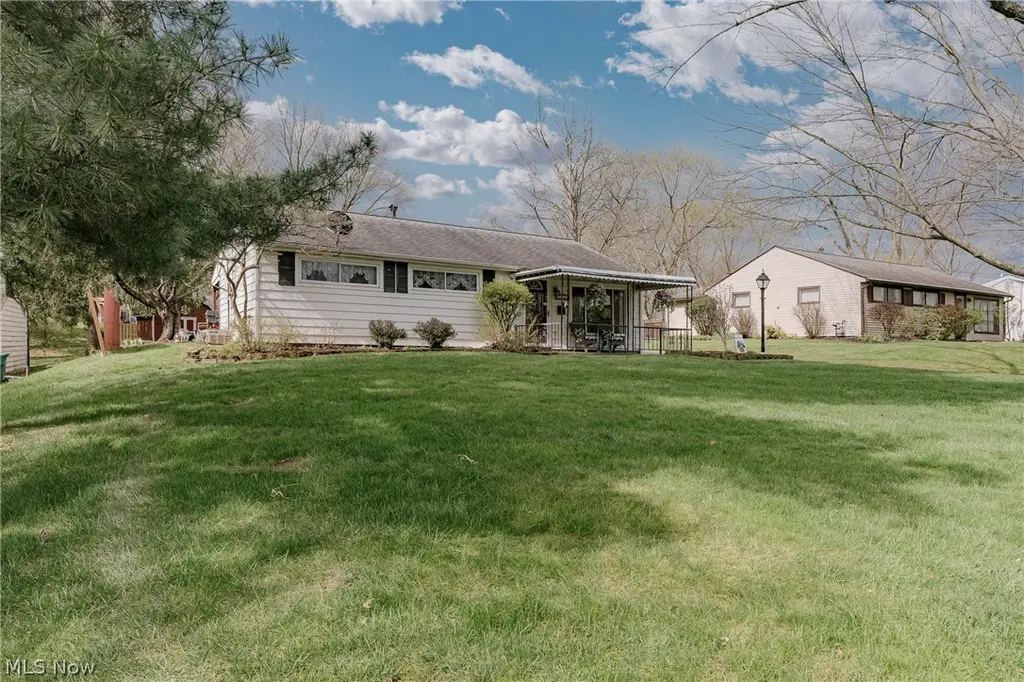
1706 Westwood Dr · Twinsburg, OH
Flood risk 1/10 · Minimal
- FEMA flood zone
- X (unshaded)
- Chance of flooding over 30 yrs
- 0.0%
- Est. flood insurance / yr
- $507 – $1,088
Fire risk 1/10 · Minimal
- Est. fire insurance / yr
- $713 – $1,323
Heat risk 2/10 · Minimal
- Hot days now (above 96°F)
- 7 days/yr
- Hot days in 30 yrs
- 17 days/yr
Wind risk 1/10 · Minimal
- Chance of severe wind over 30 yrs
- —
Air-quality risk 2/10 · Minimal
- Unhealthy air days now
- 1 days/yr
- Unhealthy air days in 30 yrs
- 3 days/yr
Risk factors via First Street. Map © Google.
Why this score? — see what drove the D grade
The composite is a weighted blend of 9 inputs, each scored 0–100. Each bar is that input's sub-score; the figure is the points it added to the 100-point composite (weight × sub-score).
- Cash flow +10.7/30.0
- ARV discount +8.4/15.0
- Schools +6.2/10.0
- Livability +4.0/5.0
- DSCR +3.1/10.0
- 1% rule +2.7/10.0
- Rent growth +2.5/5.0
- Condition / age +2.5/5.0
- Appreciation +0.0/10.0
$249,900
🖨 Deal sheet (PDF) 📄 Offer letter ✓ Due diligence
Listing remarks
Welcome to 1706 Westwood Drive in Twinsburg, a well-kept ranch lovingly maintained by its original owner for nearly 70 years. This home offers timeless charm, pride of ownership, and a functional layout designed for comfortable everyday living. A covered front patio provides a welcoming entry and a perfect place to relax, leading you inside to a spacious living room filled with natural light from large windows that create a bright and inviting atmosphere. The living room flows seamlessly into a sizable dining area, offering an ideal setting for both everyday meals and larger gatherings. The dining space opens directly to the kitchen, enhancing the home’s easy flow. The kitchen feature
Key facts
- Covered front patio
- Sizable dining area
- Quality cabinetry
Tags
Property features AI
Exterior
- Parking: Attached garage (1 car)
- Utilities: Public water; Public sewer
- Home design: Single-story home
- Construction: Aluminum and vinyl siding; Asphalt shingle roof; Built according to public records
- Exterior features: Patio; Lot approximately 0.344 acres
Interior
- Kitchen: Microwave; Range; Refrigerator
- Bedrooms: 4 main-level bedrooms
- Bathrooms: 1 full bathroom on main level
- Heating & cooling: Forced air heating (gas); Central air conditioning
- Interior features: 6 total rooms; Main-level laundry
- Laundry & utility: Laundry on main level
Neighborhood map
What this means for you Summary
Snapshot
- This is a 3-bed/1.0-bath single-family listed at $250k.
Deal economics
- At list price, monthly cash flow is $-120 ($-1k/yr) — negative.
- To cash-flow at today's rent, offer at most $229k (8.5% below list).
- To meet the 1% rule (rent ≥ 1% of price), the offer needs to be $193k (22.6% below list).
- Recommended offer: $193k (22.6% below list) — sets the bar for 1% rule.
- Cap rate 5.7% vs local median 3.7% in Twinsburg — top-decile yield for the area; either an underpriced asset or a hidden risk that comps aren't pricing in. Stress-test before assuming the spread holds.
Location & tenants
- Location reads 81/100 on livability (#95 in OH, #1,475 nationally) — a professional / high-income tenant draw. Strengths: crime A+, employment A+, cost of living A+; Watch: amenities F, commute F.
- Twinsburg City (suburban): math 67% / reading 75% proficiency, ranked #119 of 656 in OH (top 18%) — strong family-tenant draw, lease renewals of 3-5y typical; only 14% free/reduced lunch — higher-income household profile.
- Zoned schools: Wilcox Elementary School (736 students, 18% FRL); Geo G Dodge Elementary School (math 73% / reading 76%, grade A, #88 of 654 statewide, top 14%, 821 students, 20% FRL); Twinsburg High School (math 65% / reading 83%, grade B+, #83 of 781 statewide, top 11%, 1,301 students, 16% FRL) — zoned schools at 18% FRL track the district average.
- Market conditions: 68 active listings in the ZIP; 5 comparable units currently listed for rent nearby; rentals lingering (median 46d on market — plan ~5-8 weeks vacancy on turnover, expect pricing pressure); 60% of comp listings sitting > 30 days — soft ceiling on asking rent; solid renter incomes; 1,114 units permitted in Summit County in 2024 (397 in 5+ unit buildings).
Forward outlook
- Local home prices are declining (-3.0%/yr); year-one equity from $2k of loan paydown is wiped out by about $7k of value loss. Plan a longer hold.
- Summit County population projected to shrink 6% by 2050 — rents likely to lag national; underwrite the cash flow, not the appreciation.
Negotiation context
- Only 5 days on market — expect competitive offers; lowballing is unlikely to land.
Risks & watch-outs
- Watch-outs: built in 1956 — expect roof / HVAC / electrical / plumbing capex.
Questions for the listing agent
- What do current leases actually rent for vs. the listed asking? Can we see a recent rent roll and the last 12 months of T-12 income?
- Built in 1956 — when were the roof, HVAC, electrical panel, plumbing, and water heater last replaced?
- Is there a deadline driving the sale (1031 exchange, divorce, estate, relocation)? That informs how much negotiation room exists.
- Schools are A-rated — typically a magnet for longer-tenancy family renters. What's the average tenant stay here, and is there a school-zone premium baked into asking?
- The area grade is low — what's the realistic commute time and amenity access for the typical tenant pool here? Any planned neighborhood developments (good or bad) we should know about?
- What's the average days-on-market for RENTAL listings here right now (not sales)? A rising rental-DOM trend means longer vacancies and softer asking-rent achievability than the comps imply.
- What's the recent tenant-quality profile in this submarket — average credit score on applications, eviction rate, late-payment / NSF rate, and stable-employment percentage? A property-management company in the area should have these aggregated.
- How much new for-sale + rental construction is in the pipeline within 1–3 miles? Heavy new supply typically softens prices + rents 12–24 months out; constrained supply supports both.
Investment metrics
- 1% rule
- 0.77% ✗
- Cap rate
- 5.71%
- Cash-on-cash
- -2.06%
- DSCR
- 0.91
- GRM
- 10.8
CMA / ARV
- ARV (median comp)
- $254,830
- List price
- $249,900
- Delta
- -1.93%
- Verdict
- FAIR
- Comps
- 20 within 1.0 mi
Show comp detail 12 sales within ~0.75 mi
| Address | Dist | Beds/Ba | Sqft | Sold | Price | $/sf | Match |
|---|---|---|---|---|---|---|---|
| 1706 Westwood Dr | 0.00mi | 4/1.0 (+1) | 1,384 (0%) | 1mo | $256,000 | $185 | 94 |
| 1601 Ridgewood Ct | 0.18mi | 3/1.0 | 1,388 (+0%) | 9mo | $212,500 | $153 | 84 |
| 9878 Ridgewood Dr | 0.09mi | 3/1.0 | 1,328 (-4%) | 12mo | $225,000 | $169 | 79 |
| 9884 Oakwood Dr | 0.28mi | 3/1.0 | 1,352 (-2%) | 10mo | $131,000 | $97 | 75 |
| 1775 Glenwood Dr | 0.18mi | 3/2.0 | 1,501 (+8%) | 3mo | $249,000 | $166 | 71 |
| 1675 Belfair Dr | 0.23mi | 4/2.0 (+1) | 1,360 (-2%) | 14mo | $319,900 | $235 | 66 |
| 1657 Kasserine Ct | 0.38mi | 3/1.5 | 1,334 (-4%) | 11mo | $294,500 | $221 | 65 |
| 1883 Edgewood Dr | 0.38mi | 3/1.0 | 1,268 (-8%) | 7mo | $220,000 | $174 | 62 |
| 10053 Ridgewood Dr | 0.30mi | 3/1.5 | 1,500 (+8%) | 10mo | $290,000 | $193 | 62 |
| 1816 Westwood Dr | 0.22mi | 4/2.0 (+1) | 1,500 (+8%) | 6mo | $295,000 | $197 | 62 |
| 11309 Heritage Dr | 0.69mi | 3/1.5 | 1,300 (-6%) | 11mo | $292,000 | $225 | 46 |
| 1351 Waldo Way | 0.68mi | 3/2.0 | 1,562 (+13%) | 13mo | $347,000 | $222 | 32 |
Match score weights: distance 35% · size 25% · config 20% · recency 20%. Top-matched comps best support the ARV.
Projected returns pro-forma
-3.0% appreciation · 3.0% rent growth · sell at horizon
- IRR
- -19.7%
- Equity multiple
- 0.31×
- Total profit
- $-48,182
- Equity at exit
- $37,261
- IRR
- -12.6%
- Equity multiple
- 0.26×
- Total profit
- $-51,907
- Equity at exit
- $21,607
Cash invested: $69,972 (down + closing). Projections, not guarantees.
Landlord ↔ Tenant lean methodology
- Overall (STATE)
- 73 Landlord-Friendly
- State Ohio
- 73 Landlord-Friendly · R+6
- County
- — inherits STATE
- City
- — inherits STATE
ZIP-level market 44087
- Active inventory
- 68
- Price-to-rent
- 10.8×
Monthly cashflow live
- Estimated rent
- $1,935 high interval (Pro) →
- Mortgage (P&I)
- −$1,311
- Tax from tax record
- −$234 /mo · $2,812/yr
- Insurance
- −$104
- HOA
- −$0
- Lot rent
- −$0
- Vacancy / Maint / Mgmt
- −$406
- Net cashflow
- $-120
Break-even live
Sensitivity live
| Price | -10% $21 | -5% $-50 | +0% $-120 | +5% $-191 | +10% $-262 |
|---|---|---|---|---|---|
| Rent | -10% $-273 | -5% $-197 | +0% $-120 | +5% $-44 | +10% $32 |
| Rate | -1.0pp $5 | -0.5pp $-57 | base $-120 | +0.5pp $-185 | +1.0pp $-251 |
UW: 25.0% down · 7.5% · 30yr · 1.5% tax · 5.0% vac · 8.0% maint · 8.0% mgmt
Financing live
Cash to close
- Down payment
- $62,475
- Closing costs
- $7,497
- Reserves months
- —
- Total cash needed
- —
Loan-product check · same deal, 3 products live
Conventional
25% down · 7.5% · 30yr
- Down + closing
- —
- Monthly P&I
- —
- Monthly cashflow
- —
- DSCR
- —
- Eligible?
- —
Personal DTI + credit; lowest rate.
DSCR
20% down · 8.5% · 30yr
- Down + closing
- —
- Monthly P&I
- —
- Monthly cashflow
- —
- DSCR
- —
- Eligible?
- —
No personal income docs; deal must DSCR.
Hard money
10% down · 12.0% · 12mo
- Down + closing
- —
- Monthly P&I
- —
- Monthly cashflow
- —
- DSCR
- —
- Eligible?
- —
Short-term bridge; refi at stabilization.
Rent comps 5 comps
| Address | Beds | Baths | Sqft | Rent | $/sqft | DOM | Units | Dist |
|---|---|---|---|---|---|---|---|---|
| 1879 Hillsdale Dr Twinsburg, OH | 3.0 | 1.0 | 988 | $1,859 | $1.88 | 4d | 1 | 0.33mi |
| 2487 Warren Pkwy Unit 3 Twinsburg, OH | 3.0 | 1.5 | 1292 | $1,900 | $1.47 | 46d | 1 | 1.41mi |
| 9976 Darrow Rd Apt 6 Twinsburg, OH | 3.0 | 1.5 | 1034 | $1,500 | $1.45 | 46d | 1 | 1.43mi |
| 9976 Darrow Rd Twinsburg, OH | 3.0 | 1.5 | 1050 | $1,400 | $1.33 | 46d | 1 | 1.43mi |
| 9214 Blueberry Ln Macedonia, OH | 3.0 | 1.5 | 1176 | $1,500 | $1.28 | 22d | 1 | 1.45mi |
Listing history 2 events
-
2026-05-04status Pending 1715-char remark
-
2026-04-29$249,900 Active 1715-char remark
ⓘ Source: listings_history table (triggers on properties + properties_extension) + one-shot
backfill from property_details.listing_events for pre-trigger history.
Tax reassessment forecast OH · Partial reset (capped growth)
- Current annual tax
- $2,812 · $234/mo
- Projected year-2 tax
- $3,355 · $280/mo
- Expected delta
- +$543/yr (+$45/mo · 19.3%)
ⓘ Screening estimate from a state-policy table — verify with the county assessor before closing.
Climate risk First Street
- Flood 1/10 Low FEMA zone X (unshaded) · 0% chance over 30 yrs
- Wildfire 1/10 Low
- Heat 2/10 Low 7 d/yr ≥96°F today · 17 d/yr by 30 yrs out
- Wind 1/10 Low
- Air quality 2/10 Low 1 unhealthy d/yr today · 3 by 30 yrs out
Nearby sold comps map
Loading sold comps map…
Walkable amenities ~0.75 mi
Loading nearby amenities…
Taxation est. · year 1
- Rental income
- $23,218
- − Mortgage interest
- −$13,998
- − Property taxes
- −$2,812
- − Insurance
- −$1,250
- − Repairs & maintenance
- −$1,857
- − Management
- −$1,857
- − Depreciation
- −$7,270
- Taxable loss
- −$5,826
- Est. tax savings @ 24.0%
- +$1,398
- After-tax cash flow
- $-47/yr
For passive investors: Depreciation is non-cash, so a rental often shows a tax loss while cash-flowing — sheltering income. Rental losses are passive: they offset passive income freely, and up to $25,000/yr can offset ordinary (W-2) income if you actively participate and your MAGI is under $100k (phasing out to $0 by $150k); unused losses carry forward. On sale, claimed depreciation is recaptured at up to 25%, and gains may owe capital-gains tax (a 1031 exchange can defer both). Figures are a year-1 estimate at your 24.0% rate — not tax advice; consult a CPA.
Schools (NCES district)
- District
- Twinsburg City
- NCES district ID
- 3905007
- Math proficiency
- 67% ▼ -17.00%
- Reading proficiency
- 75% ▼ -8.00%
- Median HH income
- $70,356
- Composite
- 62.11/100
- National rank
- #711
- State rank
- #119 of 656 in OH
Livability — Twinsburg
- Score
- 81/100
- State rank
- #95
- US rank
- #1475
Category grades
Schools grade is shown separately in the Schools card above.
Census & demographics
- Census place
- Twinsburg, OH
- County
- Summit County · 440,783 people
- City population
- 22,185
- Metro
- Akron, OH
- Population (ZIP)
- 22,185
- Household income
- $99,270
- Rent vs Own
- Severe rent burden
- 607.0
Population outlook (Summit County) Hauer SSP2
- Today (2025)
- 546,583 people
- By 2030
- 544,028 · -0.5%
- By 2040
- 531,363 · -2.8%
- By 2050
- 514,923 · -5.8%
- By 2075
- 481,765 · -11.9%
- By 2100
- 432,265 · -20.9%
Race, ethnicity, and origin ACS 2023
- Neighborhood character
- Diverse neighborhood (Simpson 0.55)
- Race & ethnicity
- White 63% Black 20% Asian 9% Two or more races 4% Hispanic / Latino 2%
- Common ancestry
- Romanian 5% Italian 1% Lithuanian 1%
- Foreign-born
- 9% · China, Canada, Vietnam
- Languages at home
- 91% English-only · Other Indo-European 4% Russian/Polish/Slavic 1% Tagalog/Filipino 1%
Political lean MEDSL · Summit
- 2024 margin
- Lean D (+7.0) · D 53.0% · R 46.0%
- 2008→2024 swing
- -9.6pp toward R · 2008: 16.6pp · 2024: 7.0pp
- All cycles
- 2024: D+7.0 2020: D+9.6 2016: D+8.2 2012: D+14.8 2008: D+16.6
Not yet ingested
- Civics
- —
Market trends
- HPI YoY
- ▼ -175.18%
- Current HPI
- 193.7614
- Rent YoY
- —
- Metro
- Akron, OH
- State GDP YoY
- ▲ 1.98%
- F500 in state
- 48
Industry mix (Fortune 500 HQ in OH)
| Industry | F500 HQs | Revenue |
|---|---|---|
| Insurance | 3 | $145B |
|
||
| Industrial Machinery | 3 | $49B |
|
||
| Financial Services | 3 | $24B |
|
||
| Consumer Goods | 2 | $93B |
|
||
| Aerospace / Defense | 2 | $47B |
|
||
| Utilities | 2 | $33B |
|
||
Price history
+2.4% since first listed3 events — show timeline
- 2026-05-29 Sold (MLS) $256,000 MLSNOW
- 2026-05-04 Pending — MLSNOW
- 2026-04-29 Listed $249,900 MLSNOW
Property tax history
+3.7%/yrLatest (2025): $2,812 · -2.4% YoY. Source: county tax records.
Cash-flow waterfall
monthlySold comps — $/sqft
last 12 mo · ≤1 miLoading sold comps…