416 Joan Ave · Girard, OH
Flood risk 1/10 · Minimal
- FEMA flood zone
- X (unshaded)
- Chance of flooding over 30 yrs
- 0.0%
- Est. flood insurance / yr
- $473 – $860
Fire risk 1/10 · Minimal
- Est. fire insurance / yr
- $713 – $1,323
Heat risk 3/10 · Minor
- Hot days now (above 98°F)
- 7 days/yr
- Hot days in 30 yrs
- 17 days/yr
Wind risk 1/10 · Minimal
- Chance of severe wind over 30 yrs
- —
Air-quality risk 3/10 · Minor
- Unhealthy air days now
- 1 days/yr
- Unhealthy air days in 30 yrs
- 4 days/yr
Risk factors via First Street. Map © Google.
Why this score? — see what drove the B grade
The composite is a weighted blend of 9 inputs, each scored 0–100. Each bar is that input's sub-score; the figure is the points it added to the 100-point composite (weight × sub-score).
- Cash flow +29.1/30.0
- ARV discount +15.0/15.0
- DSCR +10.0/10.0
- 1% rule +7.4/10.0
- Schools +4.1/10.0
- Livability +3.4/5.0
- Rent growth +2.5/5.0
- Condition / age +2.5/5.0
- Appreciation +0.0/10.0
$109,900
🖨 Deal sheet (PDF) 📄 Offer letter ✓ Due diligence
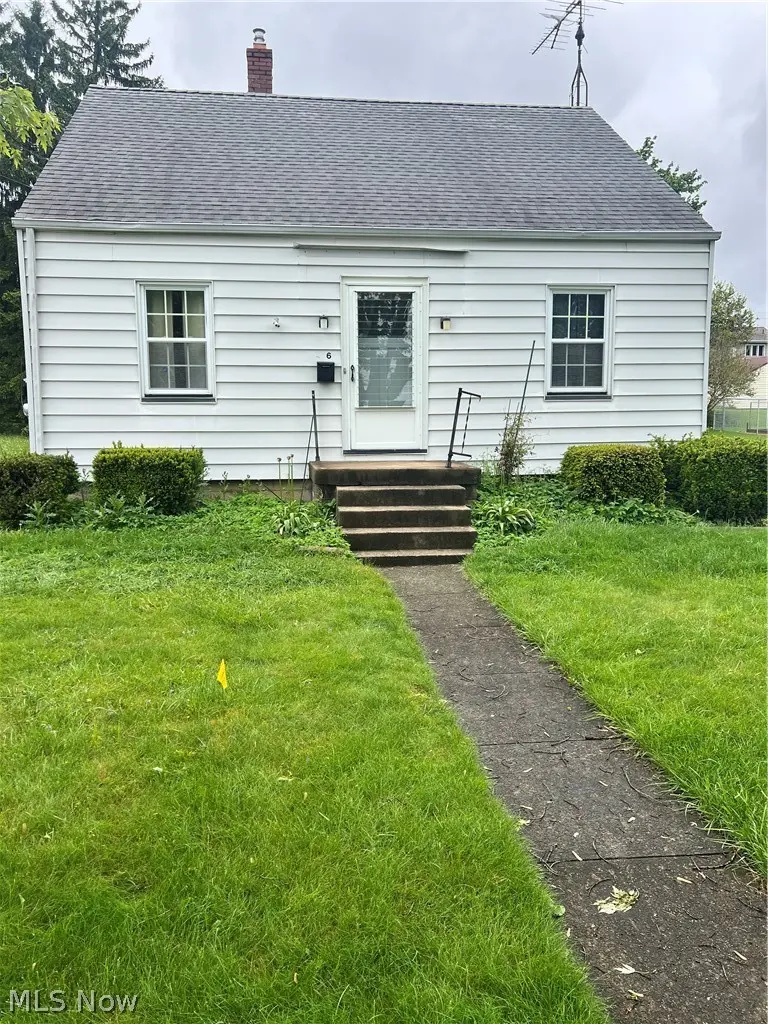
Listing remarks
Darling cape cod in heart of Girard. Two bedrooms on the first floor, huge bedroom on second floor. Replacement thermapane windows. Nice back yard with detached garage. Great proximity to downtown area, Liberty Park, etc. Newer water tank in 2019.
Key facts
- Liberty park
- Back yard
- Newer water tank
Tags
Neighborhood map
What this means for you Summary
Snapshot
- This is a 3-bed/1.0-bath single-family listed at $110k.
Deal economics
- At list price, monthly cash flow is $379 ($5k/yr) — positive.
- The deal already cash-flows at list — no discount required.
- Meets the 1% rule at list price ($1k rent vs $110k).
- Recommended offer: $107k (3.0% below list) — sets the bar for market timing.
- Cap rate 10.4% vs local median 7.0% in Girard — top-decile yield for the area; either an underpriced asset or a hidden risk that comps aren't pricing in. Stress-test before assuming the spread holds.
Location & tenants
- Location reads 67/100 on livability (#605 in OH) — a middle-class / working-renter tenant base. Strengths: cost of living A+, housing A+, crime B; Watch: employment D+, amenities F, commute F.
- Girard City School District (suburban): math 38% / reading 61% proficiency, ranked #458 of 656 in OH (top 70%) — families likely to look elsewhere, expect single-tenant / working-renter base with shorter leases.
- Zoned schools: Prospect Elementary School (math 52% / reading 57%, grade C, #788 of 1,584 statewide, top 52%, 480 students, 99% FRL); Girard Intermediate Middle School (math 36% / reading 53%, grade D, #477 of 654 statewide, top 74%, 363 students, 0% FRL); Girard Sr High School (math 27% / reading 72%, grade D, #390 of 781 statewide, top 54%, 493 students, 83% FRL) — zoned schools at 61% FRL track the district average.
- Market conditions: 59 active listings in the ZIP; 12 comparable units currently listed for rent nearby; rentals at typical pace (median 15d on market — plan ~3-4 weeks tenant-placement turnaround); 129 units permitted in Trumbull County in 2024 (0 in 5+ unit buildings).
Forward outlook
- Local home prices are declining (-3.0%/yr); year-one equity from $760 of loan paydown is wiped out by about $3k of value loss. Plan a longer hold.
- Trumbull County population projected at -22% by 2050 — secular population decline; favor cash flow + early exit over multi-decade hold.
- At projected returns (-3.0% appreciation + 3.0% rent growth), your $31k cash investment doubles in ~8 years — after that, you're playing with house money.
Negotiation context
- It's been on market 40 days — a 3% lower offer ($107k) is reasonable based on typical stale-listing flexibility.
- 2 sale attempts with the ask held roughly flat each time — persistent listings suggest the price (not the market) is what's stuck; bring a comps-based counter.
Risks & watch-outs
- Watch-outs: built in 1947 — expect roof / HVAC / electrical / plumbing capex.
Questions for the listing agent
- It's been on market 40 days. Have you received any prior offers? Is the seller open to a 3% concession, seller financing, or rate buy-down credit?
- Built in 1947 — when were the roof, HVAC, electrical panel, plumbing, and water heater last replaced?
- Is there a deadline driving the sale (1031 exchange, divorce, estate, relocation)? That informs how much negotiation room exists.
- Schools are A-rated — typically a magnet for longer-tenancy family renters. What's the average tenant stay here, and is there a school-zone premium baked into asking?
- What's the average days-on-market for RENTAL listings here right now (not sales)? A rising rental-DOM trend means longer vacancies and softer asking-rent achievability than the comps imply.
- What's the recent tenant-quality profile in this submarket — average credit score on applications, eviction rate, late-payment / NSF rate, and stable-employment percentage? A property-management company in the area should have these aggregated.
- How much new for-sale + rental construction is in the pipeline within 1–3 miles? Heavy new supply typically softens prices + rents 12–24 months out; constrained supply supports both.
Investment metrics
- 1% rule
- 1.24% ✓
- Cap rate
- 10.44%
- Cash-on-cash
- 14.80%
- DSCR
- 1.66
- GRM
- 6.7
CMA / ARV
- ARV (median comp)
- $137,057
- List price
- $109,900
- Delta
- -19.81%
- Verdict
- UNDERPRICED
- Comps
- 20 within 1.0 mi
Show comp detail 12 sales within ~0.75 mi
| Address | Dist | Beds/Ba | Sqft | Sold | Price | $/sf | Match |
|---|---|---|---|---|---|---|---|
| 416 Joan Ave | 0.00mi | 3/2.0 | 1,221 (0%) | 0mo | $110,000 | $90 | 96 |
| 500 Forsythe Ave | 0.29mi | 3/1.0 | 1,152 (-6%) | 0mo | $165,000 | $143 | 77 |
| 233 E Main St | 0.19mi | 3/1.5 | 1,122 (-8%) | 1mo | $115,000 | $102 | 75 |
| 403 N Saint Clair St | 0.30mi | 3/2.0 | 1,256 (+3%) | 6mo | $70,000 | $56 | 72 |
| 619 N Ward Ave | 0.41mi | 3/1.5 | 1,182 (-3%) | 7mo | $137,750 | $117 | 68 |
| 566 E Kline St | 0.12mi | 3/2.0 | 1,359 (+11%) | 8mo | $175,000 | $129 | 65 |
| 294 Louis Ave | 0.56mi | 3/1.0 | 1,141 (-7%) | 6mo | $125,000 | $110 | 58 |
| 103 W Wilson Ave | 0.63mi | 3/2.0 | 1,200 (-2%) | 8mo | $115,000 | $96 | 57 |
| 216 E Prospect St | 0.43mi | 2/1.0 (-1) | 1,316 (+8%) | 6mo | $67,500 | $51 | 57 |
| 349 Forsythe Ave | 0.31mi | 4/2.0 (+1) | 1,404 (+15%) | 0mo | $122,500 | $87 | 51 |
| 847 Shannon Rd | 0.57mi | 3/2.0 | 1,360 (+11%) | 4mo | $216,900 | $159 | 47 |
| 843 Lawrence Ave | 0.65mi | 3/2.0 | 1,098 (-10%) | 7mo | $125,000 | $114 | 43 |
Match score weights: distance 35% · size 25% · config 20% · recency 20%. Top-matched comps best support the ARV.
Projected returns pro-forma
-3.0% appreciation · 3.0% rent growth · sell at horizon
- IRR
- 5.3%
- Equity multiple
- 1.21×
- Total profit
- $6,339
- Equity at exit
- $16,386
- IRR
- 14.7%
- Equity multiple
- 2.19×
- Total profit
- $36,558
- Equity at exit
- $9,502
Cash invested: $30,772 (down + closing). Projections, not guarantees.
Landlord ↔ Tenant lean methodology
- Overall (STATE)
- 73 Landlord-Friendly
- State Ohio
- 73 Landlord-Friendly · R+6
- County
- — inherits STATE
- City
- — inherits STATE
ZIP-level market 44420
- Home prices YoY
- -16.8%
- Active inventory
- 59
- Price-to-rent
- 6.7×
Monthly cashflow live
- Estimated rent
- $1,358 high interval (Pro) →
- Mortgage (P&I)
- −$576
- Tax from tax record
- −$71 /mo · $858/yr
- Insurance
- −$46
- HOA
- −$0
- Vacancy / Maint / Mgmt
- −$285
- Net cashflow
- $379
Break-even live
Sensitivity live
| Price | -10% $442 | -5% $411 | +0% $379 | +5% $348 | +10% $317 |
|---|---|---|---|---|---|
| Rent | -10% $272 | -5% $326 | +0% $379 | +5% $433 | +10% $487 |
| Rate | -1.0pp $435 | -0.5pp $407 | base $379 | +0.5pp $351 | +1.0pp $322 |
UW: 25.0% down · 7.5% · 30yr · 1.5% tax · 5.0% vac · 8.0% maint · 8.0% mgmt
Financing live
Cash to close
- Down payment
- $27,475
- Closing costs
- $3,297
- Reserves months
- —
- Total cash needed
- —
Loan-product check · same deal, 3 products live
Conventional
25% down · 7.5% · 30yr
- Down + closing
- —
- Monthly P&I
- —
- Monthly cashflow
- —
- DSCR
- —
- Eligible?
- —
Personal DTI + credit; lowest rate.
DSCR
20% down · 8.5% · 30yr
- Down + closing
- —
- Monthly P&I
- —
- Monthly cashflow
- —
- DSCR
- —
- Eligible?
- —
No personal income docs; deal must DSCR.
Hard money
10% down · 12.0% · 12mo
- Down + closing
- —
- Monthly P&I
- —
- Monthly cashflow
- —
- DSCR
- —
- Eligible?
- —
Short-term bridge; refi at stabilization.
Rent comps 12 comps
| Address | Beds | Baths | Sqft | Rent | $/sqft | DOM | Units | Dist |
|---|---|---|---|---|---|---|---|---|
| 607 E Kline St Unit A Girard, OH | 2.0 | 1.0 | 1432 | $1,250 | $0.87 | 45d | 1 | 0.13mi |
| 296 E Howard St Girard, OH | 3.0 | 2.0 | 1253 | $1,800 | $1.44 | 45d | 1 | 0.25mi |
| 135 E Broadway Ave Girard, OH | 2.0 | 1.0 | 1120 | $995 | $0.89 | 15d | 1 | 0.43mi |
| 711 N Highland Ave Unit 711-01 Girard, OH | 2.0 | 1.0 | 780 | $795 | $1.02 | 15d | 1 | 0.44mi |
| 625 Churchill Rd Girard, OH | 3.0 | 1.0 | 1200 | $1,450 | $1.21 | 15d | 1 | 0.49mi |
| 820 Lincoln Ave Girard, OH | 2.0 | 1.0 | 768 | $1,200 | $1.56 | 45d | 1 | 0.59mi |
| 103 Hazel St Girard, OH | 2.0 | 1.5 | 1152 | $1,100 | $0.95 | 15d | 1 | 0.62mi |
| 833 Lawrence Ave Girard, OH | 4.0 | 1.0 | 1312 | $1,450 | $1.11 | 15d | 1 | 0.65mi |
| 848 Lawrence Ave Girard, OH | 3.0 | 1.0 | 950 | $1,400 | $1.47 | 15d | 1 | 0.69mi |
| 1079 North Ave Girard, OH | 3.0 | 2.0 | 1462 | $1,600 | $1.09 | 15d | 1 | 0.96mi |
| 817 Taylor Ave Girard, OH | 2.0 | 1.0 | 780 | $1,250 | $1.60 | 22d | 1 | 1.10mi |
| 1046 Leslie Ln Girard, OH | 3.0 | 1.5 | 936 | $1,400 | $1.50 | 22d | 1 | 1.17mi |
Listing history 12 events
-
2026-06-13statusdays on market $109,900 Pending 40 DOM
-
2026-06-10days on market $109,900 Contingent 39 DOM
-
2026-06-09days on market $109,900 Contingent 38 DOM
-
2026-06-08days on market $109,900 Contingent 37 DOM
-
2026-06-07days on market $109,900 Contingent 36 DOM
-
2026-06-03days on market $109,900 Contingent 32 DOM
-
2026-06-02days on market $109,900 Contingent 31 DOM
-
2026-06-01days on market $109,900 Contingent 30 DOM
-
2026-05-31days on market $109,900 Contingent 29 DOM
-
2026-05-30days on market $109,900 Contingent 28 DOM
-
2026-05-08historical Contingent 247-char remark
-
2026-05-01$109,900 Active 247-char remark
ⓘ Source: listings_history table (triggers on properties + properties_extension) + one-shot
backfill from property_details.listing_events for pre-trigger history.
Tax reassessment forecast OH · Partial reset (capped growth)
- Current annual tax
- $858 · $71/mo
- Projected year-2 tax
- $1,286 · $107/mo
- Expected delta
- +$428/yr (+$36/mo · 49.9%)
ⓘ Screening estimate from a state-policy table — verify with the county assessor before closing.
Climate risk First Street
- Flood 1/10 Low FEMA zone X (unshaded) · 0% chance over 30 yrs
- Wildfire 1/10 Low
- Heat 3/10 Moderate 7 d/yr ≥98°F today · 17 d/yr by 30 yrs out
- Wind 1/10 Low
- Air quality 3/10 Moderate 1 unhealthy d/yr today · 4 by 30 yrs out
Nearby sold comps map
Loading sold comps map…
Walkable amenities ~0.75 mi
Loading nearby amenities…
Taxation est. · year 1
- Rental income
- $16,300
- − Mortgage interest
- −$6,156
- − Property taxes
- −$858
- − Insurance
- −$550
- − Repairs & maintenance
- −$1,304
- − Management
- −$1,304
- − Depreciation
- −$3,197
- Taxable income
- $2,931
- Est. tax owed @ 24.0%
- −$703
- After-tax cash flow
- $3,850/yr
For passive investors: Depreciation is non-cash, so a rental often shows a tax loss while cash-flowing — sheltering income. Rental losses are passive: they offset passive income freely, and up to $25,000/yr can offset ordinary (W-2) income if you actively participate and your MAGI is under $100k (phasing out to $0 by $150k); unused losses carry forward. On sale, claimed depreciation is recaptured at up to 25%, and gains may owe capital-gains tax (a 1031 exchange can defer both). Figures are a year-1 estimate at your 24.0% rate — not tax advice; consult a CPA.
Schools (NCES district)
- District
- Girard City School District
- NCES district ID
- 3904406
- Math proficiency
- 38% ▼ -43.00%
- Reading proficiency
- 61% ▼ -18.00%
- Median HH income
- $40,293
- Composite
- 41.35/100
- National rank
- #3496
- State rank
- #458 of 656 in OH
Livability — Girard
- Score
- 67/100
- State rank
- #605
- US rank
- #10378
Category grades
Schools grade is shown separately in the Schools card above.
Census & demographics
- Census place
- Girard, OH
- County
- Trumbull County · 61,158 people
- City population
- 15,293
- Metro
- Youngstown-Warren-Boardman, OH-PA
- Population (ZIP)
- 15,293
- Household income
- $61,707
- Rent vs Own
- Severe rent burden
- 351.0
Population outlook (Trumbull County) Hauer SSP2
- Today (2025)
- 191,696 people
- By 2030
- 184,015 · -4.0%
- By 2040
- 166,810 · -13.0%
- By 2050
- 149,857 · -21.8%
- By 2075
- 115,769 · -39.6%
- By 2100
- 83,617 · -56.4%
Race, ethnicity, and origin ACS 2023
- Neighborhood character
- Predominantly White (89%)
- Race & ethnicity
- White 89% Two or more races 6% Hispanic / Latino 3% Black 3%
- Common ancestry
- Romanian 2% Subsaharan African 2% Slovak 1%
- Foreign-born
- 1%
- Languages at home
- 98% English-only · Spanish 1% Other Indo-European 1%
Political lean MEDSL · Trumbull
- 2024 margin
- R (+16.8) · D 41.2% · R 58.0%
- 2008→2024 swing
- -39.2pp toward R · 2008: 22.4pp · 2024: -16.8pp
- All cycles
- 2024: R+16.8 2020: R+10.6 2016: R+6.4 2012: D+22.2 2008: D+22.4
Not yet ingested
- Civics
- —
Market trends
- HPI YoY
- ▼ -44.72%
- Current HPI
- 221.5618
- Rent YoY
- —
- Metro
- Youngstown-Warren-Boardman, OH-PA
- State GDP YoY
- ▲ 1.98%
- F500 in state
- 48
Industry mix (Fortune 500 HQ in OH)
| Industry | F500 HQs | Revenue |
|---|---|---|
| Insurance | 3 | $145B |
|
||
| Industrial Machinery | 3 | $49B |
|
||
| Financial Services | 3 | $24B |
|
||
| Consumer Goods | 2 | $93B |
|
||
| Aerospace / Defense | 2 | $47B |
|
||
| Utilities | 2 | $33B |
|
||
Price history
+0.1% since first listed6 events — show timeline
- 2026-06-11 Pending — MLSNOW
- 2026-06-10 Sold (MLS) $110,000 MLSNOW
- 2026-05-25 Contingent — MLSNOW
- 2026-05-24 Relisted — MLSNOW
- 2026-05-08 Contingent — MLSNOW
- 2026-05-01 Listed $109,900 MLSNOW
Property tax history
+4.0%/yrLatest (2025): $858 · -3.1% YoY. Source: county tax records.
Cash-flow waterfall
monthlySold comps — $/sqft
last 12 mo · ≤1 miLoading sold comps…