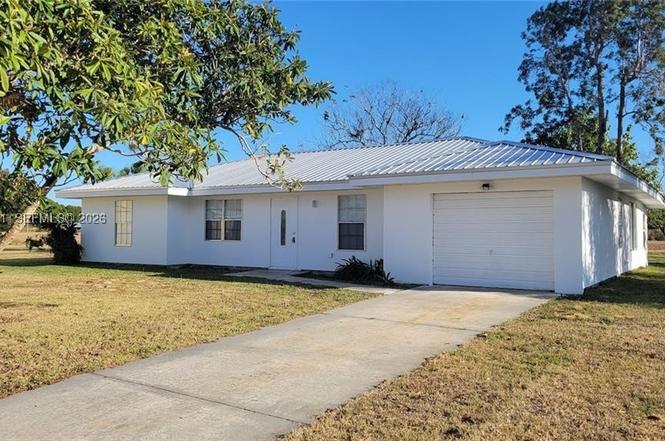
4008 Rye Ct · Port LaBelle, FL
Flood risk 1/10 · Minimal
- FEMA flood zone
- X (unshaded)
- Chance of flooding over 30 yrs
- 0.0%
- Est. flood insurance / yr
- $507 – $1,088
Fire risk 4/10 · Minor
- Est. fire insurance / yr
- $947 – $1,759
Heat risk 9/10 · Severe
- Hot days now (above 108°F)
- 7 days/yr
- Hot days in 30 yrs
- 25 days/yr
Wind risk 10/10 · Severe
- Chance of severe wind over 30 yrs
- 99.0%
Air-quality risk 2/10 · Minimal
- Unhealthy air days now
- 2 days/yr
- Unhealthy air days in 30 yrs
- 2 days/yr
Risk factors via First Street. Map © Google.
Why this score? — see what drove the D+ grade
The composite is a weighted blend of 9 inputs, each scored 0–100. Each bar is that input's sub-score; the figure is the points it added to the 100-point composite (weight × sub-score).
- Cash flow +13.0/30.0
- Appreciation +10.0/10.0
- ARV discount +8.2/15.0
- DSCR +3.9/10.0
- 1% rule +3.6/10.0
- Schools +3.1/10.0
- Livability +3.1/5.0
- Rent growth +2.5/5.0
- Condition / age +2.5/5.0
$239,000
🖨 Deal sheet 📄 Offer letter ✓ Due diligence
Listing remarks MLS
Completely renovated and move-in ready, this home sits on an oversized cul-de-sac lot and offers modern upgrades throughout. Highlights include a brand-new metal roof, all-new flooring, fully updated bathrooms and kitchen, new fixtures, and fresh interior and exterior paint. The spacious living and dining area flows into a large kitchen and separate den, providing ample space for a growing family or visiting guests. Enjoy the convenience of walking to the community pool and park, all within an established, walkable neighborhood with underground utilities.
Key facts
- All-new flooring
- New fixtures
- Brand-new metal roof
Tags
Property features AI
Finance
- HOA & community: Homeowners association with an annual fee of $180; Community pool
Exterior
- Parking: Attached garage; Driveway; 1 covered/garage space
- Utilities: Public water; Public sewer; Underground utilities
- Home design: Single-story home; Faces northwest; Resale property
- Construction: Frame construction; Metal roof
- Exterior features: Room for pool; Community pool
Interior
- Kitchen: Electric range; Refrigerator
- Bedrooms: Bedroom on main level; Bedroom 2 (approx. 11 x 11); Bedroom 3 (approx. 11 x 22); Additional room (approx. 11 x 16)
- Flooring: Vinyl flooring
- Bathrooms: 2 full bathrooms
- Heating & cooling: Electric heating; Central air conditioning
- Interior features: Built-in features; Family/Dining room; First floor entry; Walk-in closet(s)
Neighborhood map
What this means for you Summary
Snapshot
- This is a 2-bed/2.0-bath single-family listed at $239k.
Deal economics
- At list price, monthly cash flow is $-15 ($-180/yr) — negative.
- To cash-flow at today's rent, offer at most $236k (1.1% below list).
- To meet the 1% rule (rent ≥ 1% of price), the offer needs to be $206k (13.6% below list).
- Recommended offer: $206k (13.6% below list) — sets the bar for 1% rule.
- Cap rate 6.2% vs local median 5.1% in Port LaBelle — meaningfully above typical; check what's discounted (condition, days-on-market, listing class) to confirm the premium yield is real.
Location & tenants
- Location reads 62/100 on livability (#750 in FL) — a middle-class / working-renter tenant base. Strengths: cost of living A+, housing A+; Watch: schools F, amenities F, commute F.
- Hendry (town): math 35% / reading 40% proficiency, ranked #65 of 73 in FL (top 89%) — families likely to look elsewhere, expect single-tenant / working-renter base with shorter leases; 75% free/reduced lunch — lower-income household profile, screen leases tightly.
- Market conditions: 942 active listings in the ZIP; 7 comparable units currently listed for rent nearby; rentals at typical pace (median 16d on market — plan ~3-4 weeks tenant-placement turnaround); 557 units permitted in Hendry County in 2024 (45 in 5+ unit buildings).
- This rent runs 43% of the median local income ($57k/yr) — at the standard rent-burdened threshold; future hikes will face affordability resistance.
Forward outlook
- In year one you build about $26k of equity ($2k loan paydown + $24k appreciation (10.0% local appreciation)).
- Hendry County population projected to shrink 7% by 2050 — rents likely to lag national; underwrite the cash flow, not the appreciation.
- At projected returns (10.0% appreciation + 3.0% rent growth), your $67k cash investment doubles in ~3 years — after that, you're playing with house money.
- By year 2, paydown + projected appreciation supports a ~$41k cash-out refi (75% LTV) — recoverable capital for the next deal without selling this one.
Negotiation context
- It's been on market 143 days — a 12% lower offer ($210k) is reasonable based on typical stale-listing flexibility.
- 2 sale attempts with the ask held roughly flat each time — persistent listings suggest the price (not the market) is what's stuck; bring a comps-based counter.
- Current owner paid $48k; list at $239k implies a 398% gain — meaningful room to come down on a strong offer.
Risks & watch-outs
- Climate carrying-cost: severe wind risk, 99% chance of damaging wind over 30y; extreme-heat days projected 7→25/yr by 2055 (HVAC capex compounding) — expect insurance premiums to compound above CPI over the hold.
Questions for the listing agent
- What do current leases actually rent for vs. the listed asking? Can we see a recent rent roll and the last 12 months of T-12 income?
- It's been on market 143 days. Have you received any prior offers? Is the seller open to a 14% concession, seller financing, or rate buy-down credit?
- Built in 1978 — when were the roof, HVAC, electrical panel, plumbing, and water heater last replaced?
- What does the HOA fee cover, when was the last increase, and are there any pending special assessments or reserve-fund shortfalls?
- Why hasn't it sold? Are there any deal-killer items the seller is aware of (foundation, flood, title, zoning, code violations)?
- Is there a deadline driving the sale (1031 exchange, divorce, estate, relocation)? That informs how much negotiation room exists.
- Schools are F-rated, which usually means shorter tenancies and higher turnover. Who's the typical renter profile here, and what's been the actual vacancy rate?
- The area grade is low — what's the realistic commute time and amenity access for the typical tenant pool here? Any planned neighborhood developments (good or bad) we should know about?
- What's the average days-on-market for RENTAL listings here right now (not sales)? A rising rental-DOM trend means longer vacancies and softer asking-rent achievability than the comps imply.
- What's the recent tenant-quality profile in this submarket — average credit score on applications, eviction rate, late-payment / NSF rate, and stable-employment percentage? A property-management company in the area should have these aggregated.
- How much new for-sale + rental construction is in the pipeline within 1–3 miles? Heavy new supply typically softens prices + rents 12–24 months out; constrained supply supports both.
Investment metrics
- 1% rule
- 0.86% ✗
- Cap rate
- 6.22%
- Cash-on-cash
- -0.27%
- DSCR
- 0.99
- GRM
- 9.6
CMA / ARV
- ARV (on-the-fly)
- $242,970
- Comps found
- 12
Show comp detail 12 sales within ~0.75 mi
| Address | Dist | Beds/Ba | Sqft | Sold | Price | $/sf | Match |
|---|---|---|---|---|---|---|---|
| 4038 Rainbow Cir | 0.17mi | 3/2.0 (+1) | 1,377 (+1%) | 12mo | $225,000 | $163 | 75 |
| 4033 School Cir | 0.21mi | 3/2.0 (+1) | 1,476 (+8%) | 0mo | $262,500 | $178 | 72 |
| 4049 Rainbow Cir | 0.12mi | 2/2.0 | 1,262 (-8%) | 12mo | $230,000 | $182 | 72 |
| 4004 Sena Ln | 0.27mi | 3/2.0 (+1) | 1,296 (-5%) | 11mo | $200,000 | $154 | 65 |
| 4018 Caloosa Loop | 0.57mi | 3/2.0 (+1) | 1,404 (+3%) | 2mo | $214,000 | $152 | 62 |
| 4002 Cascade Ln | 0.63mi | 3/2.0 (+1) | 1,344 (-2%) | 3mo | $280,000 | $208 | 60 |
| 4005 School Cir | 0.13mi | 3/2.0 (+1) | 1,510 (+11%) | 13mo | $228,800 | $152 | 60 |
| 4086 Rainbow Cir | 0.20mi | 3/2.0 (+1) | 1,271 (-7%) | 20mo | $277,500 | $218 | 57 |
| 4013 Albany Rd | 0.36mi | 3/2.0 (+1) | 1,200 (-12%) | 6mo | $207,000 | $173 | 53 |
| 5017 Wild Goose Cir | 0.46mi | 3/2.0 (+1) | 1,547 (+13%) | 2mo | $279,900 | $181 | 50 |
| 5051 Wild Goose Cir | 0.58mi | 3/2.0 (+1) | 1,389 (+2%) | 18mo | $327,000 | $235 | 50 |
| 4002 S Edgewater Cir | 0.69mi | 3/2.0 (+1) | 1,456 (+7%) | 13mo | $217,000 | $149 | 41 |
Match score weights: distance 35% · size 25% · config 20% · recency 20%. Top-matched comps best support the ARV.
Projected returns pro-forma
10.0% appreciation · 3.0% rent growth · sell at horizon
- IRR
- 24.1%
- Equity multiple
- 2.93×
- Total profit
- $129,236
- Equity at exit
- $215,310
- IRR
- 21.4%
- Equity multiple
- 6.70×
- Total profit
- $381,386
- Equity at exit
- $464,324
Cash invested: $66,920 (down + closing). Projections, not guarantees.
Landlord ↔ Tenant lean methodology
- Overall (STATE)
- 87 Strongly Landlord-Friendly
- State Florida
- 87 Strongly Landlord-Friendly · R+3
- County
- — inherits STATE
- City
- — inherits STATE
ZIP-level market 33935
- Home prices YoY
- 16.3%
- Active inventory
- 942
- Price-to-rent
- 9.6×
Monthly cashflow live
- Estimated rent
- $2,064 high interval (Pro) →
- Mortgage (P&I)
- −$1,253
- Tax from tax record
- −$278 /mo · $3,336/yr
- Insurance
- −$100
- HOA
- −$15
- Vacancy / Maint / Mgmt
- −$434
- Net cashflow
- $-15
Break-even live
UW: 25.0% down · 7.5% · 30yr · 1.5% tax · 5.0% vac · 8.0% maint · 8.0% mgmt
Financing live
Cash to close
- Down payment
- $59,750
- Closing costs
- $7,170
- Reserves months
- —
- Total cash needed
- —
Loan-product check · same deal, 3 products live
Conventional
25% down · 7.5% · 30yr
- Down + closing
- —
- Monthly P&I
- —
- Monthly cashflow
- —
- DSCR
- —
- Eligible?
- —
Personal DTI + credit; lowest rate.
DSCR
20% down · 8.5% · 30yr
- Down + closing
- —
- Monthly P&I
- —
- Monthly cashflow
- —
- DSCR
- —
- Eligible?
- —
No personal income docs; deal must DSCR.
Hard money
10% down · 12.0% · 12mo
- Down + closing
- —
- Monthly P&I
- —
- Monthly cashflow
- —
- DSCR
- —
- Eligible?
- —
Short-term bridge; refi at stabilization.
Rent comps 7 comps
| Address | Beds | Baths | Sqft | Rent | $/sqft | DOM | Units | Dist |
|---|---|---|---|---|---|---|---|---|
| 5029 S Rosebud Cir Labelle, FL | 3.0 | 2.0 | 1389 | $1,780 | $1.28 | 23d | 1 | 0.65mi |
| 7016 Palpano Cir Labelle, FL | 3.0 | 2.5 | 1507 | $2,100 | $1.39 | 16d | 1 | 1.13mi |
| 6210 Forest Ct Labelle, FL | 3.0 | 2.5 | 1503 | $2,200 | $1.46 | 23d | 1 | 1.14mi |
| 801 SW Raintree Blvd Labelle, FL | 3.0 | 2.0 | 1285 | $1,700 | $1.32 | 23d | 1 | 1.21mi |
| 5029 W Hummingbird Dr Labelle, FL | 3.0 | 2.0 | 1212 | $2,450 | $2.02 | 3d | 1 | 1.29mi |
| 5012 Gunn Pl Labelle, FL | 3.0 | 2.5 | 1783 | $2,500 | $1.40 | 2d | 1 | 1.32mi |
| 6018 Acorn Cir Labelle, FL | 3.0 | 2.0 | 1408 | $2,200 | $1.56 | 16d | 1 | 1.36mi |
HOA detail
- Monthly dues
- $15 · $180/yr
- Likely covers
- pool
Listing history 22 events
-
2026-06-18days on market $239,000 Active 143 DOM
-
2026-06-17days on market $239,000 Active 142 DOM
-
2026-06-16days on market $239,000 Active 141 DOM
-
2026-06-15days on market $239,000 Active 140 DOM
-
2026-06-13days on market $239,000 Active 138 DOM
-
2026-06-13days on market $239,000 Active 137 DOM
-
2026-06-10days on market $239,000 Active 135 DOM
-
2026-06-09days on market $239,000 Active 134 DOM
-
2026-06-08days on market $239,000 Active 133 DOM
-
2026-06-07days on market $239,000 Active 132 DOM
-
2026-06-03days on market $239,000 Active 128 DOM
-
2026-06-02days on market $239,000 Active 127 DOM
-
2026-06-01days on market $239,000 Active 126 DOM
-
2026-05-31days on market $239,000 Active 125 DOM
-
2026-01-26$249,000 Active
-
2026-01-21$249,000 Active 561-char remark
Show marketing remark (561 chars)
Completely renovated and move-in ready, this home sits on an oversized cul-de-sac lot and offers modern upgrades throughout. Highlights include a brand-new metal roof, all-new flooring, fully updated bathrooms and kitchen, new fixtures, and fresh interior and exterior paint. The spacious living and dining area flows into a large kitchen and separate den, providing ample space for a growing family or visiting guests. Enjoy the convenience of walking to the community pool and park, all within an established, walkable neighborhood with underground utilities.
-
2013-05-30soldstatus $48,000
-
2013-05-28soldstatus $48,000 492-char remark
Show marketing remark (492 chars)
WOW. .. PRICED DRASTICALLY REDUCED ON THIS ADORABLE HOME IN PORT LABELLE . . Not a Foreclosure or a Short Sale just a nice home with lots of shade trees & backs up to a Canal. Home located in a Cul-de-sac in Port LaBelle. The back lanai was enclosed & presently used as a 3rd bedroom. Carpet & tile throughout. Great location close to shopping, schools, Caloosahatchee River, Medical Facilities, Restaurants and access to the community swimming pool & other amenities.
-
2013-05-09price $52,000 492-char remark
Show marketing remark (492 chars)
WOW. .. PRICED DRASTICALLY REDUCED ON THIS ADORABLE HOME IN PORT LABELLE . . Not a Foreclosure or a Short Sale just a nice home with lots of shade trees & backs up to a Canal. Home located in a Cul-de-sac in Port LaBelle. The back lanai was enclosed & presently used as a 3rd bedroom. Carpet & tile throughout. Great location close to shopping, schools, Caloosahatchee River, Medical Facilities, Restaurants and access to the community swimming pool & other amenities.
-
2004-04-13soldstatus $68,000
-
2002-07-09soldstatus $60,000
-
1978-01-01soldstatus $40,300
ⓘ Source: listings_history table (triggers on properties + properties_extension) + one-shot
backfill from property_details.listing_events for pre-trigger history.
Tax reassessment forecast FL · Resets to sale price
- Current annual tax
- $3,336 · $278/mo
- Projected year-2 tax
- $3,336 · $278/mo
- Expected delta
- $0/yr ($0/mo · 0.0%)
ⓘ Screening estimate from a state-policy table — verify with the county assessor before closing.
Climate risk First Street
- Flood 1/10 Low FEMA zone X (unshaded) · 0% chance over 30 yrs
- Wildfire 4/10 Moderate
- Heat 9/10 Extreme 7 d/yr ≥108°F today · 25 d/yr by 30 yrs out
- Wind 10/10 Extreme 99% chance of damaging wind over 30 yrs
- Air quality 2/10 Low 2 unhealthy d/yr today · 2 by 30 yrs out
Nearby sold comps map
Loading sold comps map…
Walkable amenities ~0.75 mi
Loading nearby amenities…
Taxation est. · year 1
- Rental income
- $24,773
- − Mortgage interest
- −$13,388
- − Property taxes
- −$3,336
- − Insurance
- −$1,195
- − Repairs & maintenance
- −$1,982
- − Management
- −$1,982
- − HOA
- −$180
- − Depreciation
- −$6,953
- Taxable loss
- −$4,242
- Est. tax savings @ 24.0%
- +$1,018
- After-tax cash flow
- $838/yr
For passive investors: Depreciation is non-cash, so a rental often shows a tax loss while cash-flowing — sheltering income. Rental losses are passive: they offset passive income freely, and up to $25,000/yr can offset ordinary (W-2) income if you actively participate and your MAGI is under $100k (phasing out to $0 by $150k); unused losses carry forward. On sale, claimed depreciation is recaptured at up to 25%, and gains may owe capital-gains tax (a 1031 exchange can defer both). Figures are a year-1 estimate at your 24.0% rate — not tax advice; consult a CPA.
Schools (NCES district)
- District
- Hendry
- NCES district ID
- 1200780
- Math proficiency
- 35% ▼ -11.00%
- Reading proficiency
- 40% ▼ -4.00%
- Median HH income
- $37,043
- Composite
- 31.16/100
- National rank
- #6054
- State rank
- #65 of 73 in FL
Livability — Port LaBelle
- Score
- 62/100
- State rank
- #750
- US rank
- #16264
Category grades
Schools grade is shown separately in the Schools card above.
Census & demographics
- Census place
- Port LaBelle, FL
- County
- Hendry County · 23,186 people
- Metro
- Clewiston, FL
- Population (ZIP)
- 23,186
- Household income
- $57,009
- Rent vs Own
- Severe rent burden
- 498.0
Population outlook (Hendry County) Hauer SSP2
- Today (2025)
- 38,866 people
- By 2030
- 38,558 · -0.8%
- By 2040
- 37,743 · -2.9%
- By 2050
- 36,117 · -7.1%
- By 2075
- 30,070 · -22.6%
- By 2100
- 21,966 · -43.5%
Race, ethnicity, and origin ACS 2023
- Neighborhood character
- Majority Hispanic (56%)
- Race & ethnicity
- Hispanic / Latino 56% White 39% Two or more races 21% Black 2% Native American 2%
- Hispanic origin (detail)
- Mexican 40% Puerto Rican 3% Cuban 5%
- Common ancestry
- Lithuanian 2% Serbian 2% Slovak 1%
- Foreign-born
- 27% · Canada, Jamaica
- Languages at home
- 50% English-only · Spanish 50%
Political lean MEDSL · Hendry
- 2024 margin
- Solid R (+38.3) · D 30.4% · R 68.7%
- 2008→2024 swing
- -31.1pp toward R · 2008: -7.2pp · 2024: -38.3pp
- All cycles
- 2024: R+38.3 2020: R+23.0 2016: R+14.2 2012: R+5.9 2008: R+7.2
Not yet ingested
- Civics
- —
Market trends
- HPI YoY
- ▲ 75.20%
- Current HPI
- 537.4928
- Rent YoY
- —
- Metro
- Clewiston, FL
- State GDP YoY
- ▲ 3.28%
- F500 in state
- 36
Industry mix (Fortune 500 HQ in FL)
| Industry | F500 HQs | Revenue |
|---|---|---|
| Industrial Technology | 2 | $29B |
|
||
| Insurance | 2 | $17B |
|
||
| Retail | 1 | $60B |
|
||
| Technology Distribution | 1 | $58B |
|
||
| Homebuilding | 1 | $35B |
|
||
| Technology Manufacturing | 1 | $35B |
|
||
Price history
+517.9% since first listed8 events — show timeline
- 2026-01-26 Listed $249,000 MARMLS
- 2026-01-21 Listed $249,000 FORTMLS
- 2013-05-30 Sold (Public Records) $48,000 Public Records
- 2013-05-28 Sold (MLS) $48,000 FORTMLS
- 2013-05-09 Price Changed $52,000 FORTMLS
- 2004-04-13 Sold (Public Records) $68,000 Public Records
- 2002-07-09 Sold (Public Records) $60,000 Public Records
- 1978-01-01 Sold (Public Records) $40,300 Public Records
Property tax history
+9.0%/yrLatest (2025): $3,336 · +11.2% YoY. Source: county tax records.
Cash-flow waterfall
monthlySold comps — $/sqft
last 12 mo · ≤1 miLoading sold comps…