 Multi-family
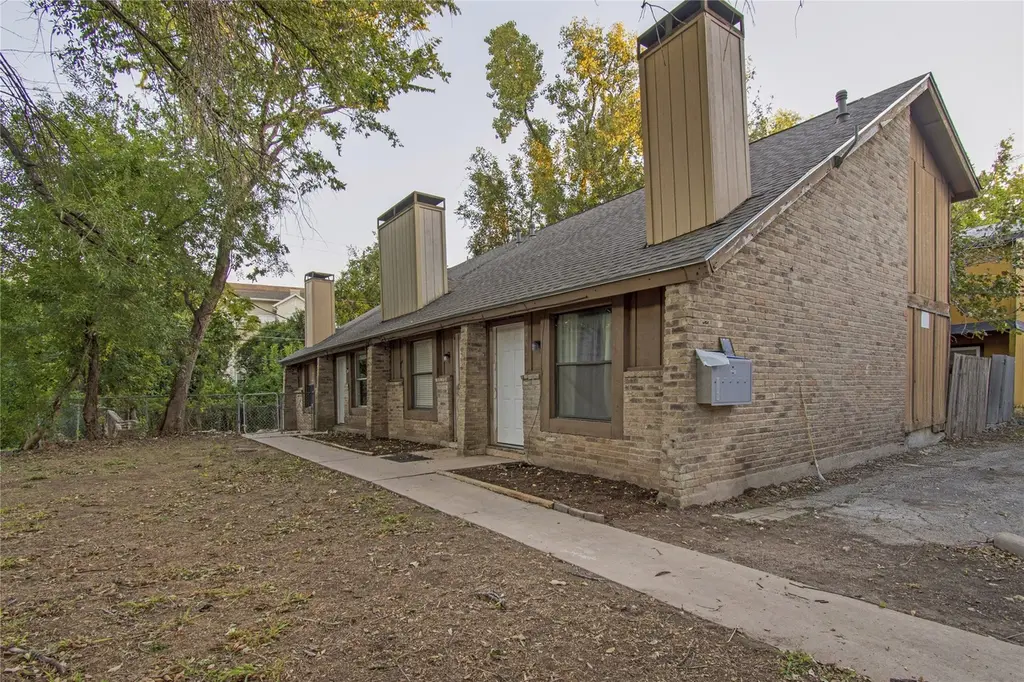
3454 Willowrun Dr · Austin, TX
Flood risk 4/10 · Minor
- FEMA flood zone
- X (unshaded)
- Chance of flooding over 30 yrs
- 0.22%
- Est. flood insurance / yr
- $507 – $1,088
Fire risk 1/10 · Minimal
- Est. fire insurance / yr
- $1,222 – $2,270
Heat risk 8/10 · Major
- Hot days now (above 109°F)
- 7 days/yr
- Hot days in 30 yrs
- 22 days/yr
Wind risk 8/10 · Major
- Chance of severe wind over 30 yrs
- 80.0%
Air-quality risk 2/10 · Minimal
- Unhealthy air days now
- 1 days/yr
- Unhealthy air days in 30 yrs
- 1 days/yr
Risk factors via First Street. Map © Google.
Why this score? — see what drove the D grade
The composite is a weighted blend of 9 inputs, each scored 0–100. Each bar is that input's sub-score; the figure is the points it added to the 100-point composite (weight × sub-score).
- ARV discount +15.0/15.0
- Cash flow +9.1/30.0
- Livability +4.1/5.0
- 1% rule +3.4/10.0
- Schools +3.4/10.0
- DSCR +2.5/10.0
- Condition / age +2.5/5.0
- Rent growth +1.9/5.0
- Appreciation +0.0/10.0
$599,000
🖨 Deal sheet 📄 Offer letter ✓ Due diligence
Multi-family units
County records classify this as Multi-Family (2-4 Unit). Listing-text estimate: 1 unit. estimate disagrees with records
Listing remarks MLS
Well located four-plex in South Austin offering immediate rental income and long-term investment potential. The property features four 1-bedroom, 1-bath units, each approximately 588 square feet, with practical layouts designed for comfortable everyday living. Each unit includes washer and dryer connections, a fireplace, and a private yard space, providing added functionality and outdoor enjoyment rarely found in multifamily properties of this size. The two-story building allows for separation between units while maintaining efficient use of space. Conveniently positioned with quick access to major roadways including I-35 and just minutes from South Austin dining, retail, and entertainment districts. The location provides strong rental demand and easy connectivity to central Austin employment hubs.
Key facts
- Two-story building
- Private yard space
- 9,234 sq ft lot
Tags
Neighborhood map
What this means for you Summary
Snapshot
- This is a 4-bed/4.0-bath multifamily listed at $599k.
Deal economics
- At list price, monthly cash flow is $-462 ($-6k/yr) — negative.
- To cash-flow at today's rent, offer at most $517k (13.6% below list).
- To meet the 1% rule (rent ≥ 1% of price), the offer needs to be $504k (15.9% below list).
- Recommended offer: $504k (15.9% below list) — sets the bar for 1% rule.
- Cap rate 5.4% vs local median 1.8% in Austin — top-decile yield for the area; either an underpriced asset or a hidden risk that comps aren't pricing in. Stress-test before assuming the spread holds.
Location & tenants
- Location reads 82/100 on livability (#16 in TX, #1,208 nationally) — a professional / high-income tenant draw. Strengths: amenities A+, commute A+, employment A+; Watch: cost of living D, crime F.
- Austin ISD (urban): math 33% / reading 44% proficiency, ranked #431 of 826 in TX (top 52%) — families likely to look elsewhere, expect single-tenant / working-renter base with shorter leases.
- Market conditions: Rents soft (-2.4%/yr); 521 active listings in the ZIP; 31 comparable units currently listed for rent nearby; rentals at typical pace (median 24d on market — plan ~3-4 weeks tenant-placement turnaround); solid renter incomes; 17,121 units permitted in Travis County in 2024 (11,963 in 5+ unit buildings).
- At $5,039/mo this rent would consume 57% of the median local household income ($107k/yr) (locally 3283% of renters already pay >50% of income on rent) — very limited rent-growth headroom before tenants either downsize or default.
Forward outlook
- Local home prices are declining (-3.0%/yr); year-one equity from $4k of loan paydown is wiped out by about $18k of value loss. Plan a longer hold.
- Travis County population projected at +60% by 2050 — long-run rental-demand tailwind backs the buy-and-hold thesis.
Negotiation context
- It's been on market 104 days — a 9% lower offer ($545k) is reasonable based on typical stale-listing flexibility.
- 6 sale attempts since 21y ago; this cycle's ask has dropped $99k (14%) from the opening price — seller is motivated, your offer sets the floor, not the list.
- Current owner paid $213k; list at $599k implies a 181% gain — meaningful room to come down on a strong offer.
Risks & watch-outs
- Climate carrying-cost: severe wind risk, 80% chance of damaging wind over 30y; extreme-heat days projected 7→22/yr by 2055 (HVAC capex compounding) — expect insurance premiums to compound above CPI over the hold.
Questions for the listing agent
- What do current leases actually rent for vs. the listed asking? Can we see a recent rent roll and the last 12 months of T-12 income?
- It's been on market 104 days. Have you received any prior offers? Is the seller open to a 16% concession, seller financing, or rate buy-down credit?
- Built in 1973 — when were the roof, HVAC, electrical panel, plumbing, and water heater last replaced?
- Why hasn't it sold? Are there any deal-killer items the seller is aware of (foundation, flood, title, zoning, code violations)?
- Is there a deadline driving the sale (1031 exchange, divorce, estate, relocation)? That informs how much negotiation room exists.
- Crime grade is F in this area — have there been break-ins, vandalism, or insurance claims at this property in the last 3 years? What carrier currently insures it and at what premium?
- The area grade is low — what's the realistic commute time and amenity access for the typical tenant pool here? Any planned neighborhood developments (good or bad) we should know about?
- What's the average days-on-market for RENTAL listings here right now (not sales)? A rising rental-DOM trend means longer vacancies and softer asking-rent achievability than the comps imply.
- What's the recent tenant-quality profile in this submarket — average credit score on applications, eviction rate, late-payment / NSF rate, and stable-employment percentage? A property-management company in the area should have these aggregated.
- How much new apartment / multifamily construction is in the pipeline within 1–3 miles? Heavy new supply (>2% of stock underway) typically softens rents 12–24 months out; light construction supports rent growth.
Investment metrics
- 1% rule
- 0.84% ✗
- Cap rate
- 5.37%
- Cash-on-cash
- -3.31%
- DSCR
- 0.85
- GRM
- 9.9
CMA / ARV
- ARV (median comp)
- $862,345
- List price
- $599,000
- Delta
- -30.54%
- Verdict
- UNDERPRICED
- Comps
- 17 within 1.0 mi
Projected returns pro-forma
-3.0% appreciation · 0.0% rent growth · sell at horizon
- IRR
- -25.5%
- Equity multiple
- 0.16×
- Total profit
- $-140,996
- Equity at exit
- $89,313
- IRR
- -36.5%
- Equity multiple
- -0.29×
- Total profit
- $-216,673
- Equity at exit
- $51,791
Cash invested: $167,720 (down + closing). Projections, not guarantees.
Landlord ↔ Tenant lean methodology
- Overall (STATE)
- 87 Strongly Landlord-Friendly
- State Texas
- 87 Strongly Landlord-Friendly · R+5
- County
- — inherits STATE
- City
- — inherits STATE
ZIP-level market 78704
- Rents YoY
- -2.4%
- Active inventory
- 521
- Price-to-rent
- 39.6×
Monthly cashflow live
- Estimated rent
- $5,039 high interval (Pro) →
- Mortgage (P&I)
- −$3,141
- Tax from tax record
- −$1,052 /mo · $12,624/yr
- Insurance
- −$250
- HOA
- −$0
- Vacancy / Maint / Mgmt
- −$1,058
- Net cashflow
- $-462
Break-even live
4-unit breakdown (identical units grouped — click to expand)
| Units | Beds | Baths | Est. rent |
|---|---|---|---|
| 4× units | 1 | 1 | $5,040 |
| #1 | 1 | 1 | $1,260 |
| #2 | 1 | 1 | $1,260 |
| #3 | 1 | 1 | $1,260 |
| #4 | 1 | 1 | $1,260 |
| Total (4 units) | $5,039 | ||
UW: 25.0% down · 7.5% · 30yr · 1.5% tax · 5.0% vac · 8.0% maint · 8.0% mgmt
Financing live
Cash to close
- Down payment
- $149,750
- Closing costs
- $17,970
- Reserves months
- —
- Total cash needed
- —
Loan-product check · same deal, 3 products live
Conventional
25% down · 7.5% · 30yr
- Down + closing
- —
- Monthly P&I
- —
- Monthly cashflow
- —
- DSCR
- —
- Eligible?
- —
Personal DTI + credit; lowest rate.
DSCR
20% down · 8.5% · 30yr
- Down + closing
- —
- Monthly P&I
- —
- Monthly cashflow
- —
- DSCR
- —
- Eligible?
- —
No personal income docs; deal must DSCR.
Hard money
10% down · 12.0% · 12mo
- Down + closing
- —
- Monthly P&I
- —
- Monthly cashflow
- —
- DSCR
- —
- Eligible?
- —
Short-term bridge; refi at stabilization.
Rent comps 31 comps
| Address | Beds | Baths | Sqft | Rent | $/sqft | DOM | Units | Dist |
|---|---|---|---|---|---|---|---|---|
| 3411 Willow Springs Rd Unit B Austin, TX | 3.0 | 2.5 | 2773 | $3,200 | $1.15 | 44d | 1 | 0.14mi |
| 208 Braeswood Rd Austin, TX | 4.0 | 2.0 | 1735 | $3,500 | $2.02 | 15d | 1 | 0.26mi |
| 127 Frederick St Austin, TX | 3.0 | 2.5 | 2259 | $6,500 | $2.88 | 24d | 1 | 0.56mi |
| 3705 Wilson St Austin, TX | 4.0 | 3.0 | 2212 | $6,250 | $2.83 | 2d | 1 | 0.61mi |
| 2603 Nottingham Ln Austin, TX | 4.0 | 2.0 | 1937 | $5,200 | $2.68 | 12d | 1 | 0.65mi |
| 2503 Wilson St Austin, TX | 4.0 | 2.0 | 1840 | $2,500 | $1.36 | 24d | 1 | 0.97mi |
| 2804 S 1st St #2106 Austin, TX | 3.0 | 3.0 | 1768 | $4,300 | $2.43 | 4d | 1 | 0.97mi |
| 2603 Parker Ln Unit A Austin, TX | 3.0 | 2.0 | 2244 | $1,800 | $0.80 | 24d | 1 | 0.99mi |
| 3602 S 2nd St Austin, TX | 3.0 | 2.5 | 1766 | $4,600 | $2.60 | 24d | 1 | 0.99mi |
| 2624 Metcalfe Rd #8 Austin, TX | 3.0 | 3.5 | 1788 | $3,300 | $1.85 | 24d | 1 | 1.02mi |
| 2624 Metcalfe Rd Austin, TX | 3.0 | 3.5–4.0 | 1786 | $3,100 | $1.74 | 44d | 2 | 1.02mi |
| 3505 Villa Ct #10 Austin, TX | 4.0 | 3.0 | 1719 | $4,250 | $2.47 | 15d | 1 | 1.03mi |
| 903 Cardinal Ln Unit A Austin, TX | 3.0 | 2.5 | 2036 | $4,400 | $2.16 | 24d | 1 | 1.03mi |
| 2212 East Side Dr Austin, TX | 3.0 | 3.0 | 2808 | $7,995 | $2.85 | 44d | 1 | 1.03mi |
| 411 W Saint Elmo Rd #34 Austin, TX | 3.0 | 2.5 | 2053 | $3,050 | $1.49 | 4d | 1 | 1.06mi |
| 2804 Catalina Dr Unit B Austin, TX | 3.0 | 2.0 | 1728 | $1,975 | $1.14 | 18d | 1 | 1.12mi |
| 206 E Live Oak St Unit C Austin, TX | 3.0 | 3.5 | 2236 | $4,700 | $2.10 | 24d | 1 | 1.16mi |
| 3700 Garden Villa Ln #1 Austin, TX | 3.0 | 2.0 | 1681 | $4,000 | $2.38 | 44d | 1 | 1.17mi |
| 3400 Laguna Dr Austin, TX | 5.0 | 2.0 | 1875 | $5,950 | $3.17 | 22d | 1 | 1.18mi |
| 4416 S 1st St #2 Austin, TX | 4.0 | 3.5 | 3000 | $6,750 | $2.25 | 18d | 1 | 1.18mi |
| 2109 Brackenridge St Unit A Austin, TX | 4.0 | 2.0 | 2371 | $7,500 | $3.16 | 4d | 1 | 1.19mi |
| 2107 Brackenridge St Unit B Austin, TX | 3.0 | 3.0 | 2291 | $8,750 | $3.82 | 44d | 1 | 1.21mi |
| 2109 Nickerson St Austin, TX | 3.0 | 3.5 | 2329 | $7,500 | $3.22 | 24d | 1 | 1.22mi |
| 1913 Fairlawn Ln Austin, TX | 4.0 | 4.0 | 2735 | $8,000 | $2.93 | 44d | 1 | 1.29mi |
| 609 Fletcher St Austin, TX | 3.0 | 2.0 | 1608 | $4,500 | $2.80 | 24d | 1 | 1.29mi |
| 502 Terrace Dr Austin, TX | 3.0 | 3.0 | 2606 | $6,500 | $2.49 | 44d | 1 | 1.30mi |
| 3112 Corbin Ln Austin, TX | 3.0 | 3.0 | 1750 | $4,850 | $2.77 | 44d | 1 | 1.35mi |
| 2314 S 5th St Austin, TX | 3.0 | 2.5 | 1757 | $4,200 | $2.39 | 4d | 1 | 1.45mi |
| 1120 Fairmount Ave Unit B Austin, TX | 3.0 | 2.5 | 2026 | $4,795 | $2.37 | 15d | 1 | 1.47mi |
| 1120 Fairmount Ave Austin, TX | 3.0 | 3.0 | 2026 | $4,795 | $2.37 | 12d | 1 | 1.47mi |
| 4904 Creekline Dr Austin, TX | 3.0 | 1.5 | 1715 | $2,975 | $1.73 | 18d | 1 | 1.47mi |
Listing history 32 events
-
2026-06-18days on market $599,000 Active 104 DOM
-
2026-06-17days on market $599,000 Active 103 DOM
-
2026-06-16days on market $599,000 Active 102 DOM
-
2026-06-15days on market $599,000 Active 101 DOM
-
2026-06-13days on market $599,000 Active 99 DOM
-
2026-06-09days on market $599,000 Active 95 DOM
-
2026-06-08days on market $599,000 Active 94 DOM
-
2026-06-08price $599,000 Active 93 DOM
-
2026-06-07days on market $698,000 Active 93 DOM
-
2026-06-05days on market $698,000 Active 90 DOM
-
2026-06-03days on market $698,000 Active 89 DOM
-
2026-06-02days on market $698,000 Active 88 DOM
-
2026-06-01days on market $698,000 Active 87 DOM
-
2026-05-31days on market $698,000 Active 86 DOM
-
2026-03-06$698,000 Active 809-char remark
Show marketing remark (809 chars)
Well located four-plex in South Austin offering immediate rental income and long-term investment potential. The property features four 1-bedroom, 1-bath units, each approximately 588 square feet, with practical layouts designed for comfortable everyday living. Each unit includes washer and dryer connections, a fireplace, and a private yard space, providing added functionality and outdoor enjoyment rarely found in multifamily properties of this size. The two-story building allows for separation between units while maintaining efficient use of space. Conveniently positioned with quick access to major roadways including I-35 and just minutes from South Austin dining, retail, and entertainment districts. The location provides strong rental demand and easy connectivity to central Austin employment hubs.
-
2024-05-29soldstatus
-
2012-04-04historical Withdrawn
-
2012-01-24price
-
2011-08-24Active
-
2010-04-09historical
-
2010-02-10
-
2010-01-01historical
-
2009-10-27
-
2009-10-07historical
-
2009-04-07
-
2005-09-26soldstatus
-
2005-09-20soldstatus $213,000
-
2005-08-22historical
-
2005-07-26$213,000
-
1984-06-21soldstatus
-
1981-10-16soldstatus
-
1980-07-30soldstatus
ⓘ Source: listings_history table (triggers on properties + properties_extension) + one-shot
backfill from property_details.listing_events for pre-trigger history.
Tax reassessment forecast TX · Resets to sale price
- Current annual tax
- $12,624 · $1,052/mo
- Projected year-2 tax
- $12,624 · $1,052/mo
- Expected delta
- $0/yr ($0/mo · 0.0%)
ⓘ Screening estimate from a state-policy table — verify with the county assessor before closing.
Climate risk First Street
- Flood 4/10 Moderate FEMA zone X (unshaded) · 22% chance over 30 yrs
- Wildfire 1/10 Low
- Heat 8/10 Severe 7 d/yr ≥109°F today · 22 d/yr by 30 yrs out
- Wind 8/10 Severe 80% chance of damaging wind over 30 yrs
- Air quality 2/10 Low 1 unhealthy d/yr today · 1 by 30 yrs out
Nearby sold comps map
Loading sold comps map…
Walkable amenities ~0.75 mi
Loading nearby amenities…
Taxation est. · year 1
- Rental income
- $60,468
- − Mortgage interest
- −$33,553
- − Property taxes
- −$12,624
- − Insurance
- −$2,995
- − Repairs & maintenance
- −$4,837
- − Management
- −$4,837
- − Depreciation
- −$17,425
- Taxable loss
- −$15,805
- Est. tax savings @ 24.0%
- +$3,793
- After-tax cash flow
- $-1,751/yr
For passive investors: Depreciation is non-cash, so a rental often shows a tax loss while cash-flowing — sheltering income. Rental losses are passive: they offset passive income freely, and up to $25,000/yr can offset ordinary (W-2) income if you actively participate and your MAGI is under $100k (phasing out to $0 by $150k); unused losses carry forward. On sale, claimed depreciation is recaptured at up to 25%, and gains may owe capital-gains tax (a 1031 exchange can defer both). Figures are a year-1 estimate at your 24.0% rate — not tax advice; consult a CPA.
Schools (NCES district)
- District
- Austin ISD
- NCES district ID
- 4808940
- Math proficiency
- 33% ▼ -19.00%
- Reading proficiency
- 44% ▼ -7.00%
- Median HH income
- $54,627
- Composite
- 33.65/100
- National rank
- #5397
- State rank
- #431 of 826 in TX
Livability — Austin
- Score
- 82/100
- State rank
- #16
- US rank
- #1208
Category grades
Schools grade is shown separately in the Schools card above.
Census & demographics
- Census place
- Austin, TX
- County
- Travis County · 1,299,254 people
- City population
- 1,066,854
- Metro
- Austin-Round Rock-Georgetown, TX
- Population (ZIP)
- 50,688
- Household income
- $106,897
- Rent vs Own
- Severe rent burden
- 3283.0
Population outlook (Travis County) Hauer SSP2
- Today (2025)
- 1,545,133 people
- By 2030
- 1,729,269 · +11.9%
- By 2040
- 2,097,596 · +35.8%
- By 2050
- 2,463,890 · +59.5%
- By 2075
- 3,249,374 · +110.3%
- By 2100
- 3,801,868 · +146.1%
Race, ethnicity, and origin ACS 2023
- Neighborhood character
- Diverse neighborhood (Simpson 0.56)
- Race & ethnicity
- White 62% Hispanic / Latino 24% Two or more races 15% Asian 4% Black 3%
- Hispanic origin (detail)
- Mexican 18%
- Common ancestry
- Lithuanian 4% Romanian 2% Italian 2%
- Foreign-born
- 12% · Canada, China, South Korea
- Languages at home
- 79% English-only · Spanish 16% Other Indo-European 1% German/W. Germanic 1%
Political lean MEDSL · Travis
- 2024 margin
- Solid D (+39.3) · D 68.8% · R 29.4% · Other 1.8%
- 2008→2024 swing
- +9.9pp toward D · 2008: 29.4pp · 2024: 39.3pp
- All cycles
- 2024: D+39.3 2020: D+45.0 2016: D+38.9 2012: D+23.9 2008: D+29.4
Not yet ingested
- Civics
- —
Market trends
- HPI YoY
- ▼ -1348.92%
- Current HPI
- 291.6793
- Rent YoY
- ▼ -2.41%
- Metro
- Austin-Round Rock-Georgetown, TX
- State GDP YoY
- ▲ 3.95%
- F500 in state
- 110
Industry mix (Fortune 500 HQ in TX)
| Industry | F500 HQs | Revenue |
|---|---|---|
| Energy | 16 | $1,198B |
|
||
| Technology | 5 | $198B |
|
||
| Engineering / Construction | 4 | $72B |
|
||
| Energy Services | 3 | $60B |
|
||
| Utilities | 3 | $41B |
|
||
| Healthcare | 2 | $330B |
|
||
Price history
+227.7% since first listed18 events — show timeline
- 2026-03-06 Listed $698,000 Unlock MLS
- 2024-05-29 Sold (Public Records) — Public Records
- 2012-04-04 Delisted — Unlock MLS
- 2012-01-24 Price Changed — Unlock MLS
- 2011-08-24 Listed — Unlock MLS
- 2010-04-09 Delisted — Unlock MLS
- 2010-02-10 Listed — Unlock MLS
- 2010-01-01 Delisted — Unlock MLS
- 2009-10-27 Listed — Unlock MLS
- 2009-10-07 Delisted — Unlock MLS
- 2009-04-07 Listed — Unlock MLS
- 2005-09-26 Sold (MLS) — Unlock MLS
- 2005-09-20 Sold (Public Records) $213,000 Public Records
- 2005-08-22 Delisted — Unlock MLS
- 2005-07-26 Listed $213,000 Unlock MLS
- 1984-06-21 Sold (Public Records) — Public Records
- 1981-10-16 Sold (Public Records) — Public Records
- 1980-07-30 Sold (Public Records) — Public Records
Property tax history
+3.7%/yrLatest (2026): $12,624 · -4.1% YoY. Source: county tax records.
Cash-flow waterfall
monthlySold comps — $/sqft
last 12 mo · ≤1 miLoading sold comps…