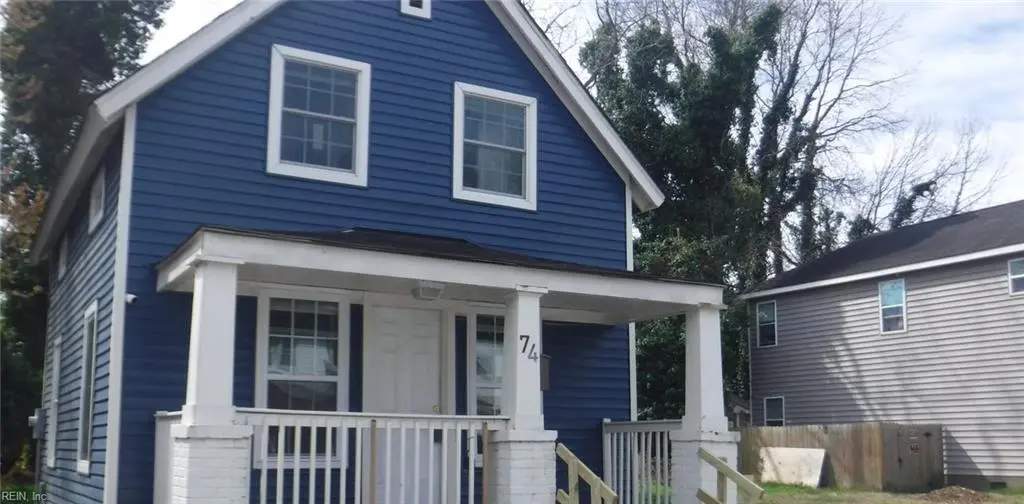
74 Hobson St · Portsmouth, VA
Flood risk 4/10 · Minor
- FEMA flood zone
- X (shaded)
- Chance of flooding over 30 yrs
- 0.13%
- Est. flood insurance / yr
- $507 – $1,088
Fire risk 1/10 · Minimal
- Est. fire insurance / yr
- $666 – $1,236
Heat risk 9/10 · Severe
- Hot days now (above 106°F)
- 7 days/yr
- Hot days in 30 yrs
- 16 days/yr
Wind risk 8/10 · Major
- Chance of severe wind over 30 yrs
- 80.0%
Air-quality risk 5/10 · Moderate
- Unhealthy air days now
- 6 days/yr
- Unhealthy air days in 30 yrs
- 7 days/yr
Risk factors via First Street. Map © Google.
Why this score? — see what drove the C grade
The composite is a weighted blend of 9 inputs, each scored 0–100. Each bar is that input's sub-score; the figure is the points it added to the 100-point composite (weight × sub-score).
- Cash flow +17.9/30.0
- ARV discount +15.0/15.0
- DSCR +5.6/10.0
- 1% rule +4.4/10.0
- Schools +3.9/10.0
- Livability +3.7/5.0
- Rent growth +3.3/5.0
- Condition / age +2.5/5.0
- Appreciation +0.0/10.0
$184,900
🖨 Deal sheet 📄 Offer letter ✓ Due diligence
Listing remarks MLS
PRICE REDUCED! Come see this charming 3 bedroom 2 full bath Colonial waiting for you to move in-located near shopping and main roads. The renovated kitchen with electric range, dishwasher and refrigerator. There is a first floor bedroom and upstairs the primary bedroom is well proportioned-the remaining bedroom is also good sized-bathrooms feature tub/shower combinations. This property is SOLD AS-IS, with no repairs by Seller. This property may qualify for Seller Financing (Vendee). If Property was built prior to 1978, Lead Based Paint Potentially Exists.
Key facts
- Renovated kitchen
- First floor bedroom
- 2,613 sq ft lot
Tags
Neighborhood map
What this means for you Summary
Snapshot
- This is a 3-bed/2.0-bath single-family listed at $185k.
Deal economics
- At list price, monthly cash flow is $154 ($2k/yr) — positive.
- The deal already cash-flows at list — no discount required.
- To meet the 1% rule (rent ≥ 1% of price), the offer needs to be $174k (6.0% below list).
- Recommended offer: $174k (6.0% below list) — sets the bar for market timing.
- Cap rate 7.3% vs local median 4.6% in Portsmouth — top-decile yield for the area; either an underpriced asset or a hidden risk that comps aren't pricing in. Stress-test before assuming the spread holds.
Location & tenants
- Location reads 73/100 on livability (#172 in VA) — a middle-class / working-renter tenant base. Strengths: amenities A+, cost of living A+, housing A+; Watch: employment C-, crime F, commute F.
- Portsmouth City Public School District (urban): math 34% / reading 58% proficiency, ranked #107 of 131 in VA (top 82%) — families likely to look elsewhere, expect single-tenant / working-renter base with shorter leases.
- Market conditions: Rents rising (+3.3%/yr); 131 active listings in the ZIP; 40 comparable units currently listed for rent nearby; rentals at typical pace (median 24d on market — plan ~3-4 weeks tenant-placement turnaround); 300 units permitted in Portsmouth city in 2024 (112 in 5+ unit buildings).
- This rent runs 42% of the median local income ($50k/yr) — at the standard rent-burdened threshold; future hikes will face affordability resistance.
Forward outlook
- Local home prices are declining (-3.0%/yr); year-one equity from $1k of loan paydown is wiped out by about $6k of value loss. Plan a longer hold.
Negotiation context
- It's been on market 79 days — a 6% lower offer ($174k) is reasonable based on typical stale-listing flexibility.
- 5 sale attempts since 5y ago; this cycle's ask has dropped $27k (13%) from the opening price — seller is motivated, your offer sets the floor, not the list.
Risks & watch-outs
- Watch-outs: built in 1919 — expect roof / HVAC / electrical / plumbing capex.
- Climate carrying-cost: severe wind risk, 80% chance of damaging wind over 30y; extreme-heat days projected 7→16/yr by 2055 (HVAC capex compounding) — expect insurance premiums to compound above CPI over the hold.
Questions for the listing agent
- It's been on market 79 days. Have you received any prior offers? Is the seller open to a 6% concession, seller financing, or rate buy-down credit?
- Built in 1919 — when were the roof, HVAC, electrical panel, plumbing, and water heater last replaced?
- Why hasn't it sold? Are there any deal-killer items the seller is aware of (foundation, flood, title, zoning, code violations)?
- Is there a deadline driving the sale (1031 exchange, divorce, estate, relocation)? That informs how much negotiation room exists.
- Schools are B-rated — typically a magnet for longer-tenancy family renters. What's the average tenant stay here, and is there a school-zone premium baked into asking?
- Crime grade is F in this area — have there been break-ins, vandalism, or insurance claims at this property in the last 3 years? What carrier currently insures it and at what premium?
- What's the average days-on-market for RENTAL listings here right now (not sales)? A rising rental-DOM trend means longer vacancies and softer asking-rent achievability than the comps imply.
- What's the recent tenant-quality profile in this submarket — average credit score on applications, eviction rate, late-payment / NSF rate, and stable-employment percentage? A property-management company in the area should have these aggregated.
- How much new for-sale + rental construction is in the pipeline within 1–3 miles? Heavy new supply typically softens prices + rents 12–24 months out; constrained supply supports both.
Investment metrics
- 1% rule
- 0.94% ✗
- Cap rate
- 7.30%
- Cash-on-cash
- 3.58%
- DSCR
- 1.16
- GRM
- 8.9
CMA / ARV
- ARV (median comp)
- $229,270
- List price
- $184,900
- Delta
- -19.35%
- Verdict
- UNDERPRICED
- Comps
- 20 within 1.0 mi
Show comp detail 12 sales within ~0.75 mi
| Address | Dist | Beds/Ba | Sqft | Sold | Price | $/sf | Match |
|---|---|---|---|---|---|---|---|
| 9 Shelby St | 0.35mi | 3/2.0 | 1,028 (+1%) | 2mo | $239,000 | $232 | 81 |
| 312 Killian Ave | 0.29mi | 3/1.0 | 992 (-3%) | 2mo | $255,000 | $257 | 76 |
| 2803 Nashville Ave | 0.57mi | 3/2.0 | 1,050 (+3%) | 3mo | $235,000 | $224 | 66 |
| 117 Edison Ave | 0.47mi | 2/1.0 (-1) | 1,000 (-2%) | 2mo | $227,500 | $228 | 64 |
| 113 Baldwin Ave | 0.41mi | 2/1.5 (-1) | 973 (-5%) | 4mo | $95,000 | $98 | 63 |
| 109 Woodstock St | 0.46mi | 3/1.0 | 960 (-6%) | 3mo | $220,000 | $229 | 62 |
| 4 May St | 0.61mi | 3/1.5 | 1,064 (+4%) | 4mo | $155,000 | $146 | 60 |
| 118 Dekalb Ave | 0.52mi | 2/1.0 (-1) | 1,065 (+4%) | 2mo | $175,500 | $165 | 58 |
| 24 Neville St | 0.46mi | 3/1.0 | 946 (-7%) | 6mo | $238,900 | $253 | 57 |
| 2711 Evergreen Pl | 0.62mi | 3/2.0 | 1,100 (+8%) | 2mo | $278,000 | $253 | 57 |
| 2600 Roanoke Ave | 0.65mi | 3/1.0 | 900 (-12%) | 2mo | $107,000 | $119 | 44 |
| 2713 Roanoke Ave | 0.68mi | 3/1.0 | 1,160 (+14%) | 3mo | $105,000 | $91 | 40 |
Match score weights: distance 35% · size 25% · config 20% · recency 20%. Top-matched comps best support the ARV.
Projected returns pro-forma
-3.0% appreciation · 3.31% rent growth · sell at horizon
- IRR
- -10.3%
- Equity multiple
- 0.62×
- Total profit
- $-19,590
- Equity at exit
- $27,569
- IRR
- -0.6%
- Equity multiple
- 0.96×
- Total profit
- $-2,184
- Equity at exit
- $15,987
Cash invested: $51,772 (down + closing). Projections, not guarantees.
Landlord ↔ Tenant lean methodology
- Overall (STATE)
- 55 Moderately Landlord-Leaning
- State Virginia
- 55 Moderately Landlord-Leaning · D+2
- County
- — inherits STATE
- City
- — inherits STATE
ZIP-level market 23704
- Home prices YoY
- -4.6%
- Rents YoY
- 3.3%
- Active inventory
- 131
- Price-to-rent
- 8.9×
Monthly cashflow live
- Estimated rent
- $1,739 high interval (Pro) →
- Mortgage (P&I)
- −$970
- Tax from tax record
- −$173 /mo · $2,070/yr
- Insurance
- −$77
- HOA
- −$0
- Vacancy / Maint / Mgmt
- −$365
- Net cashflow
- $154
Break-even live
UW: 25.0% down · 7.5% · 30yr · 1.5% tax · 5.0% vac · 8.0% maint · 8.0% mgmt
Financing live
Cash to close
- Down payment
- $46,225
- Closing costs
- $5,547
- Reserves months
- —
- Total cash needed
- —
Loan-product check · same deal, 3 products live
Conventional
25% down · 7.5% · 30yr
- Down + closing
- —
- Monthly P&I
- —
- Monthly cashflow
- —
- DSCR
- —
- Eligible?
- —
Personal DTI + credit; lowest rate.
DSCR
20% down · 8.5% · 30yr
- Down + closing
- —
- Monthly P&I
- —
- Monthly cashflow
- —
- DSCR
- —
- Eligible?
- —
No personal income docs; deal must DSCR.
Hard money
10% down · 12.0% · 12mo
- Down + closing
- —
- Monthly P&I
- —
- Monthly cashflow
- —
- DSCR
- —
- Eligible?
- —
Short-term bridge; refi at stabilization.
Rent comps 40 comps
| Address | Beds | Baths | Sqft | Rent | $/sqft | DOM | Units | Dist |
|---|---|---|---|---|---|---|---|---|
| 3317 Downes St Portsmouth, VA | 3.0 | 2.0 | 1148 | $1,995 | $1.74 | 10d | 1 | 0.06mi |
| 3317 Downes St Portsmouth, VA | 3.0 | 2.0 | 1148 | $1,995 | $1.74 | 3d | 1 | 0.06mi |
| 2715 Portsmouth Blvd Portsmouth, VA | 2.0 | 1.0 | 1428 | $1,425 | $1.00 | 17d | 1 | 0.08mi |
| 2715 Portsmouth Blvd Portsmouth, VA | 2.0 | 1.0 | 1428 | $1,425 | $1.00 | 14d | 1 | 0.08mi |
| 70 Manly St Portsmouth, VA | 2.0 | 1.0 | 1000 | $1,350 | $1.35 | 43d | 1 | 0.12mi |
| 3304 Killian Ave Portsmouth, VA | 3.0 | 1.0 | 800 | $2,000 | $2.50 | 23d | 1 | 0.25mi |
| 213 Beacon Rd Portsmouth, VA | 3.0 | 2.0 | 1280 | $2,300 | $1.80 | 23d | 1 | 0.26mi |
| 1 Shelby St Portsmouth, VA | 2.0 | 1.0 | 700 | $1,250 | $1.79 | 23d | 1 | 0.33mi |
| 49 Carver Cir Portsmouth, VA | 2.0 | 2.0 | 800 | $1,450 | $1.81 | 23d | 1 | 0.46mi |
| 3724 Deep Creek Blvd Unit 3754 Portsmouth, VA | 2.0 | 1.0 | 900 | $995 | $1.11 | 12d | 1 | 0.54mi |
| 3724 Deep Creek Blvd Unit 3728 Portsmouth, VA | 2.0 | 1.0 | 900 | $995 | $1.11 | 23d | 1 | 0.54mi |
| 2304 Nashville Ave Portsmouth, VA | 3.0 | 1.5 | 1226 | $1,395 | $1.14 | 43d | 1 | 0.55mi |
| 21 DeKalb Ave Portsmouth, VA | 2.0 | 1.0 | 984 | $1,550 | $1.58 | 43d | 1 | 0.58mi |
| 231 Edison Ave Unit 231 Portsmouth, VA | 2.0 | 1.5 | 1050 | $1,275 | $1.21 | 10d | 1 | 0.59mi |
| 231 Edison Ave Portsmouth, VA | 2.0 | 1.5 | 1100 | $1,275 | $1.16 | 19d | 1 | 0.59mi |
| 251 Independence St Portsmouth, VA | 3.0 | 2.5 | 1294 | $2,550 | $1.97 | 23d | 1 | 0.63mi |
| 2810 Roanoke Ave Portsmouth, VA | 3.0 | 1.5 | 1100 | $2,100 | $1.91 | 43d | 1 | 0.64mi |
| 2750 Greenwood Dr Portsmouth, VA | 3.0 | 2.0 | 1200 | $1,700 | $1.42 | 23d | 1 | 0.73mi |
| 3401 Brighton St Portsmouth, VA | 3.0 | 2.5 | 1439 | $2,195 | $1.53 | 3d | 1 | 0.83mi |
| 35 Fairview Cir S Portsmouth, VA | 4.0 | 1.5 | 1462 | $2,100 | $1.44 | 12d | 1 | 0.91mi |
| 1915 Des Moines Ave Portsmouth, VA | 3.0 | 1.0 | 1070 | $1,700 | $1.59 | 23d | 1 | 0.93mi |
| 1915 Des Moines Ave Portsmouth, VA | 3.0 | 1.0 | 1070 | $1,700 | $1.59 | 16d | 1 | 0.93mi |
| 1915 Lansing Ave Portsmouth, VA | 3.0 | 1.0 | 1085 | $1,675 | $1.54 | 3d | 1 | 0.97mi |
| 1314 Summit Ave Portsmouth, VA | 3.0 | 1.5 | 1152 | $1,750 | $1.52 | 43d | 1 | 1.01mi |
| 3717 Scott St Portsmouth, VA | 3.0 | 1.0 | 1157 | $1,400 | $1.21 | 23d | 1 | 1.11mi |
| 2111 Atlanta Ave Portsmouth, VA | 3.0 | 2.0 | 1418 | $2,395 | $1.69 | 43d | 1 | 1.12mi |
| 1802 Atlanta Ave Unit 2 Portsmouth, VA | 2.0 | 1.0 | 1200 | $1,500 | $1.25 | 23d | 1 | 1.17mi |
| 3607 Bart St Portsmouth, VA | 3.0 | 2.0 | 1326 | $1,850 | $1.40 | 10d | 1 | 1.19mi |
| 1416 Richmond Ave Portsmouth, VA | 2.0 | 1.0 | 1024 | $1,150 | $1.12 | 43d | 1 | 1.19mi |
| 134 Monmouth St Portsmouth, VA | 3.0 | 2.5 | 1440 | $2,450 | $1.70 | 43d | 1 | 1.22mi |
| 3626 Bart St Unit BAR3626-DF Portsmouth, VA | 2.0 | 1.0 | 900 | $1,000 | $1.11 | 7d | 1 | 1.22mi |
| 2007 Elm Ave Portsmouth, VA | 3.0 | 1.0 | 903 | $1,300 | $1.44 | 20d | 1 | 1.24mi |
| 98 Francis St Portsmouth, VA | 2.0 | 2.0 | 984 | $1,395 | $1.42 | 14d | 1 | 1.30mi |
| 1914 King St Portsmouth, VA | 3.0 | 2.5 | 1332 | $2,200 | $1.65 | 44d | 1 | 1.30mi |
| 102 Francis St #98 Portsmouth, VA | 2.0 | 1.5 | 1000 | $1,395 | $1.40 | 16d | 1 | 1.30mi |
| 2756 Peach St Portsmouth, VA | 2.0 | 1.5 | 1040 | $1,495 | $1.44 | 23d | 1 | 1.31mi |
| 1447 Talley Cir Portsmouth, VA | 3.0 | 2.5 | 1440 | $2,000 | $1.39 | 23d | 1 | 1.37mi |
| 2906 Chestnut St Unit 1328007P Portsmouth, VA | 2.0 | 1.0 | 947 | $4,650 | $4.91 | 7d | 1 | 1.41mi |
| 3310 Glasgow St Portsmouth, VA | 2.0 | 1.0 | 1100 | $1,600 | $1.45 | 3d | 1 | 1.41mi |
| 818 Coolidge St Portsmouth, VA | 2.0 | 1.0 | 1230 | $2,100 | $1.71 | 43d | 1 | 1.45mi |
Listing history 29 events
-
2026-06-18days on market $184,900 Active 79 DOM
-
2026-06-17days on market $184,900 Active 78 DOM
-
2026-06-16pricedays on market $184,900 Active 77 DOM
-
2026-06-15days on market $199,900 Active 76 DOM
-
2026-06-13days on market $199,900 Active 74 DOM
-
2026-06-09days on market $199,900 Active 70 DOM
-
2026-06-08days on market $199,900 Active 69 DOM
-
2026-06-07days on market $199,900 Active 68 DOM
-
2026-06-03days on market $199,900 Active 64 DOM
-
2026-06-02days on market $199,900 Active 63 DOM
-
2026-06-01days on market $199,900 Active 62 DOM
-
2026-05-31days on market $199,900 Active 61 DOM
-
2026-05-12price $199,900 567-char remark
Show marketing remark (567 chars)
PRICE REDUCED! Come see this charming 3 bedroom 2 full bath Colonial waiting for you to move in-located near shopping and main roads. The renovated kitchen with electric range, dishwasher and refrigerator. There is a first floor bedroom and upstairs the primary bedroom is well proportioned-the remaining bedroom is also good sized-bathrooms feature tub/shower combinations. This property is SOLD AS-IS, with no repairs by Seller. This property may qualify for Seller Financing (Vendee). If Property was built prior to 1978, Lead Based Paint Potentially Exists.
-
2026-03-31$211,836 Active 567-char remark
Show marketing remark (567 chars)
PRICE REDUCED! Come see this charming 3 bedroom 2 full bath Colonial waiting for you to move in-located near shopping and main roads. The renovated kitchen with electric range, dishwasher and refrigerator. There is a first floor bedroom and upstairs the primary bedroom is well proportioned-the remaining bedroom is also good sized-bathrooms feature tub/shower combinations. This property is SOLD AS-IS, with no repairs by Seller. This property may qualify for Seller Financing (Vendee). If Property was built prior to 1978, Lead Based Paint Potentially Exists.
-
2025-09-08historical
-
2025-06-22$245,000 Active
-
2022-03-07soldstatus $182,000
-
2022-02-16status Under Contract
-
2022-02-02historical Active Under Contract
-
2022-01-14$182,000 Active
-
2022-01-10historical
-
2022-01-03price $199,900
-
2021-12-16price $209,500
-
2021-11-24$218,500 Active
-
2021-07-22soldstatus $100,000
-
2021-05-24historical Active Under Contract
-
2021-05-22historical
-
2021-05-14$100,000 Active
-
2001-06-08soldstatus $31,390
ⓘ Source: listings_history table (triggers on properties + properties_extension) + one-shot
backfill from property_details.listing_events for pre-trigger history.
Tax reassessment forecast VA · Resets to sale price
- Current annual tax
- $2,070 · $173/mo
- Projected year-2 tax
- $2,070 · $173/mo
- Expected delta
- $0/yr ($0/mo · 0.0%)
ⓘ Screening estimate from a state-policy table — verify with the county assessor before closing.
Climate risk First Street
- Flood 4/10 Moderate FEMA zone X (shaded) · 13% chance over 30 yrs
- Wildfire 1/10 Low
- Heat 9/10 Extreme 7 d/yr ≥106°F today · 16 d/yr by 30 yrs out
- Wind 8/10 Severe 80% chance of damaging wind over 30 yrs
- Air quality 5/10 Major 6 unhealthy d/yr today · 7 by 30 yrs out
Nearby sold comps map
Loading sold comps map…
Walkable amenities ~0.75 mi
Loading nearby amenities…
Taxation est. · year 1
- Rental income
- $20,866
- − Mortgage interest
- −$10,357
- − Property taxes
- −$2,070
- − Insurance
- −$924
- − Repairs & maintenance
- −$1,669
- − Management
- −$1,669
- − Depreciation
- −$5,379
- Taxable loss
- −$1,204
- Est. tax savings @ 24.0%
- +$289
- After-tax cash flow
- $2,142/yr
For passive investors: Depreciation is non-cash, so a rental often shows a tax loss while cash-flowing — sheltering income. Rental losses are passive: they offset passive income freely, and up to $25,000/yr can offset ordinary (W-2) income if you actively participate and your MAGI is under $100k (phasing out to $0 by $150k); unused losses carry forward. On sale, claimed depreciation is recaptured at up to 25%, and gains may owe capital-gains tax (a 1031 exchange can defer both). Figures are a year-1 estimate at your 24.0% rate — not tax advice; consult a CPA.
Schools (NCES district)
- District
- Portsmouth City Public School District
- NCES district ID
- 5103000
- Math proficiency
- 34% ▼ -40.00%
- Reading proficiency
- 58% ▼ -12.00%
- Median HH income
- $46,152
- Composite
- 39.01/100
- National rank
- #4071
- State rank
- #107 of 131 in VA
Livability — Portsmouth
- Score
- 73/100
- State rank
- #172
- US rank
- #5381
Category grades
Schools grade is shown separately in the Schools card above.
Census & demographics
- Census place
- Portsmouth, VA
- County
- Portsmouth City · 96,366 people
- City population
- 96,366
- Metro
- Virginia Beach-Norfolk-Newport News, VA-NC
- Population (ZIP)
- 19,207
- Household income
- $49,583
- Rent vs Own
- Severe rent burden
- 1727.0
Population outlook (Portsmouth County) Hauer SSP2
- Today (2025)
- 96,730 people
- By 2030
- 96,760 · +0.0%
- By 2040
- 96,573 · -0.2%
- By 2050
- 95,606 · -1.2%
- By 2075
- 93,579 · -3.3%
- By 2100
- 83,756 · -13.4%
Race, ethnicity, and origin ACS 2023
- Neighborhood character
- Predominantly Black (66%)
- Race & ethnicity
- Black 66% White 24% Two or more races 6% Hispanic / Latino 4% Asian 2%
- Common ancestry
- Slovak 1% Romanian 1% Lithuanian 1%
- Foreign-born
- 2% · Canada
- Languages at home
- 96% English-only · Spanish 2%
Political lean MEDSL · Portsmouth
- 2024 margin
- Solid D (+38.6) · D 68.6% · R 30.0% · Other 1.4%
- 2008→2024 swing
- -0.7pp no change · 2008: 39.3pp · 2024: 38.6pp
- All cycles
- 2024: D+38.6 2020: D+40.8 2016: D+36.5 2012: D+39.6 2008: D+39.3
Not yet ingested
- Civics
- —
Market trends
- HPI YoY
- ▼ -15.69%
- Current HPI
- 322.7335
- Rent YoY
- ▲ 3.31%
- Metro
- Virginia Beach-Norfolk-Newport News, VA-NC
- State GDP YoY
- ▲ 2.40%
- F500 in state
- 50
Industry mix (Fortune 500 HQ in VA)
| Industry | F500 HQs | Revenue |
|---|---|---|
| Aerospace / Defense | 4 | $236B |
|
||
| Technology / Defense | 3 | $32B |
|
||
| Financial Services | 2 | $176B |
|
||
| Utilities | 2 | $27B |
|
||
| Insurance | 2 | $25B |
|
||
| Technology | 2 | $15B |
|
||
Price history
+536.8% since first listed17 events — show timeline
- 2026-05-12 Price Changed $199,900 REINMLS
- 2026-03-31 Listed $211,836 REINMLS
- 2025-09-08 Listing Removed — REINMLS
- 2025-06-22 Listed $245,000 REINMLS
- 2022-03-07 Sold (Public Records) $182,000 Public Records
- 2022-02-16 Pending — REINMLS
- 2022-02-02 Contingent — REINMLS
- 2022-01-14 Listed $182,000 REINMLS
- 2022-01-10 Listing Removed — REINMLS
- 2022-01-03 Price Changed $199,900 REINMLS
- 2021-12-16 Price Changed $209,500 REINMLS
- 2021-11-24 Listed $218,500 REINMLS
- 2021-07-22 Sold (Public Records) $100,000 Public Records
- 2021-05-24 Contingent — REINMLS
- 2021-05-22 Listing Removed — REINMLS
- 2021-05-14 Listed $100,000 REINMLS
- 2001-06-08 Sold (Public Records) $31,390 Public Records
Property tax history
-3.1%/yrLatest (2025): $2,070 · +2.1% YoY. Source: county tax records.
Cash-flow waterfall
monthlySold comps — $/sqft
last 12 mo · ≤1 miLoading sold comps…