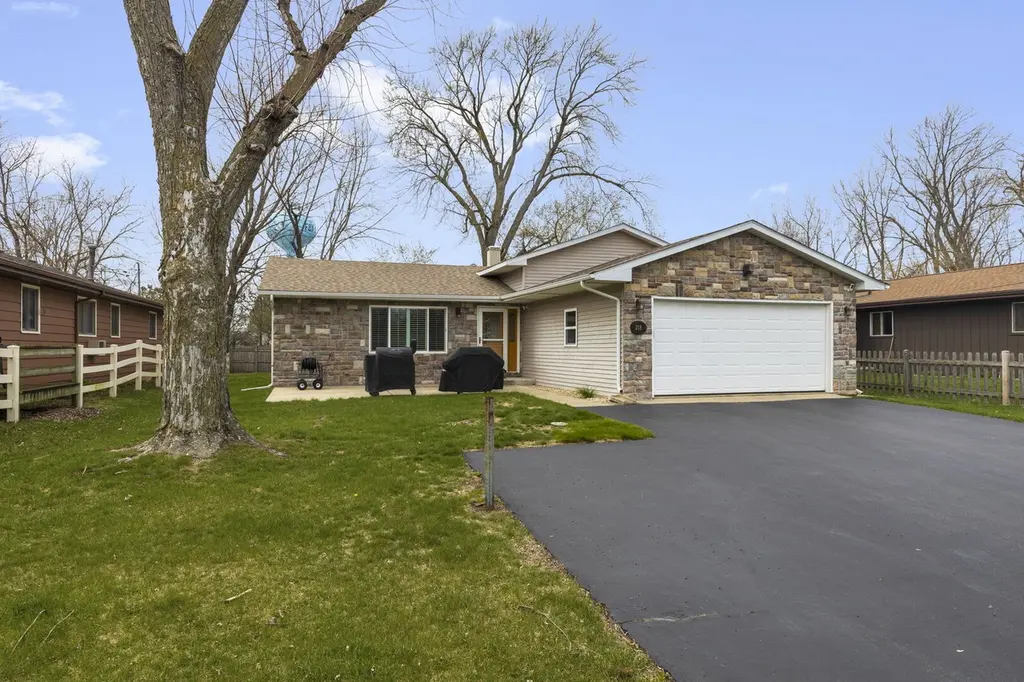
218 Mastodon Dr · Fox Lake, IL
Flood risk 2/10 · Minimal
- FEMA flood zone
- X (unshaded)
- Chance of flooding over 30 yrs
- 0.09%
- Est. flood insurance / yr
- $473 – $860
Fire risk 2/10 · Minimal
- Est. fire insurance / yr
- $804 – $1,492
Heat risk 2/10 · Minimal
- Hot days now (above 100°F)
- 7 days/yr
- Hot days in 30 yrs
- 14 days/yr
Wind risk 2/10 · Minimal
- Chance of severe wind over 30 yrs
- —
Air-quality risk 2/10 · Minimal
- Unhealthy air days now
- 1 days/yr
- Unhealthy air days in 30 yrs
- 1 days/yr
Risk factors via First Street. Map © Google.
Why this score? — see what drove the F grade
The composite is a weighted blend of 9 inputs, each scored 0–100. Each bar is that input's sub-score; the figure is the points it added to the 100-point composite (weight × sub-score).
- Cash flow +14.0/30.0
- DSCR +4.3/10.0
- 1% rule +4.0/10.0
- Livability +3.7/5.0
- Rent growth +2.5/5.0
- Condition / age +2.5/5.0
- Schools +2.3/10.0
- ARV discount +0.0/15.0
- Appreciation +0.0/10.0
$390,000
🖨 Deal sheet 📄 Offer letter ✓ Due diligence
Listing remarks
Enjoy peaceful water views and everyday comfort in this well-maintained 3-bedroom, 2.1-bath split-level home, perfectly situated across from Manitou Creek with access leading right to Fox Lake. Whether you're sipping your morning coffee or unwinding at sunset, the setting offers a relaxing, nature-filled backdrop. A standout feature of this property is that you co-own, along with two neighbors, a portion of the lot directly across the street, complete with a floating pier-perfect for docking your water toys and enjoying easy access to the water whenever you please. Inside, you'll find a functional layout with plenty of space to spread out. The lower level is a true highlight-featuring a coz
Key facts
- Wet bar
- Floating pier
- Access to fox lake
Tags
Property features AI
Finance
- Other: Lot is less than 0.25 acre (approx. 66 x 125); Lot size per county records; Listing possession at closing
- HOA & community: No master association fee required; Community includes water rights
Exterior
- Parking: Attached garage on asphalt driveway; 2 garage spaces (2 total parking spaces)
- Utilities: Public water; Public sewer; Gas service for heating and water heater; Electric service (standard)
- Home design: Detached single-family home; Tri-level / multi-level layout; Fee simple ownership; School bus service available; Located in a flood zone
- Construction: Built approximately 41-50 years ago; Vinyl siding with brick veneer; Asphalt roof; Tri-level foundation/layout
- Exterior features: Hot tub; Boat slip; Water view; Water rights
Interior
- Kitchen: Range; Microwave; Dishwasher; Refrigerator; Kitchen includes eating area and pantry/closet
- Bedrooms: 3 bedrooms (master and two additional bedrooms on the second level)
- Flooring: Luxury vinyl in kitchen, eating area, and one second-floor bedroom; Carpet in master bedroom and one bedroom; Parquet flooring in living and dining areas; Ceramic tile in foyer, sun room, lower-level family room and laundry
- Bathrooms: 2 full bathrooms and 1 half bathroom; Half bath attached to master bedroom
- Heating & cooling: Forced air heat (natural gas); Central air conditioning; CO detectors; Ceiling fan(s)
- Interior features: Finished full basement; Basement has a wood-burning fireplace; Screens on windows; 8 total rooms
- Laundry & utility: Washer and dryer included; Water heater (gas); Sump pump with backup; Owned water softener
Neighborhood map
What this means for you Summary
Snapshot
- This is a 3-bed/2.0-bath single-family listed at $390k.
Deal economics
- At list price, monthly cash flow is $53 ($634/yr) — positive.
- The deal already cash-flows at list — no discount required.
- To meet the 1% rule (rent ≥ 1% of price), the offer needs to be $351k (9.9% below list).
- Recommended offer: $351k (9.9% below list) — sets the bar for 1% rule.
Location & tenants
- Location reads 74/100 on livability (#247 in IL, #4,462 nationally) — a middle-class / working-renter tenant base. Strengths: cost of living A+, housing A+, commute A; Watch: amenities D+, health & safety F.
- Grant Chsd 124 (suburban): math 23% / reading 27% proficiency, ranked #296 of 620 in IL (top 48%) — low school quality limits family demand, transient renter base, plan for 1-2y turnover.
- Zoned schools: Grant Community High School (math 23% / reading 27%, grade F, #247 of 693 statewide, top 36%, 1,837 students, 0% FRL).
- Market conditions: 35 active listings in the ZIP; 2 comparable units currently listed for rent nearby; 948 units permitted in Lake County in 2024 (424 in 5+ unit buildings).
Forward outlook
- Local home prices are declining (-3.0%/yr); year-one equity from $3k of loan paydown is wiped out by about $12k of value loss. Plan a longer hold.
- Lake County population projected to shrink 8% by 2050 — rents likely to lag national; underwrite the cash flow, not the appreciation.
Negotiation context
- It's been on market 66 days — a 6% lower offer ($367k) is reasonable based on typical stale-listing flexibility.
- 2 sale attempts with the ask held roughly flat each time — persistent listings suggest the price (not the market) is what's stuck; bring a comps-based counter.
- Current owner paid $125k; list at $390k implies a 212% gain — meaningful room to come down on a strong offer.
Questions for the listing agent
- It's been on market 66 days. Have you received any prior offers? Is the seller open to a 10% concession, seller financing, or rate buy-down credit?
- Built in 1979 — when were the roof, HVAC, electrical panel, plumbing, and water heater last replaced?
- Why hasn't it sold? Are there any deal-killer items the seller is aware of (foundation, flood, title, zoning, code violations)?
- Is there a deadline driving the sale (1031 exchange, divorce, estate, relocation)? That informs how much negotiation room exists.
- Schools are F-rated, which usually means shorter tenancies and higher turnover. Who's the typical renter profile here, and what's been the actual vacancy rate?
- The area grade is low — what's the realistic commute time and amenity access for the typical tenant pool here? Any planned neighborhood developments (good or bad) we should know about?
- What's the average days-on-market for RENTAL listings here right now (not sales)? A rising rental-DOM trend means longer vacancies and softer asking-rent achievability than the comps imply.
- What's the recent tenant-quality profile in this submarket — average credit score on applications, eviction rate, late-payment / NSF rate, and stable-employment percentage? A property-management company in the area should have these aggregated.
- How much new for-sale + rental construction is in the pipeline within 1–3 miles? Heavy new supply typically softens prices + rents 12–24 months out; constrained supply supports both.
Investment metrics
- 1% rule
- 0.90% ✗
- Cap rate
- 6.46%
- Cash-on-cash
- 0.58%
- DSCR
- 1.03
- GRM
- 9.3
CMA / ARV
- ARV (on-the-fly)
- $288,454
- Comps found
- 12
Show comp detail 12 sales within ~0.75 mi
| Address | Dist | Beds/Ba | Sqft | Sold | Price | $/sf | Match |
|---|---|---|---|---|---|---|---|
| 502 Monroe Ave | 0.27mi | 3/2.0 | 1,160 (-6%) | 13mo | $270,000 | $233 | 66 |
| 314 Mastodon Dr | 0.09mi | 2/1.0 (-1) | 1,092 (-12%) | 4mo | $287,500 | $263 | 64 |
| 404 Monroe Ave | 0.19mi | 3/2.0 | 1,368 (+10%) | 12mo | $290,000 | $212 | 63 |
| 35737 N Hunt Ave | 0.70mi | 3/1.5 | 1,300 (+5%) | 1mo | $350,000 | $269 | 56 |
| 35694 N Helendale Rd | 0.65mi | 3/1.0 | 1,275 (+3%) | 10mo | $179,900 | $141 | 53 |
| 28 Rushmore Rd | 0.56mi | 4/2.0 (+1) | 1,120 (-10%) | 1mo | $318,000 | $284 | 52 |
| 29 S Hickory Ave | 0.70mi | 2/1.5 (-1) | 1,195 (-4%) | 4mo | $180,000 | $151 | 52 |
| 26238 W Hickory Ln | 0.70mi | 3/3.0 | 1,260 (+2%) | 11mo | $360,000 | $286 | 51 |
| 34 Hawthorne Ln | 0.52mi | 3/1.0 | 1,319 (+6%) | 13mo | $285,000 | $216 | 50 |
| 38 Lippincott Rd | 0.69mi | 2/2.0 (-1) | 1,152 (-7%) | 3mo | $270,000 | $234 | 49 |
| 11 S Lake Ave | 0.68mi | 2/1.0 (-1) | 1,140 (-8%) | 4mo | $189,900 | $167 | 43 |
| 35663 N Helendale Rd | 0.69mi | 4/1.5 (+1) | 1,416 (+14%) | 6mo | $300,000 | $212 | 31 |
Match score weights: distance 35% · size 25% · config 20% · recency 20%. Top-matched comps best support the ARV.
Projected returns pro-forma
-3.0% appreciation · 3.0% rent growth · sell at horizon
- IRR
- -15.4%
- Equity multiple
- 0.45×
- Total profit
- $-59,760
- Equity at exit
- $58,150
- IRR
- -6.8%
- Equity multiple
- 0.57×
- Total profit
- $-47,420
- Equity at exit
- $33,720
Cash invested: $109,200 (down + closing). Projections, not guarantees.
Landlord ↔ Tenant lean methodology
- Overall (STATE)
- 43 Moderately Tenant-Leaning
- State Illinois
- 43 Moderately Tenant-Leaning · D+7
- County
- — inherits STATE
- City
- — inherits STATE
ZIP-level market 60041
- Home prices YoY
- -25.0%
- Active inventory
- 35
- Price-to-rent
- 9.3×
Monthly cashflow live
- Estimated rent
- $3,513 medium interval (Pro) →
- Mortgage (P&I)
- −$2,045
- Tax from tax record
- −$515 /mo · $6,177/yr
- Insurance
- −$162
- HOA
- −$0
- Vacancy / Maint / Mgmt
- −$738
- Net cashflow
- $53
Break-even live
UW: 25.0% down · 7.5% · 30yr · 1.5% tax · 5.0% vac · 8.0% maint · 8.0% mgmt
Financing live
Cash to close
- Down payment
- $97,500
- Closing costs
- $11,700
- Reserves months
- —
- Total cash needed
- —
Loan-product check · same deal, 3 products live
Conventional
25% down · 7.5% · 30yr
- Down + closing
- —
- Monthly P&I
- —
- Monthly cashflow
- —
- DSCR
- —
- Eligible?
- —
Personal DTI + credit; lowest rate.
DSCR
20% down · 8.5% · 30yr
- Down + closing
- —
- Monthly P&I
- —
- Monthly cashflow
- —
- DSCR
- —
- Eligible?
- —
No personal income docs; deal must DSCR.
Hard money
10% down · 12.0% · 12mo
- Down + closing
- —
- Monthly P&I
- —
- Monthly cashflow
- —
- DSCR
- —
- Eligible?
- —
Short-term bridge; refi at stabilization.
Rent comps 2 comps
| Address | Beds | Baths | Sqft | Rent | $/sqft | DOM | Units | Dist |
|---|---|---|---|---|---|---|---|---|
| 28 Glen Ave Fox Lake, IL | 3.0 | 1.0 | 1212 | $2,300 | $1.90 | 7d | 1 | 1.42mi |
| 525 Circle Dr Unit 1374784P Fox Lake, IL | 3.0 | 2.0 | 1140 | $4,830 | $4.24 | 1d | 1 | 1.45mi |
Listing history 19 events
-
2026-06-18days on market $390,000 Active 66 DOM
-
2026-06-17days on market $390,000 Active 65 DOM
-
2026-06-16days on market $390,000 Active 64 DOM
-
2026-06-15pricedays on market $390,000 Active 63 DOM
-
2026-06-13pricedays on market $385,000 Active 61 DOM
-
2026-06-09days on market $400,000 Active 57 DOM
-
2026-06-08days on market $400,000 Active 56 DOM
-
2026-06-07days on market $400,000 Active 55 DOM
-
2026-06-04days on market $400,000 Active 52 DOM
-
2026-06-03days on market $400,000 Active 51 DOM
-
2026-06-02days on market $400,000 Active 50 DOM
-
2026-06-01days on market $400,000 Active 49 DOM
-
2026-05-31days on market $400,000 Active 48 DOM
-
2026-05-06status Active
-
2026-04-27historical Contingent - Continue to Show
-
2026-04-13$400,000 Active
-
1992-09-09soldstatus $125,000
-
1988-10-01soldstatus $122,000
-
1984-11-01soldstatus $86,900
ⓘ Source: listings_history table (triggers on properties + properties_extension) + one-shot
backfill from property_details.listing_events for pre-trigger history.
Tax reassessment forecast IL · Partial reset (capped growth)
- Current annual tax
- $6,177 · $515/mo
- Projected year-2 tax
- $7,515 · $626/mo
- Expected delta
- +$1,338/yr (+$112/mo · 21.7%)
ⓘ Screening estimate from a state-policy table — verify with the county assessor before closing.
Climate risk First Street
- Flood 2/10 Low FEMA zone X (unshaded) · 9% chance over 30 yrs
- Wildfire 2/10 Low
- Heat 2/10 Low 7 d/yr ≥100°F today · 14 d/yr by 30 yrs out
- Wind 2/10 Low
- Air quality 2/10 Low 1 unhealthy d/yr today · 1 by 30 yrs out
Nearby sold comps map
Loading sold comps map…
Walkable amenities ~0.75 mi
Loading nearby amenities…
Taxation est. · year 1
- Rental income
- $42,156
- − Mortgage interest
- −$21,846
- − Property taxes
- −$6,177
- − Insurance
- −$1,950
- − Repairs & maintenance
- −$3,372
- − Management
- −$3,372
- − Depreciation
- −$11,345
- Taxable loss
- −$5,907
- Est. tax savings @ 24.0%
- +$1,418
- After-tax cash flow
- $2,052/yr
For passive investors: Depreciation is non-cash, so a rental often shows a tax loss while cash-flowing — sheltering income. Rental losses are passive: they offset passive income freely, and up to $25,000/yr can offset ordinary (W-2) income if you actively participate and your MAGI is under $100k (phasing out to $0 by $150k); unused losses carry forward. On sale, claimed depreciation is recaptured at up to 25%, and gains may owe capital-gains tax (a 1031 exchange can defer both). Figures are a year-1 estimate at your 24.0% rate — not tax advice; consult a CPA.
Schools (NCES district)
- District
- Grant Chsd 124
- NCES district ID
- 1717340
- Math proficiency
- 23% ▼ -9.00%
- Reading proficiency
- 27% ▼ -7.00%
- Median HH income
- $59,450
- Composite
- 22.95/100
- National rank
- #7989
- State rank
- #296 of 620 in IL
Livability — Fox Lake
- Score
- 74/100
- State rank
- #247
- US rank
- #4462
Category grades
Schools grade is shown separately in the Schools card above.
Census & demographics
- Census place
- Fox Lake, IL
- City population
- 10,846
- Population (ZIP)
- 8,920
Population outlook (Lake County) Hauer SSP2
- Today (2025)
- 700,217 people
- By 2030
- 693,290 · -1.0%
- By 2040
- 673,588 · -3.8%
- By 2050
- 643,556 · -8.1%
- By 2075
- 562,792 · -19.6%
- By 2100
- 457,715 · -34.6%
Race, ethnicity, and origin ACS 2023
- Neighborhood character
- Predominantly White (65%)
- Race & ethnicity
- White 65% Hispanic / Latino 23% Two or more races 15% Black 4% Asian 2%
- Hispanic origin (detail)
- Mexican 15% Puerto Rican 2% Cuban 2%
- Common ancestry
- Romanian 12% Lithuanian 3% Iranian 2%
- Foreign-born
- 8% · Canada
- Languages at home
- 83% English-only · Spanish 15% Russian/Polish/Slavic 1% French/Haitian/Cajun 1%
Political lean MEDSL · Lake
- 2024 margin
- Strong D (+20.8) · D 59.7% · R 38.9% · Other 1.4%
- 2008→2024 swing
- +1.1pp toward D · 2008: 19.6pp · 2024: 20.8pp
- All cycles
- 2024: D+20.8 2020: D+24.1 2016: D+20.3 2012: D+8.1 2008: D+19.6
Not yet ingested
- Civics
- —
Market trends
- HPI YoY
- ▼ -76.75%
- Current HPI
- 230.4464
- Rent YoY
- —
- Metro
- —
- State GDP YoY
- ▲ 1.59%
- F500 in state
- 60
Industry mix (Fortune 500 HQ in IL)
| Industry | F500 HQs | Revenue |
|---|---|---|
| Insurance | 4 | $201B |
|
||
| Consumer Goods | 4 | $87B |
|
||
| Industrial Machinery | 3 | $64B |
|
||
| Healthcare | 2 | $55B |
|
||
| Retail / Pharmacy | 1 | $148B |
|
||
| Agriculture / Food | 1 | $86B |
|
||
Price history
+360.3% since first listed6 events — show timeline
- 2026-05-06 Relisted — MRED as Distributed by MLS Grid
- 2026-04-27 Contingent — MRED as Distributed by MLS Grid
- 2026-04-13 Listed $400,000 MRED as Distributed by MLS Grid
- 1992-09-09 Sold (Public Records) $125,000 Public Records
- 1988-10-01 Sold (Public Records) $122,000 Public Records
- 1984-11-01 Sold (Public Records) $86,900 Public Records
Property tax history
+1.9%/yrLatest (2024): $6,177 · +16.0% YoY. Source: county tax records.
Cash-flow waterfall
monthlySold comps — $/sqft
last 12 mo · ≤1 miLoading sold comps…