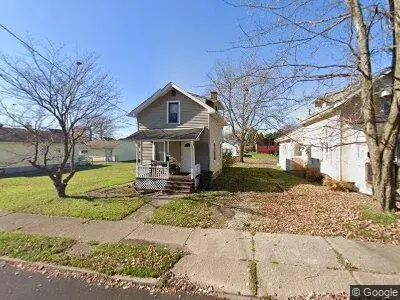
1617 Frederick Ave SW · Canton, OH
Flood risk 1/10 · Minimal
- FEMA flood zone
- X (unshaded)
- Chance of flooding over 30 yrs
- 0.0%
- Est. flood insurance / yr
- $473 – $860
Fire risk 1/10 · Minimal
- Est. fire insurance / yr
- $713 – $1,323
Heat risk 3/10 · Minor
- Hot days now (above 96°F)
- 7 days/yr
- Hot days in 30 yrs
- 17 days/yr
Wind risk 1/10 · Minimal
- Chance of severe wind over 30 yrs
- —
Air-quality risk 2/10 · Minimal
- Unhealthy air days now
- 0 days/yr
- Unhealthy air days in 30 yrs
- 1 days/yr
Risk factors via First Street. Map © Google.
Why this score? — see what drove the B+ grade
The composite is a weighted blend of 9 inputs, each scored 0–100. Each bar is that input's sub-score; the figure is the points it added to the 100-point composite (weight × sub-score).
- Cash flow +30.0/30.0
- ARV discount +15.0/15.0
- 1% rule +10.0/10.0
- DSCR +10.0/10.0
- Livability +3.6/5.0
- Rent growth +2.5/5.0
- Condition / age +2.5/5.0
- Schools +1.7/10.0
- Appreciation +0.0/10.0
$45,000
🖨 Deal sheet 📄 Offer letter ✓ Due diligence
Listing remarks
Little House with LOTS of charm! This home would be perfect for an investment flip, 2 bedrooms 1 bathroom home with kitchen, Livingroom and dining room on main level. Two bedrooms upstairs with laundry in the basement. Does need cosmetic renovation inside which is why it is priced low. All the plumbing and water pipes work.
Key facts
- Kitchen
- Dining room
- Livingroom
Tags
Neighborhood map
What this means for you Summary
Snapshot
- This is a 1-bed/1.0-bath single-family listed at $45k.
Deal economics
- At list price, monthly cash flow is $285 ($3k/yr) — positive.
- The deal already cash-flows at list — no discount required.
- Meets the 1% rule at list price ($770 rent vs $45k).
- Recommended offer: $44k (3.0% below list) — sets the bar for market timing.
- Cap rate 13.9% vs local median 5.1% in Canton — top-decile yield for the area; either an underpriced asset or a hidden risk that comps aren't pricing in. Stress-test before assuming the spread holds.
Location & tenants
- Location reads 71/100 on livability (#441 in OH) — a middle-class / working-renter tenant base. Strengths: commute A+, cost of living A+, housing A; Watch: crime F, employment F.
- Canton City (urban): math 17% / reading 26% proficiency, ranked #627 of 656 in OH (top 96%) — low school quality limits family demand, transient renter base, plan for 1-2y turnover; 76% free/reduced lunch — lower-income household profile, screen leases tightly.
- Market conditions: 87 active listings in the ZIP; 2 comparable units currently listed for rent nearby; 528 units permitted in Stark County in 2024 (84 in 5+ unit buildings).
- This rent is only 16% of the median local income ($58k/yr) — well below the 30% rent-burden line; pricing power to push rent on renewal without tenant pushback.
Forward outlook
- Local home prices are declining (-3.0%/yr); year-one equity from $311 of loan paydown is wiped out by about $1k of value loss. Plan a longer hold.
- Stark County population projected to shrink 8% by 2050 — rents likely to lag national; underwrite the cash flow, not the appreciation.
- At projected returns (-3.0% appreciation + 3.0% rent growth), your $13k cash investment doubles in ~5 years — after that, you're playing with house money.
Negotiation context
- It's been on market 37 days — a 3% lower offer ($44k) is reasonable based on typical stale-listing flexibility.
- 6 sale attempts since 26y ago with the ask held roughly flat each time — persistent listings suggest the price (not the market) is what's stuck; bring a comps-based counter.
- Current owner paid $29k; list at $45k implies a 55% gain — meaningful room to come down on a strong offer.
Questions for the listing agent
- It's been on market 37 days. Have you received any prior offers? Is the seller open to a 3% concession, seller financing, or rate buy-down credit?
- Built in 1960 — when were the roof, HVAC, electrical panel, plumbing, and water heater last replaced?
- Is there a deadline driving the sale (1031 exchange, divorce, estate, relocation)? That informs how much negotiation room exists.
- Crime grade is F in this area — have there been break-ins, vandalism, or insurance claims at this property in the last 3 years? What carrier currently insures it and at what premium?
- What's the average days-on-market for RENTAL listings here right now (not sales)? A rising rental-DOM trend means longer vacancies and softer asking-rent achievability than the comps imply.
- What's the recent tenant-quality profile in this submarket — average credit score on applications, eviction rate, late-payment / NSF rate, and stable-employment percentage? A property-management company in the area should have these aggregated.
- How much new for-sale + rental construction is in the pipeline within 1–3 miles? Heavy new supply typically softens prices + rents 12–24 months out; constrained supply supports both.
Investment metrics
- 1% rule
- 1.71% ✓
- Cap rate
- 13.89%
- Cash-on-cash
- 27.12%
- DSCR
- 2.21
- GRM
- 4.9
CMA / ARV
- ARV (on-the-fly)
- $73,920
- Comps found
- 5
Show comp detail 5 sales within ~0.75 mi
| Address | Dist | Beds/Ba | Sqft | Sold | Price | $/sf | Match |
|---|---|---|---|---|---|---|---|
| 1712 Clarendon Ave SW | 0.13mi | 1/1.0 | 600 (-11%) | 6mo | $55,000 | $92 | 71 |
| 1540 Tanner Ave SW | 0.07mi | 2/1.0 (+1) | 768 (+14%) | 10mo | $82,500 | $107 | 60 |
| 3000 Windsor Pl | 0.37mi | 2/1.0 (+1) | 682 (+2%) | 20mo | $75,000 | $110 | 58 |
| 1729 Gambrinus Ave SW | 0.67mi | 1/1.5 | 709 (+6%) | 2mo | $112,000 | $158 | 56 |
| 1144 Homewood Ave SW | 0.59mi | 2/1.0 (+1) | 676 (+1%) | 13mo | $79,500 | $118 | 56 |
Match score weights: distance 35% · size 25% · config 20% · recency 20%. Top-matched comps best support the ARV.
Projected returns pro-forma
-3.0% appreciation · 3.0% rent growth · sell at horizon
- IRR
- 21.1%
- Equity multiple
- 1.86×
- Total profit
- $10,862
- Equity at exit
- $6,710
- IRR
- 29.3%
- Equity multiple
- 3.61×
- Total profit
- $32,888
- Equity at exit
- $3,891
Cash invested: $12,600 (down + closing). Projections, not guarantees.
Landlord ↔ Tenant lean methodology
- Overall (STATE)
- 73 Landlord-Friendly
- State Ohio
- 73 Landlord-Friendly · R+6
- County
- — inherits STATE
- City
- — inherits STATE
ZIP-level market 44706
- Active inventory
- 87
- Price-to-rent
- 4.9×
Monthly cashflow live
- Estimated rent
- $770 medium interval (Pro) →
- Mortgage (P&I)
- −$236
- Tax from tax record
- −$69 /mo · $829/yr
- Insurance
- −$19
- HOA
- −$0
- Vacancy / Maint / Mgmt
- −$162
- Net cashflow
- $285
Break-even live
UW: 25.0% down · 7.5% · 30yr · 1.5% tax · 5.0% vac · 8.0% maint · 8.0% mgmt
Financing live
Cash to close
- Down payment
- $11,250
- Closing costs
- $1,350
- Reserves months
- —
- Total cash needed
- —
Loan-product check · same deal, 3 products live
Conventional
25% down · 7.5% · 30yr
- Down + closing
- —
- Monthly P&I
- —
- Monthly cashflow
- —
- DSCR
- —
- Eligible?
- —
Personal DTI + credit; lowest rate.
DSCR
20% down · 8.5% · 30yr
- Down + closing
- —
- Monthly P&I
- —
- Monthly cashflow
- —
- DSCR
- —
- Eligible?
- —
No personal income docs; deal must DSCR.
Hard money
10% down · 12.0% · 12mo
- Down + closing
- —
- Monthly P&I
- —
- Monthly cashflow
- —
- DSCR
- —
- Eligible?
- —
Short-term bridge; refi at stabilization.
Rent comps 2 comps
| Address | Beds | Baths | Sqft | Rent | $/sqft | DOM | Units | Dist |
|---|---|---|---|---|---|---|---|---|
| 605 Smith Ave SW #2 Canton, OH | 1.0 | 1.0 | 668 | $795 | $1.19 | 44d | 1 | 1.06mi |
| 427 Smith Ave NW Unit 1 Canton, OH | 1.0 | 1.0 | 592 | $725 | $1.22 | 21d | 1 | 1.49mi |
Listing history 46 events
-
2026-06-18days on market $45,000 Active 37 DOM
-
2026-06-17days on market $45,000 Active 36 DOM
-
2026-06-16days on market $45,000 Active 35 DOM
-
2026-06-15days on market $45,000 Active 34 DOM
-
2026-06-14days on market $45,000 Active 32 DOM
-
2026-06-13days on market $45,000 Active 31 DOM
-
2026-06-10days on market $45,000 Active 29 DOM
-
2026-06-09days on market $45,000 Active 28 DOM
-
2026-06-08days on market $45,000 Active 27 DOM
-
2026-06-07days on market $45,000 Active 26 DOM
-
2026-06-05days on market $45,000 Active 23 DOM
-
2026-06-03days on market $45,000 Active 22 DOM
-
2026-06-02days on market $45,000 Active 21 DOM
-
2026-06-01days on market $45,000 Active 20 DOM
-
2026-05-31days on market $45,000 Active 19 DOM
-
2026-05-30days on market $45,000 Active 18 DOM
-
2026-05-12$45,000 Active 325-char remark
-
2020-11-04price $29,000
-
2020-11-04price $29,000
-
2020-11-04price $29,000
-
2020-11-04price $29,000
-
2020-11-04price $29,000
-
2020-07-31historical
-
2020-07-14price $37,500
-
2020-06-16price $44,900
-
2020-05-02price $29,000
-
2020-01-29$47,000 Active
-
2019-12-27historical
-
2019-12-27status Active
-
2019-12-26historical
-
2019-09-10status Active
-
2019-09-06historical
-
2019-07-30price $49,900
-
2019-02-05$51,900 Active
-
2014-02-12price $29,000
-
2014-02-12price $29,000
-
2001-12-01historical
-
2000-08-29$287,700
-
1998-01-30price $287,700
-
1998-01-30price $287,700
-
1998-01-30price $287,700
-
1998-01-30price $287,700
-
1998-01-30price $287,700
-
1998-01-30price $287,700
-
1998-01-30price $287,700
-
1998-01-30soldstatus $29,000
ⓘ Source: listings_history table (triggers on properties + properties_extension) + one-shot
backfill from property_details.listing_events for pre-trigger history.
Tax reassessment forecast OH · Partial reset (capped growth)
- Current annual tax
- $829 · $69/mo
- Projected year-2 tax
- $829 · $69/mo
- Expected delta
- $0/yr ($0/mo · 0.0%)
ⓘ Screening estimate from a state-policy table — verify with the county assessor before closing.
Climate risk First Street
- Flood 1/10 Low FEMA zone X (unshaded) · 0% chance over 30 yrs
- Wildfire 1/10 Low
- Heat 3/10 Moderate 7 d/yr ≥96°F today · 17 d/yr by 30 yrs out
- Wind 1/10 Low
- Air quality 2/10 Low 0 unhealthy d/yr today · 1 by 30 yrs out
Nearby sold comps map
Loading sold comps map…
Walkable amenities ~0.75 mi
Loading nearby amenities…
Taxation est. · year 1
- Rental income
- $9,243
- − Mortgage interest
- −$2,521
- − Property taxes
- −$829
- − Insurance
- −$225
- − Repairs & maintenance
- −$739
- − Management
- −$739
- − Depreciation
- −$1,309
- Taxable income
- $2,881
- Est. tax owed @ 24.0%
- −$691
- After-tax cash flow
- $2,725/yr
For passive investors: Depreciation is non-cash, so a rental often shows a tax loss while cash-flowing — sheltering income. Rental losses are passive: they offset passive income freely, and up to $25,000/yr can offset ordinary (W-2) income if you actively participate and your MAGI is under $100k (phasing out to $0 by $150k); unused losses carry forward. On sale, claimed depreciation is recaptured at up to 25%, and gains may owe capital-gains tax (a 1031 exchange can defer both). Figures are a year-1 estimate at your 24.0% rate — not tax advice; consult a CPA.
Schools (NCES district)
- District
- Canton City
- NCES district ID
- 3904371
- Math proficiency
- 17% ▼ -17.00%
- Reading proficiency
- 26% ▼ -12.00%
- Median HH income
- $28,825
- Composite
- 17.1/100
- National rank
- #9116
- State rank
- #627 of 656 in OH
Livability — Canton
- Score
- 71/100
- State rank
- #441
- US rank
- #7259
Category grades
Schools grade is shown separately in the Schools card above.
Census & demographics
- Census place
- Canton, OH
- County
- Stark County · 272,865 people
- City population
- 103,614
- Metro
- Canton-Massillon, OH
- Population (ZIP)
- 16,496
- Household income
- $58,228
- Rent vs Own
- Severe rent burden
- 502.0
Population outlook (Stark County) Hauer SSP2
- Today (2025)
- 373,708 people
- By 2030
- 371,245 · -0.7%
- By 2040
- 361,331 · -3.3%
- By 2050
- 345,290 · -7.6%
- By 2075
- 302,669 · -19.0%
- By 2100
- 238,870 · -36.1%
Race, ethnicity, and origin ACS 2023
- Neighborhood character
- Predominantly White (84%)
- Race & ethnicity
- White 84% Black 8% Two or more races 6% Hispanic / Latino 3%
- Common ancestry
- Romanian 4% Italian 3% Lithuanian 2%
- Foreign-born
- 1% · Canada
- Languages at home
- 98% English-only · Spanish 2%
Political lean MEDSL · Stark
- 2024 margin
- Strong R (+21.9) · D 38.6% · R 60.5%
- 2008→2024 swing
- -27.4pp toward R · 2008: 5.5pp · 2024: -21.9pp
- All cycles
- 2024: R+21.9 2020: R+18.5 2016: R+17.4 2012: R+0.4 2008: D+5.5
Not yet ingested
- Civics
- —
Market trends
- HPI YoY
- ▼ -156.35%
- Current HPI
- 239.851
- Rent YoY
- —
- Metro
- Canton-Massillon, OH
- State GDP YoY
- ▲ 1.98%
- F500 in state
- 48
Industry mix (Fortune 500 HQ in OH)
| Industry | F500 HQs | Revenue |
|---|---|---|
| Insurance | 3 | $145B |
|
||
| Industrial Machinery | 3 | $49B |
|
||
| Financial Services | 3 | $24B |
|
||
| Consumer Goods | 2 | $93B |
|
||
| Aerospace / Defense | 2 | $47B |
|
||
| Utilities | 2 | $33B |
|
||
Price history
-84.4% since first listed30 events — show timeline
- 2026-05-12 Listed $45,000 FSBO.com
- 2020-11-04 Price Changed $29,000 MLSNOW
- 2020-11-04 Price Changed $29,000 MLSNOW
- 2020-11-04 Price Changed $29,000 MLSNOW
- 2020-11-04 Price Changed $29,000 MLSNOW
- 2020-11-04 Price Changed $29,000 MLSNOW
- 2020-07-31 Listing Removed — MLSNOW
- 2020-07-14 Price Changed $37,500 MLSNOW
- 2020-06-16 Price Changed $44,900 MLSNOW
- 2020-05-02 Price Changed $29,000 MLSNOW
- 2020-01-29 Listed $47,000 MLSNOW
- 2019-12-27 Listing Removed — MLSNOW
- 2019-12-27 Relisted — MLSNOW
- 2019-12-26 Listing Removed — MLSNOW
- 2019-09-10 Relisted — MLSNOW
- 2019-09-06 Listing Removed — MLSNOW
- 2019-07-30 Price Changed $49,900 MLSNOW
- 2019-02-05 Listed $51,900 MLSNOW
- 2014-02-12 Price Changed $29,000 MLSNOW
- 2014-02-12 Price Changed $29,000 MLSNOW
- 2001-12-01 Listing Removed — MLSNOW
- 2000-08-29 Listed $287,700 MLSNOW
- 1998-01-30 Sold (Public Records) $29,000 Public Records
- 1998-01-30 Price Changed $287,700 MLSNOW
- 1998-01-30 Price Changed $287,700 MLSNOW
- 1998-01-30 Price Changed $287,700 MLSNOW
- 1998-01-30 Price Changed $287,700 MLSNOW
- 1998-01-30 Price Changed $287,700 MLSNOW
- 1998-01-30 Price Changed $287,700 MLSNOW
- 1998-01-30 Price Changed $287,700 MLSNOW
Property tax history
+3.8%/yrLatest (2024): $829 · -3.2% YoY. Source: county tax records.
Cash-flow waterfall
monthlySold comps — $/sqft
last 12 mo · ≤1 miLoading sold comps…