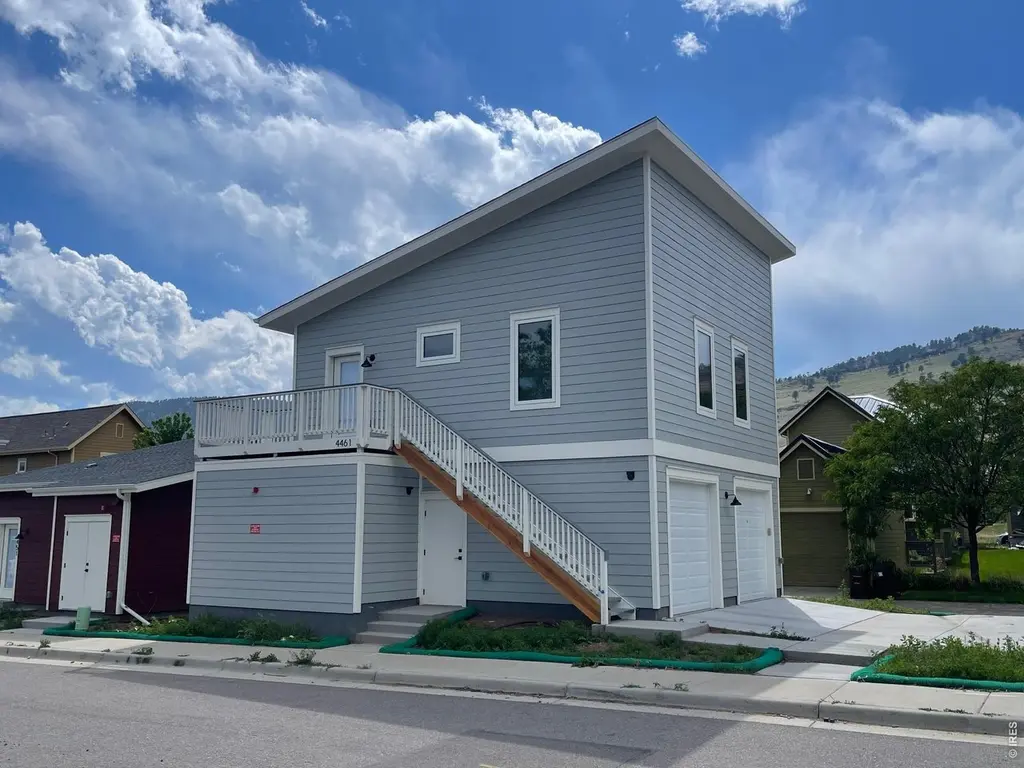
4461 West Ct · Boulder, CO
Flood risk No data
- FEMA flood zone
- —
- Chance of flooding over 30 yrs
- —
- Est. flood insurance / yr
- —
Fire risk No data
- Est. fire insurance / yr
- —
Heat risk No data
- Hot days now (above threshold)
- —
- Hot days in 30 yrs
- —
Wind risk No data
- Chance of severe wind over 30 yrs
- —
Air-quality risk No data
- Unhealthy air days now
- —
- Unhealthy air days in 30 yrs
- —
Risk factors via First Street. Map © Google.
Why this score? — see what drove the D- grade
The composite is a weighted blend of 9 inputs, each scored 0–100. Each bar is that input's sub-score; the figure is the points it added to the 100-point composite (weight × sub-score).
- Cash flow +9.0/30.0
- ARV discount +7.5/15.0
- Schools +5.1/10.0
- 1% rule +4.4/10.0
- Condition / age +4.0/5.0
- Livability +3.9/5.0
- Rent growth +3.0/5.0
- DSCR +2.5/10.0
- Appreciation +0.0/10.0
$236,700
🖨 Deal sheet (PDF) 📄 Offer letter ✓ Due diligence
Listing remarks
CITY OF BOULDER AFFORDABLE HOUSING, buyer must qualify. Welcome to 4461 West Court - North Boulder modern carriage house perched above its own private garage, this charming carriage house delivers the best of North Boulder living in a fresh, move-in-ready package with all new appliances including washer/dryer. Clean contemporary lines, crisp gray lap siding with white trim, and a welcoming cute deck at the front door. Step inside to discover a bright, efficiently designed two-bedroom layout where natural light pours through thoughtfully placed windows. The elevated position of the home offers pleasant views and a sense of privacy that's rare. Below, the private one car garage keeps your car
Key facts
- Pleasant views
- Private garage
- New appliances
Tags
Property features AI
Finance
- Other: Minimal flood risk (C rating)
- HOA & community: Ponderosa HOA; Monthly HOA fee of $300; HOA covers common amenities, trash, snow removal, management, utilities, and exterior maintenance; Association transfer fee and reserves in place; Pets allowed: dogs and cats; Community park
Exterior
- Parking: Detached garage (1 space); Detached parking
- Utilities: City water with meter installed; Public sewer; Natural gas available (Xcel); Electricity available
- Home design: Residential property; One story; Attached property; Second-floor structure with outside entry
- Construction: Frame construction; Composition roof; New construction (completed)
- Exterior features: Deck; Paved lot
Interior
- Kitchen: Electric range; Dishwasher; Refrigerator; Microwave
- Bedrooms: 2 bedrooms (all bedrooms conform)
- Bathrooms: 1 full bathroom
- Heating & cooling: Forced air heating
- Interior features: Open floorplan; Window coverings
- Laundry & utility: Washer; Dryer
Neighborhood map
What this means for you Summary
Snapshot
- This is a 1-bed/1.0-bath condo listed at $237k. Condition is rated good.
Deal economics
- At list price, monthly cash flow is $-184 ($-2k/yr) — negative.
- To cash-flow at today's rent, offer at most $210k (11.3% below list).
- To meet the 1% rule (rent ≥ 1% of price), the offer needs to be $222k (6.3% below list).
- Recommended offer: $210k (11.3% below list) — sets the bar for cash-flow.
- Cap rate 5.4% vs local median 1.7% in Boulder — top-decile yield for the area; either an underpriced asset or a hidden risk that comps aren't pricing in. Stress-test before assuming the spread holds.
Location & tenants
- Location reads 77/100 on livability (#24 in CO, #2,958 nationally) — a middle-class / working-renter tenant base. Strengths: amenities A+, commute A+, health & safety A+; Watch: crime D+, cost of living F.
- Boulder Valley School District No. Re2 (urban): math 49% / reading 67% proficiency, ranked #6 of 86 in CO (top 7%) — acceptable for families but not a draw, mixed tenant base, ~2y average lease; only 16% free/reduced lunch — higher-income household profile.
- Zoned schools: Foothill Elementary School (math 52% / reading 77%, grade B, #62 of 966 statewide, top 7%, 437 students, 9% FRL); Boulder High School (math 64% / reading 81%, grade B+, #18 of 381 statewide, top 4%, 2,074 students, 28% FRL) — zoned schools at 18% FRL track the district average.
- Market conditions: Rents rising (+1.8%/yr); 256 active listings in the ZIP; 4 comparable units currently listed for rent nearby; rentals at typical pace (median 15d on market — plan ~3-4 weeks tenant-placement turnaround); high-income renter base; 1,688 units permitted in Boulder County in 2024 (1,136 in 5+ unit buildings).
Forward outlook
- Local home prices are declining (-3.0%/yr); year-one equity from $2k of loan paydown is wiped out by about $7k of value loss. Plan a longer hold.
- Boulder County population projected at +40% by 2050 — long-run rental-demand tailwind backs the buy-and-hold thesis.
Negotiation context
- It's been on market 27 days — a 2% lower offer ($233k) is reasonable based on typical stale-listing flexibility.
Questions for the listing agent
- What do current leases actually rent for vs. the listed asking? Can we see a recent rent roll and the last 12 months of T-12 income?
- What does the HOA fee cover, when was the last increase, and are there any pending special assessments or reserve-fund shortfalls?
- Any open or pending special assessments — roof, HVAC, plumbing, elevator, façade? What's the per-unit balance and payoff schedule, and is the seller paying it off at close or rolling it to the buyer?
- Is there a deadline driving the sale (1031 exchange, divorce, estate, relocation)? That informs how much negotiation room exists.
- Schools are B-rated — typically a magnet for longer-tenancy family renters. What's the average tenant stay here, and is there a school-zone premium baked into asking?
- Crime grade is D in this area — have there been break-ins, vandalism, or insurance claims at this property in the last 3 years? What carrier currently insures it and at what premium?
- The area grade is low — what's the realistic commute time and amenity access for the typical tenant pool here? Any planned neighborhood developments (good or bad) we should know about?
- What's the average days-on-market for RENTAL listings here right now (not sales)? A rising rental-DOM trend means longer vacancies and softer asking-rent achievability than the comps imply.
- What's the recent tenant-quality profile in this submarket — average credit score on applications, eviction rate, late-payment / NSF rate, and stable-employment percentage? A property-management company in the area should have these aggregated.
- How much new apartment / multifamily construction is in the pipeline within 1–3 miles? Heavy new supply (>2% of stock underway) typically softens rents 12–24 months out; light construction supports rent growth.
Investment metrics
- 1% rule
- 0.94% ✗
- Cap rate
- 5.36%
- Cash-on-cash
- -3.34%
- DSCR
- 0.85
- GRM
- 8.9
CMA / ARV
No comps found within radius.
Projected returns pro-forma
-3.0% appreciation · 1.82% rent growth · sell at horizon
- IRR
- -23.4%
- Equity multiple
- 0.21×
- Total profit
- $-52,479
- Equity at exit
- $35,293
- IRR
- -22.0%
- Equity multiple
- -0.06×
- Total profit
- $-70,355
- Equity at exit
- $20,465
Cash invested: $66,276 (down + closing). Projections, not guarantees.
Landlord ↔ Tenant lean methodology
- Overall (STATE)
- 38 Tenant-Leaning
- State Colorado
- 38 Tenant-Leaning · D+4
- County
- — inherits STATE
- City
- — inherits STATE
ZIP-level market 80304
- Rents YoY
- 1.8%
- Active inventory
- 256
- Price-to-rent
- 8.9×
Monthly cashflow live
- Estimated rent
- $2,217 medium interval (Pro) →
- Mortgage (P&I)
- −$1,241
- Tax est. 1.5%
- −$296 /mo · $3,550/yr
- Insurance
- −$99
- HOA
- −$300
- Vacancy / Maint / Mgmt
- −$466
- Net cashflow
- $-184
Break-even live
Sensitivity live
| Price | -10% $-21 | -5% $-103 | +0% $-184 | +5% $-266 | +10% $-348 |
|---|---|---|---|---|---|
| Rent | -10% $-359 | -5% $-272 | +0% $-184 | +5% $-97 | +10% $-9 |
| Rate | -1.0pp $-65 | -0.5pp $-124 | base $-184 | +0.5pp $-246 | +1.0pp $-308 |
UW: 25.0% down · 7.5% · 30yr · 1.5% tax · 5.0% vac · 8.0% maint · 8.0% mgmt
Financing live
Cash to close
- Down payment
- $59,175
- Closing costs
- $7,101
- Reserves months
- —
- Total cash needed
- —
Loan-product check · same deal, 3 products live
Conventional
25% down · 7.5% · 30yr
- Down + closing
- —
- Monthly P&I
- —
- Monthly cashflow
- —
- DSCR
- —
- Eligible?
- —
Personal DTI + credit; lowest rate.
DSCR
20% down · 8.5% · 30yr
- Down + closing
- —
- Monthly P&I
- —
- Monthly cashflow
- —
- DSCR
- —
- Eligible?
- —
No personal income docs; deal must DSCR.
Hard money
10% down · 12.0% · 12mo
- Down + closing
- —
- Monthly P&I
- —
- Monthly cashflow
- —
- DSCR
- —
- Eligible?
- —
Short-term bridge; refi at stabilization.
Rent comps 4 comps
| Address | Beds | Baths | Sqft | Rent | $/sqft | DOM | Units | Dist |
|---|---|---|---|---|---|---|---|---|
| 4456 Broadway Boulder, CO | 2.0 | 1.0–2.0 | 670 | $2,060 | $3.07 | 14d | 4 | 0.18mi |
| 4560 13th St Boulder, CO | 1.0–2.0 | 1.0–2.5 | 912 | $1,740 | $1.91 | 14d | 6 | 0.24mi |
| 4775 13th St Boulder, CO | 4.0 | 1.0–4.5 | 1547 | $2,809 | $1.82 | 14d | 28 | 0.42mi |
| 4650 Holiday Dr #203 Boulder, CO | 1.0 | 1.0 | 736 | $3,295 | $4.48 | 14d | 1 | 0.43mi |
HOA detail condo
- Monthly dues
- $300 · $3,600/yr
- Assessments
- None detected in remarks — confirm with the listing agent.
Listing history 17 events
-
2026-06-18days on market $236,700 Active 27 DOM
-
2026-06-17days on market $236,700 Active 26 DOM
-
2026-06-16days on market $236,700 Active 25 DOM
-
2026-06-15days on market $236,700 Active 24 DOM
-
2026-06-14days on market $236,700 Active 22 DOM
-
2026-06-13days on market $236,700 Active 21 DOM
-
2026-06-10days on market $236,700 Active 19 DOM
-
2026-06-09days on market $236,700 Active 18 DOM
-
2026-06-09days on market $236,700 Active 17 DOM
-
2026-06-07days on market $236,700 Active 16 DOM
-
2026-06-05days on market $236,700 Active 13 DOM
-
2026-06-03days on market $236,700 Active 12 DOM
-
2026-06-02days on market $236,700 Active 11 DOM
-
2026-06-01days on market $236,700 Active 10 DOM
-
2026-05-31days on market $236,700 Active 9 DOM
-
2026-05-30days on market $236,700 Active 8 DOM
-
2026-05-22$236,700 Active
ⓘ Source: listings_history table (triggers on properties + properties_extension) + one-shot
backfill from property_details.listing_events for pre-trigger history.
Nearby sold comps map
Loading sold comps map…
Walkable amenities ~0.75 mi
Loading nearby amenities…
Taxation est. · year 1
- Rental income
- $26,604
- − Mortgage interest
- −$13,259
- − Property taxes
- −$3,550
- − Insurance
- −$1,184
- − Repairs & maintenance
- −$2,128
- − Management
- −$2,128
- − HOA
- −$3,600
- − Depreciation
- −$6,886
- Taxable loss
- −$6,131
- Est. tax savings @ 24.0%
- +$1,471
- After-tax cash flow
- $-740/yr
For passive investors: Depreciation is non-cash, so a rental often shows a tax loss while cash-flowing — sheltering income. Rental losses are passive: they offset passive income freely, and up to $25,000/yr can offset ordinary (W-2) income if you actively participate and your MAGI is under $100k (phasing out to $0 by $150k); unused losses carry forward. On sale, claimed depreciation is recaptured at up to 25%, and gains may owe capital-gains tax (a 1031 exchange can defer both). Figures are a year-1 estimate at your 24.0% rate — not tax advice; consult a CPA.
Condition & rehab AI · 12 photos
This move-in-ready carriage house in Boulder offers a fresh, modern interior with a good condition exterior and a new deck. It's an excellent investment opportunity with potential for value-add improvements.
Value-add opportunities
- Both Paint interior walls — Fresh paint enhances curb appeal and interior aesthetics
- Both Replace carpet with hardwood flooring — Hardwood flooring is more durable and adds value
- Both Install smart home devices — Smart home devices improve convenience and energy efficiency
Renovation cost estimate screening
Value-add ROI direction
- Both Paint interior walls — Fresh paint enhances curb appeal and interior aesthetics ↑
- Both Replace carpet with hardwood flooring — Hardwood flooring is more durable and adds value ↑
- Both Install smart home devices — Smart home devices improve convenience and energy efficiency ↑
ⓘ Cost ranges are severity-bucket heuristics (US national rule-of-thumb). Get contractor quotes + a written scope before underwriting a rehab budget.
Schools (NCES district)
- District
- Boulder Valley School District No. Re2
- NCES district ID
- 0802490
- Math proficiency
- 49% ▼ -3.00%
- Reading proficiency
- 67% ▲ 4.00%
- Median HH income
- $70,395
- Composite
- 51.3/100
- National rank
- #1747
- State rank
- #6 of 86 in CO
Livability — Boulder
- Score
- 77/100
- State rank
- #24
- US rank
- #2958
Category grades
Schools grade is shown separately in the Schools card above.
Census & demographics
- Census place
- Boulder, CO
- County
- Boulder County · 271,666 people
- City population
- 121,246
- Metro
- Boulder, CO
- Population (ZIP)
- 25,383
- Household income
- $126,558
- Rent vs Own
- Severe rent burden
- 891.0
Population outlook (Boulder County) Hauer SSP2
- Today (2025)
- 380,833 people
- By 2030
- 412,028 · +8.2%
- By 2040
- 472,764 · +24.1%
- By 2050
- 532,029 · +39.7%
- By 2075
- 679,723 · +78.5%
- By 2100
- 766,278 · +101.2%
Race, ethnicity, and origin ACS 2023
- Neighborhood character
- Predominantly White (76%)
- Race & ethnicity
- White 76% Hispanic / Latino 16% Two or more races 10% Asian 3%
- Hispanic origin (detail)
- Mexican 11%
- Common ancestry
- Italian 4% Romanian 4% Slovak 3%
- Foreign-born
- 12% · Canada, China, Jamaica
- Languages at home
- 84% English-only · Spanish 9% Other Indo-European 2% German/W. Germanic 1%
Political lean MEDSL · Boulder
- 2024 margin
- Solid D (+55.8) · D 76.5% · R 20.8% · Other 2.7%
- 2008→2024 swing
- +9.6pp toward D · 2008: 46.1pp · 2024: 55.8pp
- All cycles
- 2024: D+55.8 2020: D+56.6 2016: D+48.6 2012: D+41.5 2008: D+46.1
Not yet ingested
- Civics
- —
Market trends
- HPI YoY
- ▼ -1111.31%
- Current HPI
- 324.6478
- Rent YoY
- ▲ 1.82%
- Metro
- Boulder, CO
- State GDP YoY
- ▲ 1.95%
- F500 in state
- 14
Industry mix (Fortune 500 HQ in CO)
| Industry | F500 HQs | Revenue |
|---|---|---|
| Technology Distribution | 1 | $31B |
|
||
| Food / Agriculture | 1 | $18B |
|
||
| Packaging | 1 | $14B |
|
||
| Healthcare | 1 | $13B |
|
||
| Energy | 1 | $10B |
|
||
| Technology | 1 | $4B |
|
||
Price history
1 event — show timeline
- 2026-05-22 Listed $236,700 IRES
Cash-flow waterfall
monthlySold comps — $/sqft
last 12 mo · ≤1 miLoading sold comps…