 Duplex
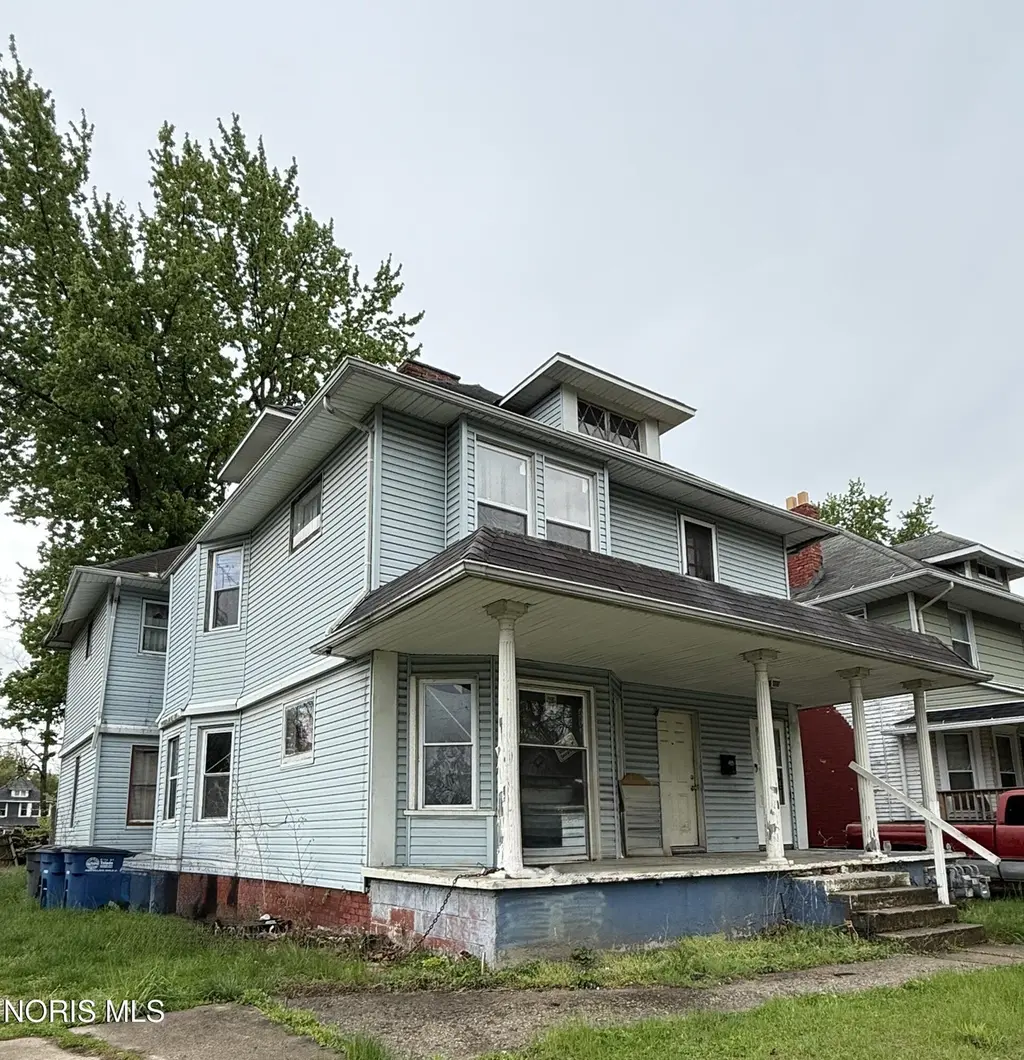
1115 Lincoln Ave · Toledo, OH
Flood risk 1/10 · Minimal
- FEMA flood zone
- X (unshaded)
- Chance of flooding over 30 yrs
- 0.0%
- Est. flood insurance / yr
- $507 – $1,088
Fire risk 1/10 · Minimal
- Est. fire insurance / yr
- $713 – $1,323
Heat risk 3/10 · Minor
- Hot days now (above 101°F)
- 7 days/yr
- Hot days in 30 yrs
- 16 days/yr
Wind risk 2/10 · Minimal
- Chance of severe wind over 30 yrs
- —
Air-quality risk 2/10 · Minimal
- Unhealthy air days now
- 1 days/yr
- Unhealthy air days in 30 yrs
- 3 days/yr
Risk factors via First Street. Map © Google.
Why this score? — see what drove the B+ grade
The composite is a weighted blend of 9 inputs, each scored 0–100. Each bar is that input's sub-score; the figure is the points it added to the 100-point composite (weight × sub-score).
- Cash flow +30.0/30.0
- ARV discount +15.0/15.0
- 1% rule +10.0/10.0
- DSCR +10.0/10.0
- Rent growth +4.5/5.0
- Livability +3.3/5.0
- Condition / age +2.5/5.0
- Schools +1.6/10.0
- Appreciation +0.0/10.0
$59,900
🖨 Deal sheet (PDF) 📄 Offer letter ✓ Due diligence
Multi-family units
County records classify this as Multi-Family (2-4 Unit). Listing-text estimate: 2 units. confirmed
Listing remarks
Up/down duplex on a large lot near the Toledo Museum of Art. Lower unit offers 3 bedrooms, upper unit features 2 bedrooms. Separate utilities already in place. Property includes a large front porch and a mix of basement and crawl space. Being sold as-is to settle an estate and priced for condition, ideal for investors looking for a value-add opportunity. Strong potential for rental or resale with the right improvements.
Key facts
- Separate utilities
- Large front porch
- Large lot
Tags
Property features AI
Finance
- Financial info: Two-unit building (both units currently vacant); Owner pays all utilities
Exterior
- Parking: Driveway
- Utilities: Natural gas available; Public water; Public sewer
- Home design: Duplex residential income property; Two-story
- Construction: Vinyl siding; Combination foundation; Shingle roof; Built year per public records
- Exterior features: Front porch
Interior
- Flooring: Carpet
- Heating & cooling: Heating present (type: Other)
- Interior features: Partial basement; Other interior features
- Laundry & utility: Laundry in basement
Neighborhood map
What this means for you Summary
Snapshot
- This is a 2 × 2-bed/1.0-bath units multifamily listed at $60k.
Deal economics
- At list price, monthly cash flow is $1k ($15k/yr) — positive. Per door: $640/mo.
- The deal already cash-flows at list — no discount required.
- Meets the 1% rule at list price ($2k rent vs $60k).
- Recommended offer: $58k (3.0% below list) — sets the bar for market timing.
- Cap rate 32.0% vs local median 7.7% in Toledo — top-decile yield for the area; either an underpriced asset or a hidden risk that comps aren't pricing in. Stress-test before assuming the spread holds.
Location & tenants
- Location reads 66/100 on livability (#645 in OH) — a middle-class / working-renter tenant base. Strengths: cost of living A+, housing A+, health & safety A+; Watch: amenities C-, crime F, commute F.
- Toledo City (urban): math 15% / reading 24% proficiency, ranked #634 of 656 in OH (top 97%) — low school quality limits family demand, transient renter base, plan for 1-2y turnover; 72% free/reduced lunch — lower-income household profile, screen leases tightly.
- Zoned schools: Robinson Elementary School (math 2% / reading 2%, grade F, #1,580 of 1,584 statewide, top 100%, 358 students, 0% FRL); Jesup W. Scott High School (math 8% / reading 17%, grade F, #726 of 781 statewide, top 94%, 736 students, 0% FRL) — zoned schools average 0% FRL vs 72% district-wide (72 pts lower); this property's tenant base skews higher-income than the district average.
- Zoned-school proficiency averages 7% at this address vs 20% district-wide (-12 pts) — the specific schools serving this property underperform the Toledo City average; the district grade overstates school quality for this exact location.
- Market conditions: Rents rising fast (+8.2%/yr); 85 active listings in the ZIP; lower-income renter base — watch delinquency; 415 units permitted in Lucas County in 2024 (122 in 5+ unit buildings).
- At $2,260/mo this rent would consume 66% of the median local household income ($41k/yr) (locally 1157% of renters already pay >50% of income on rent) — very limited rent-growth headroom before tenants either downsize or default.
Forward outlook
- Local home prices are declining (-3.0%/yr); year-one equity from $414 of loan paydown is wiped out by about $2k of value loss. Plan a longer hold.
- Lucas County population projected at -16% by 2050 — secular population decline; favor cash flow + early exit over multi-decade hold.
- At projected returns (-3.0% appreciation + 8.0% rent growth), your $17k cash investment doubles in ~2 years — after that, you're playing with house money.
Negotiation context
- It's been on market 51 days — a 3% lower offer ($58k) is reasonable based on typical stale-listing flexibility.
Risks & watch-outs
- Watch-outs: property tax is 3.3% of price; built in 1902 — expect roof / HVAC / electrical / plumbing capex.
Questions for the listing agent
- It's been on market 51 days. Have you received any prior offers? Is the seller open to a 3% concession, seller financing, or rate buy-down credit?
- Can we see the unit-by-unit rent roll, current vacancy, and any below-market leases? What's the average tenancy length?
- What capital expenditures (roof, boiler, parking lot, exteriors) have been made in the last 5 years, and what's planned in the next 2?
- Built in 1902 — when were the roof, HVAC, electrical panel, plumbing, and water heater last replaced?
- Property tax is high relative to price — has the assessment been appealed recently, and will the sale trigger a re-assessment?
- Is there a deadline driving the sale (1031 exchange, divorce, estate, relocation)? That informs how much negotiation room exists.
- Schools are D-rated, which usually means shorter tenancies and higher turnover. Who's the typical renter profile here, and what's been the actual vacancy rate?
- Crime grade is F in this area — have there been break-ins, vandalism, or insurance claims at this property in the last 3 years? What carrier currently insures it and at what premium?
- What's the average days-on-market for RENTAL listings here right now (not sales)? A rising rental-DOM trend means longer vacancies and softer asking-rent achievability than the comps imply.
- What's the recent tenant-quality profile in this submarket — average credit score on applications, eviction rate, late-payment / NSF rate, and stable-employment percentage? A property-management company in the area should have these aggregated.
- How much new apartment / multifamily construction is in the pipeline within 1–3 miles? Heavy new supply (>2% of stock underway) typically softens rents 12–24 months out; light construction supports rent growth.
Investment metrics
- 1% rule
- 3.77% ✓
- Cap rate
- 31.95%
- Cash-on-cash
- 91.65%
- DSCR
- 5.08
- GRM
- 2.2
CMA / ARV
- ARV (median comp)
- $94,715
- List price
- $59,900
- Delta
- -36.76%
- Verdict
- UNDERPRICED
- Comps
- 15 within 1.0 mi
Show comp detail 4 sales within ~0.75 mi
| Address | Dist | Beds/Ba | Sqft | Sold | Price | $/sf | Match |
|---|---|---|---|---|---|---|---|
| 1063 Norwood Ave | 0.15mi | 5/2.0 | 2,452 (-5%) | 4mo | $45,000 | $18 | 82 |
| 907 Oakwood Ave | 0.29mi | 4/2.0 (-1) | 2,709 (+5%) | 7mo | $125,000 | $46 | 67 |
| 1118 Oakwood Ave | 0.04mi | 6/2.0 (+1) | 2,888 (+12%) | 12mo | $125,000 | $43 | 63 |
| 2750 Monroe St | 0.45mi | 4/2.0 (-1) | 2,750 (+7%) | 13mo | $140,000 | $51 | 52 |
Match score weights: distance 35% · size 25% · config 20% · recency 20%. Top-matched comps best support the ARV.
Projected returns pro-forma
-3.0% appreciation · 8.0% rent growth · sell at horizon
- IRR
- 98.3%
- Equity multiple
- 6.00×
- Total profit
- $83,911
- Equity at exit
- $8,931
- IRR
- —
- Equity multiple
- 14.88×
- Total profit
- $232,845
- Equity at exit
- $5,179
Cash invested: $16,772 (down + closing). Projections, not guarantees.
Landlord ↔ Tenant lean methodology
- Overall (STATE)
- 73 Landlord-Friendly
- State Ohio
- 73 Landlord-Friendly · R+6
- County
- — inherits STATE
- City
- — inherits STATE
ZIP-level market 43607
- Home prices YoY
- -27.5%
- Rents YoY
- 8.2%
- Active inventory
- 85
- Price-to-rent
- 4.4×
Monthly cashflow live
- Estimated rent
- $2,260 high interval (Pro) →
- Mortgage (P&I)
- −$314
- Tax from tax record
- −$165 /mo · $1,985/yr
- Insurance
- −$25
- HOA
- −$0
- Vacancy / Maint / Mgmt
- −$475
- Net cashflow
- $1,281
Break-even live
Sensitivity live
| Price | -10% $1,315 | -5% $1,298 | +0% $1,281 | +5% $1,264 | +10% $1,247 |
|---|---|---|---|---|---|
| Rent | -10% $1,102 | -5% $1,192 | +0% $1,281 | +5% $1,370 | +10% $1,459 |
| Rate | -1.0pp $1,311 | -0.5pp $1,296 | base $1,281 | +0.5pp $1,265 | +1.0pp $1,250 |
2-unit breakdown (identical units grouped — click to expand)
| Units | Beds | Baths | Est. rent |
|---|---|---|---|
| 2× units | 2 | 1 | $2,260 |
| #1 | 2 | 1 | $1,130 |
| #2 | 2 | 1 | $1,130 |
| Total (2 units) | $2,260 | ||
UW: 25.0% down · 7.5% · 30yr · 1.5% tax · 5.0% vac · 8.0% maint · 8.0% mgmt
Financing live
Cash to close
- Down payment
- $14,975
- Closing costs
- $1,797
- Reserves months
- —
- Total cash needed
- —
Loan-product check · same deal, 3 products live
Conventional
25% down · 7.5% · 30yr
- Down + closing
- —
- Monthly P&I
- —
- Monthly cashflow
- —
- DSCR
- —
- Eligible?
- —
Personal DTI + credit; lowest rate.
DSCR
20% down · 8.5% · 30yr
- Down + closing
- —
- Monthly P&I
- —
- Monthly cashflow
- —
- DSCR
- —
- Eligible?
- —
No personal income docs; deal must DSCR.
Hard money
10% down · 12.0% · 12mo
- Down + closing
- —
- Monthly P&I
- —
- Monthly cashflow
- —
- DSCR
- —
- Eligible?
- —
Short-term bridge; refi at stabilization.
Listing history 18 events
-
2026-06-21days on market $59,900 Active 51 DOM
-
2026-06-18days on market $59,900 Active 48 DOM
-
2026-06-17days on market $59,900 Active 47 DOM
-
2026-06-16days on market $59,900 Active 46 DOM
-
2026-06-15price $59,900 Active 45 DOM
-
2026-06-15days on market $65,000 Active 45 DOM
-
2026-06-14days on market $65,000 Active 43 DOM
-
2026-06-10days on market $65,000 Active 40 DOM
-
2026-06-09days on market $65,000 Active 39 DOM
-
2026-06-08days on market $65,000 Active 38 DOM
-
2026-06-07days on market $65,000 Active 37 DOM
-
2026-06-05days on market $65,000 Active 34 DOM
-
2026-06-03days on market $65,000 Active 33 DOM
-
2026-06-02days on market $65,000 Active 32 DOM
-
2026-06-01days on market $65,000 Active 31 DOM
-
2026-05-31days on market $65,000 Active 30 DOM
-
2026-05-30days on market $65,000 Active 29 DOM
-
2026-05-01$65,000 Active 423-char remark
ⓘ Source: listings_history table (triggers on properties + properties_extension) + one-shot
backfill from property_details.listing_events for pre-trigger history.
Tax reassessment forecast OH · Partial reset (capped growth)
- Current annual tax
- $1,985 · $165/mo
- Projected year-2 tax
- $1,985 · $165/mo
- Expected delta
- $0/yr ($0/mo · 0.0%)
ⓘ Screening estimate from a state-policy table — verify with the county assessor before closing.
Climate risk First Street
- Flood 1/10 Low FEMA zone X (unshaded) · 0% chance over 30 yrs
- Wildfire 1/10 Low
- Heat 3/10 Moderate 7 d/yr ≥101°F today · 16 d/yr by 30 yrs out
- Wind 2/10 Low
- Air quality 2/10 Low 1 unhealthy d/yr today · 3 by 30 yrs out
Nearby sold comps map
Loading sold comps map…
Walkable amenities ~0.75 mi
Loading nearby amenities…
Taxation est. · year 1
- Rental income
- $27,120
- − Mortgage interest
- −$3,355
- − Property taxes
- −$1,985
- − Insurance
- −$300
- − Repairs & maintenance
- −$2,170
- − Management
- −$2,170
- − Depreciation
- −$1,743
- Taxable income
- $15,399
- Est. tax owed @ 24.0%
- −$3,696
- After-tax cash flow
- $11,676/yr
For passive investors: Depreciation is non-cash, so a rental often shows a tax loss while cash-flowing — sheltering income. Rental losses are passive: they offset passive income freely, and up to $25,000/yr can offset ordinary (W-2) income if you actively participate and your MAGI is under $100k (phasing out to $0 by $150k); unused losses carry forward. On sale, claimed depreciation is recaptured at up to 25%, and gains may owe capital-gains tax (a 1031 exchange can defer both). Figures are a year-1 estimate at your 24.0% rate — not tax advice; consult a CPA.
Schools (NCES district)
- District
- Toledo City
- NCES district ID
- 3904490
- Math proficiency
- 15% ▼ -16.00%
- Reading proficiency
- 24% ▼ -13.00%
- Median HH income
- $32,137
- Composite
- 15.76/100
- National rank
- #9276
- State rank
- #634 of 656 in OH
Livability — Toledo
- Score
- 66/100
- State rank
- #645
- US rank
- #11442
Category grades
Schools grade is shown separately in the Schools card above.
Census & demographics
- Census place
- Toledo, OH
- County
- Lucas County · 380,724 people
- City population
- 280,811
- Metro
- Toledo, OH
- Population (ZIP)
- 19,469
- Household income
- $41,335
- Rent vs Own
- Severe rent burden
- 1157.0
Population outlook (Lucas County) Hauer SSP2
- Today (2025)
- 420,751 people
- By 2030
- 410,187 · -2.5%
- By 2040
- 384,019 · -8.7%
- By 2050
- 355,125 · -15.6%
- By 2075
- 291,683 · -30.7%
- By 2100
- 233,670 · -44.5%
Race, ethnicity, and origin ACS 2023
- Neighborhood character
- Diverse neighborhood (Simpson 0.57)
- Race & ethnicity
- Black 59% White 27% Two or more races 6% Hispanic / Latino 6% Asian 3%
- Hispanic origin (detail)
- Mexican 3% Puerto Rican 2%
- Common ancestry
- Lithuanian 2% Romanian 2% Slovak 1%
- Foreign-born
- 4% · Canada
- Languages at home
- 94% English-only · Other Indo-European 1% Spanish 1% Russian/Polish/Slavic 1%
Political lean MEDSL · Lucas
- 2024 margin
- D (+12.6) · D 55.8% · R 43.2%
- 2008→2024 swing
- -18.9pp toward R · 2008: 31.4pp · 2024: 12.6pp
- All cycles
- 2024: D+12.6 2020: D+16.8 2016: D+17.4 2012: D+30.4 2008: D+31.4
Not yet ingested
- Civics
- —
Market trends
- HPI YoY
- ▼ -66.58%
- Current HPI
- 175.2772
- Rent YoY
- ▲ 8.19%
- Metro
- Toledo, OH
- State GDP YoY
- ▲ 1.98%
- F500 in state
- 48
Industry mix (Fortune 500 HQ in OH)
| Industry | F500 HQs | Revenue |
|---|---|---|
| Insurance | 3 | $145B |
|
||
| Industrial Machinery | 3 | $49B |
|
||
| Financial Services | 3 | $24B |
|
||
| Consumer Goods | 2 | $93B |
|
||
| Aerospace / Defense | 2 | $47B |
|
||
| Utilities | 2 | $33B |
|
||
Price history
-7.8% since first listed2 events — show timeline
- 2026-06-15 Price Changed $59,900 NORIS
- 2026-05-01 Listed $65,000 NORIS
Property tax history
+6.4%/yrLatest (2025): $1,985 · +4.3% YoY. Source: county tax records.
Cash-flow waterfall
monthlySold comps — $/sqft
last 12 mo · ≤1 miLoading sold comps…