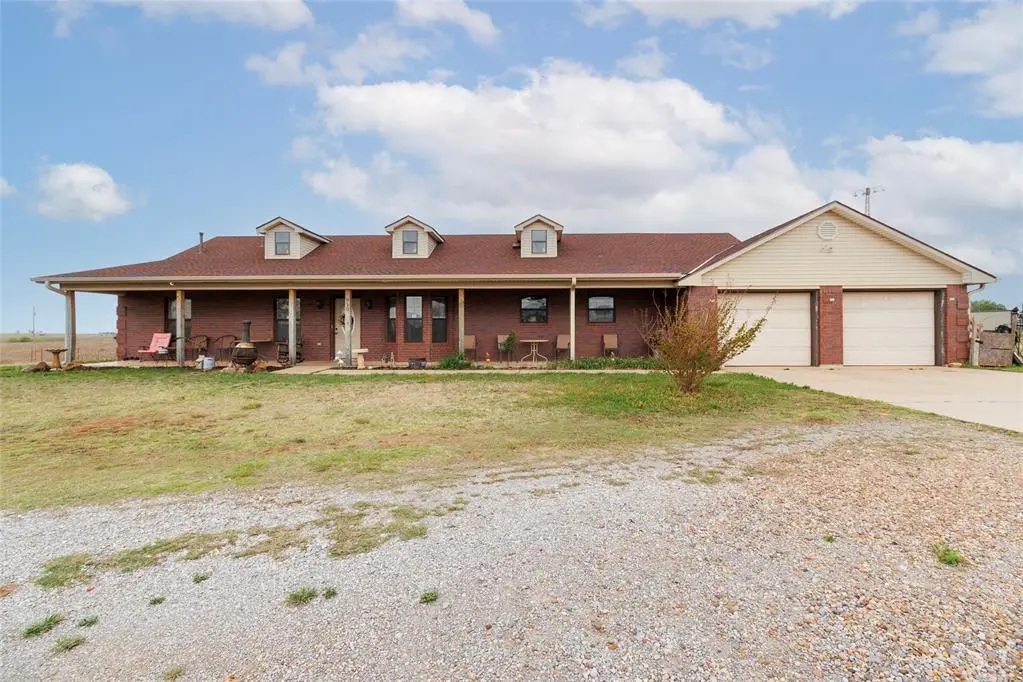
910 1st St · Elgin, OK
Flood risk 1/10 · Minimal
- FEMA flood zone
- X (unshaded)
- Chance of flooding over 30 yrs
- 0.0%
- Est. flood insurance / yr
- $507 – $1,088
Fire risk 8/10 · Major
- Est. fire insurance / yr
- $2,463 – $4,575
Heat risk 6/10 · Moderate
- Hot days now (above 108°F)
- 7 days/yr
- Hot days in 30 yrs
- 19 days/yr
Wind risk 3/10 · Minor
- Chance of severe wind over 30 yrs
- 5.0%
Air-quality risk 1/10 · Minimal
- Unhealthy air days now
- 0 days/yr
- Unhealthy air days in 30 yrs
- 0 days/yr
Risk factors via First Street. Map © Google.
Why this score? — see what drove the C+ grade
The composite is a weighted blend of 9 inputs, each scored 0–100. Each bar is that input's sub-score; the figure is the points it added to the 100-point composite (weight × sub-score).
- Cash flow +17.4/30.0
- ARV discount +15.0/15.0
- Appreciation +10.0/10.0
- DSCR +5.4/10.0
- 1% rule +4.7/10.0
- Livability +3.7/5.0
- Schools +3.0/10.0
- Condition / age +2.8/5.0
- Rent growth +2.5/5.0
$260,000
🖨 Deal sheet 📄 Offer letter ✓ Due diligence
Listing remarks
Welcome to this spacious 5-bedroom, 2-bath home on nearly an acre in Elgin. With over 2,200 square feet and a functional split floor plan, this home offers plenty of room to live comfortably while still feeling warm and inviting. The large living area flows easily into the kitchen and dining spaces, creating a comfortable setup for everyday living and gathering with family and friends. The private primary suite offers a quiet retreat, while the additional bedrooms provide flexibility for family, guests, or a home office. Located in the highly sought-after Elgin School District with convenient access to Lawton/Fort Sill, this property offers the space and setting you’ve been looking fo
Key facts
- 0.99 acre lot
- 2 garage spots
- Built 2007
Property features AI
Finance
- Other: Occupied by owner; Living area reported as 2,208 (source: assessor); Roof year: 2023
- Financial info: Listing terms: Cash, Conventional, FHA or VA acceptable; Not assumable
- HOA & community: No mandatory association dues
Exterior
- Parking: Detached or additional parking areas (concrete and gravel); RV parking; 2-car garage
- Utilities: Aerobic septic system; Electricity available; Natural gas available; Public utilities
- Home design: Single-family residence; One-level; Faces east; Residential property
- Construction: Brick and frame construction with masonry veneer; Shingle roof (replaced/updated 2023); Slab foundation
- Exterior features: Covered patio; Covered porch; Greenhouse; Rain gutters; Metal fencing; Above-ground storm shelter / safe room; Rural lot
Interior
- Kitchen: Gas range (free-standing); Gas oven (free-standing); Dishwasher; Disposal; Microwave; Refrigerator; Water heater
- Bedrooms: 5 bedrooms
- Flooring: Carpet; Tile; Wood
- Bathrooms: 2 full bathrooms
- Heating & cooling: Electric heating
- Interior features: Ceiling fans; Central vacuum; Smoke alarm; Water softener
- Laundry & utility: Inside utility
Neighborhood map
What this means for you Summary
Snapshot
- This is a 5-bed/2.0-bath single-family listed at $260k. Condition is rated average.
Deal economics
- At list price, monthly cash flow is $196 ($2k/yr) — positive.
- The deal already cash-flows at list — no discount required.
- To meet the 1% rule (rent ≥ 1% of price), the offer needs to be $252k (3.0% below list).
- Recommended offer: $252k (3.0% below list) — sets the bar for 1% rule.
- Cap rate 7.2% vs local median 5.1% in Elgin — top-decile yield for the area; either an underpriced asset or a hidden risk that comps aren't pricing in. Stress-test before assuming the spread holds.
Location & tenants
- Location reads 73/100 on livability (#17 in OK) — a middle-class / working-renter tenant base. Strengths: crime A+, housing A+, cost of living A; Watch: amenities F, commute F, health & safety F.
- Elgin (rural): math 29% / reading 36% proficiency, ranked #38 of 270 in OK (top 14%) — families likely to look elsewhere, expect single-tenant / working-renter base with shorter leases.
- Zoned schools: Elgin Es (math 36% / reading 33%, grade F, #168 of 845 statewide, top 24%, 945 students, 0% FRL); Elgin Hs (math 27% / reading 47%, grade F, #42 of 447 statewide, top 10%, 771 students, 0% FRL) — zoned schools average 0% FRL vs 29% district-wide (29 pts lower); this property's tenant base skews higher-income than the district average.
- Market conditions: 95 active listings in the ZIP; 2 comparable units currently listed for rent nearby; solid renter incomes; 133 units permitted in Comanche County in 2024 (0 in 5+ unit buildings).
- This rent runs 33% of the median local income ($91k/yr) — at the standard rent-burdened threshold; future hikes will face affordability resistance.
Forward outlook
- In year one you build about $28k of equity ($2k loan paydown + $26k appreciation (10.0% local appreciation)).
- Comanche County population projected to shrink 3% by 2050 — rents likely to lag national; underwrite the cash flow, not the appreciation.
- At projected returns (10.0% appreciation + 3.0% rent growth), your $73k cash investment doubles in ~3 years — after that, you're playing with house money.
- By year 2, paydown + projected appreciation supports a ~$45k cash-out refi (75% LTV) — recoverable capital for the next deal without selling this one.
Negotiation context
- Only 13 days on market — expect competitive offers; lowballing is unlikely to land.
- 2 sale attempts since 2y ago with the ask held roughly flat each time — persistent listings suggest the price (not the market) is what's stuck; bring a comps-based counter.
Risks & watch-outs
- Climate carrying-cost: severe wildfire risk; extreme-heat days projected 7→19/yr by 2055 (HVAC capex compounding) — expect insurance premiums to compound above CPI over the hold.
Questions for the listing agent
- Is there a deadline driving the sale (1031 exchange, divorce, estate, relocation)? That informs how much negotiation room exists.
- What's the average days-on-market for RENTAL listings here right now (not sales)? A rising rental-DOM trend means longer vacancies and softer asking-rent achievability than the comps imply.
- What's the recent tenant-quality profile in this submarket — average credit score on applications, eviction rate, late-payment / NSF rate, and stable-employment percentage? A property-management company in the area should have these aggregated.
- How much new for-sale + rental construction is in the pipeline within 1–3 miles? Heavy new supply typically softens prices + rents 12–24 months out; constrained supply supports both.
Investment metrics
- 1% rule
- 0.97% ✗
- Cap rate
- 7.20%
- Cash-on-cash
- 3.23%
- DSCR
- 1.14
- GRM
- 8.6
CMA / ARV
- ARV (on-the-fly)
- $340,032
- Comps found
- 12
Show comp detail 12 sales within ~0.75 mi
| Address | Dist | Beds/Ba | Sqft | Sold | Price | $/sf | Match |
|---|---|---|---|---|---|---|---|
| 906 4th St | 0.24mi | 5/2.5 | 2,300 (+4%) | 4mo | $379,500 | $165 | 77 |
| 12568 Pinnacle Ln | 0.39mi | 4/2.0 (-1) | 2,200 (-0%) | 1mo | $400,000 | $182 | 75 |
| 1204 Brandi Dr | 0.31mi | 4/2.0 (-1) | 2,120 (-4%) | 11mo | $290,000 | $137 | 65 |
| 1110 Apple Creek Dr | 0.29mi | 4/2.0 (-1) | 1,900 (-14%) | 2mo | $299,000 | $157 | 56 |
| 12872 NE Keeney Rd | 0.63mi | 4/2.5 (-1) | 2,313 (+5%) | 0mo | $315,000 | $136 | 56 |
| 1214 2nd Pl | 0.37mi | 5/2.5 | 2,100 (-5%) | 23mo | $210,000 | $100 | 53 |
| 1314 Saddle Rock Dr | 0.50mi | 4/2.0 (-1) | 1,900 (-14%) | 13mo | $289,000 | $152 | 38 |
| 1412 Limestone Way | 0.60mi | 4/2.0 (-1) | 1,900 (-14%) | 13mo | $285,000 | $150 | 33 |
| 1521 NE Scenic Rdg | 0.72mi | 4/2.0 (-1) | 2,050 (-7%) | 21mo | $315,000 | $154 | 32 |
| 1315 Saddlerock Dr | 0.54mi | 4/2.0 (-1) | 1,900 (-14%) | 21mo | $285,000 | $150 | 30 |
| 1604 NE White Rock Dr | 0.67mi | 4/2.0 (-1) | 1,920 (-13%) | 17mo | $300,000 | $156 | 28 |
| 1408 NE Scenic Rdg | 0.64mi | 4/2.0 (-1) | 1,900 (-14%) | 19mo | $305,000 | $161 | 26 |
Match score weights: distance 35% · size 25% · config 20% · recency 20%. Top-matched comps best support the ARV.
Projected returns pro-forma
10.0% appreciation · 3.0% rent growth · sell at horizon
- IRR
- 26.6%
- Equity multiple
- 3.12×
- Total profit
- $154,132
- Equity at exit
- $234,229
- IRR
- 23.3%
- Equity multiple
- 7.10×
- Total profit
- $444,145
- Equity at exit
- $505,123
Cash invested: $72,800 (down + closing). Projections, not guarantees.
Landlord ↔ Tenant lean methodology
- Overall (STATE)
- 83 Strongly Landlord-Friendly
- State Oklahoma
- 83 Strongly Landlord-Friendly · R+20
- County
- — inherits STATE
- City
- — inherits STATE
ZIP-level market 73538
- Home prices YoY
- 22.9%
- Active inventory
- 95
- Price-to-rent
- 8.6×
Monthly cashflow live
- Estimated rent
- $2,523 medium interval (Pro) →
- Mortgage (P&I)
- −$1,363
- Tax est. 1.5%
- −$325 /mo · $3,900/yr
- Insurance
- −$108
- HOA
- −$0
- Vacancy / Maint / Mgmt
- −$530
- Net cashflow
- $196
Break-even live
UW: 25.0% down · 7.5% · 30yr · 1.5% tax · 5.0% vac · 8.0% maint · 8.0% mgmt
Financing live
Cash to close
- Down payment
- $65,000
- Closing costs
- $7,800
- Reserves months
- —
- Total cash needed
- —
Loan-product check · same deal, 3 products live
Conventional
25% down · 7.5% · 30yr
- Down + closing
- —
- Monthly P&I
- —
- Monthly cashflow
- —
- DSCR
- —
- Eligible?
- —
Personal DTI + credit; lowest rate.
DSCR
20% down · 8.5% · 30yr
- Down + closing
- —
- Monthly P&I
- —
- Monthly cashflow
- —
- DSCR
- —
- Eligible?
- —
No personal income docs; deal must DSCR.
Hard money
10% down · 12.0% · 12mo
- Down + closing
- —
- Monthly P&I
- —
- Monthly cashflow
- —
- DSCR
- —
- Eligible?
- —
Short-term bridge; refi at stabilization.
Rent comps 2 comps
| Address | Beds | Baths | Sqft | Rent | $/sqft | DOM | Units | Dist |
|---|---|---|---|---|---|---|---|---|
| 1205 Alma Dr Elgin, OK | 4.0 | 2.0 | 1800 | $1,900 | $1.06 | 12d | 1 | 0.31mi |
| 1517 Stonehouse Dr Elgin, OK | 4.0 | 2.0 | 1565 | $1,700 | $1.09 | 21d | 1 | 0.59mi |
Listing history 9 events
-
2026-06-02status $260,000 Pending 13 DOM
-
2026-06-01days on market $260,000 Active 13 DOM
-
2026-05-31days on market $260,000 Active 12 DOM
-
2026-05-30days on market $260,000 Active 11 DOM
-
2026-05-15$260,000 Active
-
2025-02-27price $275,000
-
2024-10-22price $300,000
-
2024-10-03price $450,000
-
2024-08-19$750,000 Active
ⓘ Source: listings_history table (triggers on properties + properties_extension) + one-shot
backfill from property_details.listing_events for pre-trigger history.
Climate risk First Street
- Flood 1/10 Low FEMA zone X (unshaded) · 0% chance over 30 yrs
- Wildfire 8/10 Severe
- Heat 6/10 Major 7 d/yr ≥108°F today · 19 d/yr by 30 yrs out
- Wind 3/10 Moderate 5% chance of damaging wind over 30 yrs
- Air quality 1/10 Low 0 unhealthy d/yr today · 0 by 30 yrs out
Nearby sold comps map
Loading sold comps map…
Walkable amenities ~0.75 mi
Loading nearby amenities…
Taxation est. · year 1
- Rental income
- $30,272
- − Mortgage interest
- −$14,564
- − Property taxes
- −$3,900
- − Insurance
- −$1,300
- − Repairs & maintenance
- −$2,422
- − Management
- −$2,422
- − Depreciation
- −$7,564
- Taxable loss
- −$1,899
- Est. tax savings @ 24.0%
- +$456
- After-tax cash flow
- $2,809/yr
For passive investors: Depreciation is non-cash, so a rental often shows a tax loss while cash-flowing — sheltering income. Rental losses are passive: they offset passive income freely, and up to $25,000/yr can offset ordinary (W-2) income if you actively participate and your MAGI is under $100k (phasing out to $0 by $150k); unused losses carry forward. On sale, claimed depreciation is recaptured at up to 25%, and gains may owe capital-gains tax (a 1031 exchange can defer both). Figures are a year-1 estimate at your 24.0% rate — not tax advice; consult a CPA.
Condition & rehab AI · 12 photos
This home is in average condition with moderate rehab needed. It has a spacious floor plan and is located in a desirable area, but it needs fresh paint and landscaping to increase its value.
Repairs flagged
- Major paint — paint appears worn and needs touch-up
- Major landscaping — bare yard, no landscaping
Value-add opportunities
- Resale paint — Fresh paint can make a home more appealing
- Rental landscaping — Landscaping can increase curb appeal and attract tenants
Renovation cost estimate screening
| Repair item | Severity | Est. cost |
|---|---|---|
| paint · paint appears worn and needs touch-up | Major | $15,000–50,000 |
| landscaping · bare yard, no landscaping | Major | $15,000–50,000 |
| Total estimated repair cost · 2 items | $30,000–100,000 |
Value-add ROI direction
- Resale paint — Fresh paint can make a home more appealing ↑
- Rental landscaping — Landscaping can increase curb appeal and attract tenants ↑
ⓘ Cost ranges are severity-bucket heuristics (US national rule-of-thumb). Get contractor quotes + a written scope before underwriting a rehab budget.
Schools (NCES district)
- District
- Elgin
- NCES district ID
- 4010710
- Math proficiency
- 29% ▼ -9.00%
- Reading proficiency
- 36% ▼ -5.00%
- Median HH income
- $65,900
- Composite
- 29.77/100
- National rank
- #6432
- State rank
- #38 of 270 in OK
Livability — Elgin
- Score
- 73/100
- State rank
- #17
- US rank
- #5411
Category grades
Schools grade is shown separately in the Schools card above.
Census & demographics
- County
- Comanche County · 96,361 people
- City population
- 7,128
- Metro
- Lawton, OK
- Population (ZIP)
- 7,128
- Household income
- $91,324
- Rent vs Own
- Severe rent burden
- 70.0
Population outlook (Comanche County) Hauer SSP2
- Today (2025)
- 124,518 people
- By 2030
- 124,231 · -0.2%
- By 2040
- 122,193 · -1.9%
- By 2050
- 120,368 · -3.3%
- By 2075
- 120,492 · -3.2%
- By 2100
- 123,113 · -1.1%
Race, ethnicity, and origin ACS 2023
- Neighborhood character
- Predominantly White (71%)
- Race & ethnicity
- White 71% Two or more races 15% Hispanic / Latino 13% Native American 4% Black 2% Asian 1%
- Hispanic origin (detail)
- Mexican 11% Puerto Rican 2%
- Common ancestry
- Slovak 5% Romanian 2% Serbian 1%
- Foreign-born
- 3% · Canada
- Languages at home
- 93% English-only · Spanish 4% German/W. Germanic 1%
Political lean MEDSL · Comanche
- 2024 margin
- Strong R (+23.3) · D 37.4% · R 60.7% · Other 1.9%
- 2008→2024 swing
- -5.8pp toward R · 2008: -17.5pp · 2024: -23.3pp
- All cycles
- 2024: R+23.3 2020: R+20.1 2016: R+23.7 2012: R+17.0 2008: R+17.5
Not yet ingested
- Civics
- —
Market trends
- HPI YoY
- ▲ 45.70%
- Current HPI
- 245.4249
- Rent YoY
- —
- Metro
- Lawton, OK
- State GDP YoY
- ▲ 1.55%
- F500 in state
- 6
Industry mix (Fortune 500 HQ in OK)
| Industry | F500 HQs | Revenue |
|---|---|---|
| Energy | 3 | $48B |
|
||
Price history
-65.3% since first listed5 events — show timeline
- 2026-05-15 Listed $260,000 MLSOK
- 2025-02-27 Price Changed $275,000 LBRMLS
- 2024-10-22 Price Changed $300,000 LBRMLS
- 2024-10-03 Price Changed $450,000 LBRMLS
- 2024-08-19 Listed $750,000 LBRMLS
Cash-flow waterfall
monthlySold comps — $/sqft
last 12 mo · ≤1 miLoading sold comps…