 🏗️ New Construction
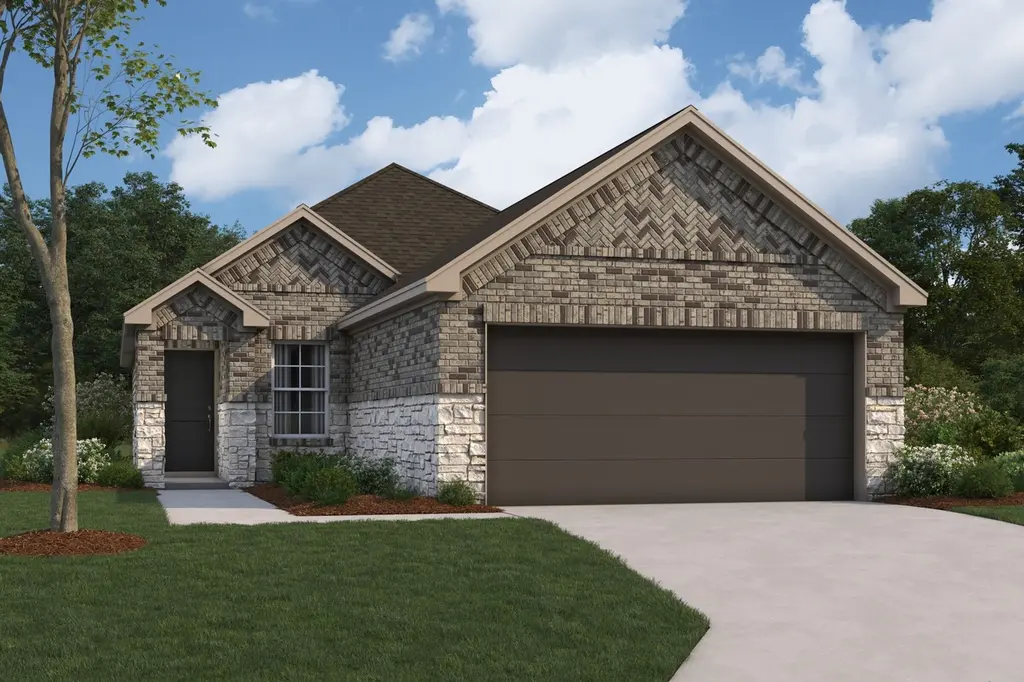
Primrose Plan · Fulshear, TX
Flood risk 1/10 · Minimal
- FEMA flood zone
- X (unshaded)
- Chance of flooding over 30 yrs
- 0.0%
- Est. flood insurance / yr
- $507 – $1,088
Fire risk 4/10 · Minor
- Est. fire insurance / yr
- $1,222 – $2,270
Heat risk 8/10 · Major
- Hot days now (above 110°F)
- 7 days/yr
- Hot days in 30 yrs
- 19 days/yr
Wind risk 9/10 · Severe
- Chance of severe wind over 30 yrs
- 99.0%
Air-quality risk 2/10 · Minimal
- Unhealthy air days now
- 1 days/yr
- Unhealthy air days in 30 yrs
- 1 days/yr
Risk factors via First Street. Map © Google.
Why this score? — see what drove the D- grade
The composite is a weighted blend of 9 inputs, each scored 0–100. Each bar is that input's sub-score; the figure is the points it added to the 100-point composite (weight × sub-score).
- Cash flow +8.8/30.0
- ARV discount +7.5/15.0
- Schools +4.6/10.0
- Condition / age +4.0/5.0
- Livability +3.5/5.0
- 1% rule +2.7/10.0
- DSCR +2.4/10.0
- Rent growth +2.1/5.0
- Appreciation +0.0/10.0
$270,490
🖨 Deal sheet (PDF) 📄 Offer letter ✓ Due diligence
Listing remarks MLS
Welcome to the Primrose, a charming one-story home offering between 1,295 and 1,342 square feet of functional living space, with 3 bedrooms, 2 bathrooms, and an option for a 2- or 3-car garage.
Key facts
- 2 garage spots
- Listed 963 days
Neighborhood map
What this means for you Summary
Snapshot
- This is a 3-bed/2.0-bath single-family listed at $270k. Condition is rated good.
Deal economics
- At list price, monthly cash flow is $-240 ($-3k/yr) — negative.
- To cash-flow at today's rent, offer at most $260k (4.0% below list).
- To meet the 1% rule (rent ≥ 1% of price), the offer needs to be $227k (16.0% below list).
- Recommended offer: $227k (16.0% below list) — sets the bar for 1% rule.
- Cap rate 5.3% vs local median 3.2% in Fulshear — top-decile yield for the area; either an underpriced asset or a hidden risk that comps aren't pricing in. Stress-test before assuming the spread holds.
Location & tenants
- Location reads 69/100 on livability (#430 in TX) — a middle-class / working-renter tenant base. Strengths: crime A+, employment A+, housing A+; Watch: amenities F, commute F, cost of living F.
- Lamar CISD (suburban): math 50% / reading 53% proficiency, ranked #116 of 826 in TX (top 14%) — acceptable for families but not a draw, mixed tenant base, ~2y average lease.
- Zoned schools: Huggins El (math 61% / reading 63%, grade B, #321 of 4,322 statewide, top 8%, 893 students, 23% FRL); Briscoe J H (math 59% / reading 60%, grade B, #166 of 1,662 statewide, top 11%, 1,914 students, 38% FRL); Foster H S (math 64% / reading 74%, grade B, #141 of 1,632 statewide, top 9%, 2,388 students, 34% FRL).
- Zoned-school proficiency averages 64% at this address vs 52% district-wide (+12 pts) — the actual schools serving this property are materially stronger than the Lamar CISD average implies; a family-tenant draw the district grade alone would hide.
- Market conditions: Rents soft (-1.6%/yr); 1242 active listings in the ZIP; 1 comparable units currently listed for rent nearby; high-income renter base; 12,093 units permitted in Fort Bend County in 2024 (815 in 5+ unit buildings).
- This rent is only 15% of the median local income ($184k/yr) — well below the 30% rent-burden line; pricing power to push rent on renewal without tenant pushback.
Forward outlook
- Local home prices are declining (-3.0%/yr); year-one equity from $2k of loan paydown is wiped out by about $9k of value loss. Plan a longer hold.
- Fort Bend County population projected at +75% by 2050 — long-run rental-demand tailwind backs the buy-and-hold thesis.
Negotiation context
- It's been on market 963 days — a 12% lower offer ($238k) is reasonable based on typical stale-listing flexibility.
Risks & watch-outs
- Climate carrying-cost: severe wind risk, 99% chance of damaging wind over 30y; extreme-heat days projected 7→19/yr by 2055 (HVAC capex compounding) — expect insurance premiums to compound above CPI over the hold.
Questions for the listing agent
- What do current leases actually rent for vs. the listed asking? Can we see a recent rent roll and the last 12 months of T-12 income?
- It's been on market 963 days. Have you received any prior offers? Is the seller open to a 16% concession, seller financing, or rate buy-down credit?
- Why hasn't it sold? Are there any deal-killer items the seller is aware of (foundation, flood, title, zoning, code violations)?
- Is there a deadline driving the sale (1031 exchange, divorce, estate, relocation)? That informs how much negotiation room exists.
- Schools are A-rated — typically a magnet for longer-tenancy family renters. What's the average tenant stay here, and is there a school-zone premium baked into asking?
- The area grade is low — what's the realistic commute time and amenity access for the typical tenant pool here? Any planned neighborhood developments (good or bad) we should know about?
- What's the average days-on-market for RENTAL listings here right now (not sales)? A rising rental-DOM trend means longer vacancies and softer asking-rent achievability than the comps imply.
- What's the recent tenant-quality profile in this submarket — average credit score on applications, eviction rate, late-payment / NSF rate, and stable-employment percentage? A property-management company in the area should have these aggregated.
- How much new for-sale + rental construction is in the pipeline within 1–3 miles? Heavy new supply typically softens prices + rents 12–24 months out; constrained supply supports both.
Investment metrics
- 1% rule
- 0.77% ✗
- Cap rate
- 5.31%
- Cash-on-cash
- -3.49%
- DSCR
- 0.84
- GRM
- 10.8
CMA / ARV
- ARV (median comp)
- $294,515
- List price
- $270,490
- Delta
- -8.16%
- Verdict
- FAIR
- Comps
- 20 within 1.0 mi
Show comp detail 10 sales within ~0.75 mi
| Address | Dist | Beds/Ba | Sqft | Sold | Price | $/sf | Match |
|---|---|---|---|---|---|---|---|
| 5815 Sunrise Bottom Ln | 0.06mi | 3/2.0 | 1,340 (+4%) | 8mo | $264,990 | $198 | 85 |
| 5834 Dawning Sun St | 0.17mi | 3/2.0 | 1,330 (+3%) | 15mo | $279,990 | $211 | 75 |
| 5803 Sunrise Bottom Ln | 0.04mi | 3/2.0 | 1,451 (+12%) | 13mo | $304,990 | $210 | 67 |
| 32615 Orchard Haze Dr | 0.68mi | 4/2.0 (+1) | 1,307 (+1%) | 11mo | $239,000 | $183 | 52 |
| 32702 Orchard Haze Dr | 0.73mi | 3/2.0 | 1,255 (-3%) | 13mo | $240,000 | $191 | 50 |
| 32723 Orchard Haze Dr | 0.74mi | 4/2.0 (+1) | 1,310 (+1%) | 10mo | $235,000 | $179 | 50 |
| 32715 Orchard Haze Dr | 0.73mi | 3/2.0 | 1,255 (-3%) | 14mo | $240,000 | $191 | 49 |
| 32619 Orchard Haze Dr | 0.69mi | 3/2.0 | 1,255 (-3%) | 19mo | $239,000 | $190 | 47 |
| 5451 Grand View Dr | 0.54mi | 3/2.0 | 1,422 (+10%) | 18mo | $254,900 | $179 | 44 |
| 32727 Dew Crest Ln | 0.74mi | 4/2.0 (+1) | 1,307 (+1%) | 19mo | $249,000 | $191 | 43 |
Match score weights: distance 35% · size 25% · config 20% · recency 20%. Top-matched comps best support the ARV.
Projected returns pro-forma
-3.0% appreciation · 0.0% rent growth · sell at horizon
- IRR
- -25.5%
- Equity multiple
- 0.16×
- Total profit
- $-69,642
- Equity at exit
- $43,913
- IRR
- -35.2%
- Equity multiple
- -0.28×
- Total profit
- $-105,931
- Equity at exit
- $25,464
Cash invested: $82,464 (down + closing). Projections, not guarantees.
Landlord ↔ Tenant lean methodology
- Overall (STATE)
- 87 Strongly Landlord-Friendly
- State Texas
- 87 Strongly Landlord-Friendly · R+5
- County
- — inherits STATE
- City
- — inherits STATE
ZIP-level market 77441
- Rents YoY
- -1.6%
- Active inventory
- 1242
- Price-to-rent
- 9.9×
Monthly cashflow live
- Estimated rent
- $2,272 medium interval (Pro) →
- Mortgage (P&I)
- −$1,544
- Tax est. 1.5%
- −$368 /mo · $4,418/yr
- Insurance
- −$123
- HOA
- −$0
- Vacancy / Maint / Mgmt
- −$477
- Net cashflow
- $-240
Break-even live
Sensitivity live
| Price | -10% $-37 | -5% $-138 | +0% $-240 | +5% $-342 | +10% $-444 |
|---|---|---|---|---|---|
| Rent | -10% $-420 | -5% $-330 | +0% $-240 | +5% $-150 | +10% $-61 |
| Rate | -1.0pp $-92 | -0.5pp $-165 | base $-240 | +0.5pp $-316 | +1.0pp $-394 |
UW: 25.0% down · 7.5% · 30yr · 1.5% tax · 5.0% vac · 8.0% maint · 8.0% mgmt
Financing live
Cash to close
- Down payment
- $73,629
- Closing costs
- $8,835
- Reserves months
- —
- Total cash needed
- —
Loan-product check · same deal, 3 products live
Conventional
25% down · 7.5% · 30yr
- Down + closing
- —
- Monthly P&I
- —
- Monthly cashflow
- —
- DSCR
- —
- Eligible?
- —
Personal DTI + credit; lowest rate.
DSCR
20% down · 8.5% · 30yr
- Down + closing
- —
- Monthly P&I
- —
- Monthly cashflow
- —
- DSCR
- —
- Eligible?
- —
No personal income docs; deal must DSCR.
Hard money
10% down · 12.0% · 12mo
- Down + closing
- —
- Monthly P&I
- —
- Monthly cashflow
- —
- DSCR
- —
- Eligible?
- —
Short-term bridge; refi at stabilization.
Rent comps 1 comps
| Address | Beds | Baths | Sqft | Rent | $/sqft | DOM | Units | Dist |
|---|---|---|---|---|---|---|---|---|
| 31419 Horseshoe Meadow Bend Ln Fulshear, TX | 3.0 | 2.0 | 1588 | $2,100 | $1.32 | 45d | 1 | 1.41mi |
Listing history 23 events
-
2026-06-21days on market $270,490 Active 963 DOM
-
2026-06-18days on market $270,490 Active 960 DOM
-
2026-06-17days on market $270,490 Active 959 DOM
-
2026-06-16days on market $270,490 Active 958 DOM
-
2026-06-15days on market $270,490 Active 957 DOM
-
2026-06-13days on market $270,490 Active 955 DOM
-
2026-06-10days on market $270,490 Active 951 DOM
-
2026-06-08days on market $270,490 Active 950 DOM
-
2026-06-07days on market $270,490 Active 949 DOM
-
2026-06-04days on market $270,490 Active 946 DOM
-
2026-06-03days on market $270,490 Active 945 DOM
-
2026-06-02days on market $270,490 Active 944 DOM
-
2026-06-01days on market $270,490 Active 943 DOM
-
2026-05-31days on market $270,490 Active 942 DOM
-
2025-08-12price $270,490 193-char remark
Show marketing remark (193 chars)
Welcome to the Primrose, a charming one-story home offering between 1,295 and 1,342 square feet of functional living space, with 3 bedrooms, 2 bathrooms, and an option for a 2- or 3-car garage.
-
2025-08-12price $279,490 193-char remark
Show marketing remark (193 chars)
Welcome to the Primrose, a charming one-story home offering between 1,295 and 1,342 square feet of functional living space, with 3 bedrooms, 2 bathrooms, and an option for a 2- or 3-car garage.
-
2025-07-02price $270,490 193-char remark
Show marketing remark (193 chars)
Welcome to the Primrose, a charming one-story home offering between 1,295 and 1,342 square feet of functional living space, with 3 bedrooms, 2 bathrooms, and an option for a 2- or 3-car garage.
-
2025-03-08price $280,490 193-char remark
Show marketing remark (193 chars)
Welcome to the Primrose, a charming one-story home offering between 1,295 and 1,342 square feet of functional living space, with 3 bedrooms, 2 bathrooms, and an option for a 2- or 3-car garage.
-
2025-01-17price $279,740 193-char remark
Show marketing remark (193 chars)
Welcome to the Primrose, a charming one-story home offering between 1,295 and 1,342 square feet of functional living space, with 3 bedrooms, 2 bathrooms, and an option for a 2- or 3-car garage.
-
2024-07-18price $278,490 193-char remark
Show marketing remark (193 chars)
Welcome to the Primrose, a charming one-story home offering between 1,295 and 1,342 square feet of functional living space, with 3 bedrooms, 2 bathrooms, and an option for a 2- or 3-car garage.
-
2024-04-02price $277,490 193-char remark
Show marketing remark (193 chars)
Welcome to the Primrose, a charming one-story home offering between 1,295 and 1,342 square feet of functional living space, with 3 bedrooms, 2 bathrooms, and an option for a 2- or 3-car garage.
-
2024-02-10price $274,490 193-char remark
Show marketing remark (193 chars)
Welcome to the Primrose, a charming one-story home offering between 1,295 and 1,342 square feet of functional living space, with 3 bedrooms, 2 bathrooms, and an option for a 2- or 3-car garage.
-
2023-11-01$273,490 Active 193-char remark
Show marketing remark (193 chars)
Welcome to the Primrose, a charming one-story home offering between 1,295 and 1,342 square feet of functional living space, with 3 bedrooms, 2 bathrooms, and an option for a 2- or 3-car garage.
ⓘ Source: listings_history table (triggers on properties + properties_extension) + one-shot
backfill from property_details.listing_events for pre-trigger history.
Climate risk First Street
- Flood 1/10 Low FEMA zone X (unshaded) · 0% chance over 30 yrs
- Wildfire 4/10 Moderate
- Heat 8/10 Severe 7 d/yr ≥110°F today · 19 d/yr by 30 yrs out
- Wind 9/10 Extreme 99% chance of damaging wind over 30 yrs
- Air quality 2/10 Low 1 unhealthy d/yr today · 1 by 30 yrs out
Nearby sold comps map
Loading sold comps map…
Walkable amenities ~0.75 mi
Loading nearby amenities…
Taxation est. · year 1
- Rental income
- $27,269
- − Mortgage interest
- −$16,497
- − Property taxes
- −$4,418
- − Insurance
- −$1,473
- − Repairs & maintenance
- −$2,182
- − Management
- −$2,182
- − Depreciation
- −$8,568
- Taxable loss
- −$8,049
- Est. tax savings @ 24.0%
- +$1,932
- After-tax cash flow
- $-949/yr
For passive investors: Depreciation is non-cash, so a rental often shows a tax loss while cash-flowing — sheltering income. Rental losses are passive: they offset passive income freely, and up to $25,000/yr can offset ordinary (W-2) income if you actively participate and your MAGI is under $100k (phasing out to $0 by $150k); unused losses carry forward. On sale, claimed depreciation is recaptured at up to 25%, and gains may owe capital-gains tax (a 1031 exchange can defer both). Figures are a year-1 estimate at your 24.0% rate — not tax advice; consult a CPA.
Condition & rehab AI · 12 photos
This single-story home is in good condition with a good exterior and interior. It has a good layout and modern finishes, making it a good candidate for a cosmetic renovation to enhance its curb appeal and rental value.
Value-add opportunities
- Both Painting exterior stone — Enhances curb appeal and value
- Both Landscaping — Improves curb appeal and rental appeal
- Both New flooring in bathrooms — Modernizes spaces and improves rental appeal
Renovation cost estimate screening
Value-add ROI direction
- Both Painting exterior stone — Enhances curb appeal and value ↑
- Both Landscaping — Improves curb appeal and rental appeal ↑
- Both New flooring in bathrooms — Modernizes spaces and improves rental appeal ↑
ⓘ Cost ranges are severity-bucket heuristics (US national rule-of-thumb). Get contractor quotes + a written scope before underwriting a rehab budget.
Schools (NCES district)
- District
- Lamar CISD
- NCES district ID
- 4826580
- Math proficiency
- 50% ▼ -12.00%
- Reading proficiency
- 53% ▼ -4.00%
- Median HH income
- $75,213
- Composite
- 46.43/100
- National rank
- #2452
- State rank
- #116 of 826 in TX
Livability — Fulshear
- Score
- 69/100
- State rank
- #430
- US rank
- #8901
Category grades
Schools grade is shown separately in the Schools card above.
Census & demographics
- County
- Fort Bend County · 836,777 people
- City population
- 41,324
- Metro
- Houston-The Woodlands-Sugar Land, TX
- Population (ZIP)
- 41,324
- Household income
- $184,390
- Rent vs Own
- Severe rent burden
- 301.0
Population outlook (Fort Bend County) Hauer SSP2
- Today (2025)
- 1,004,526 people
- By 2030
- 1,153,104 · +14.8%
- By 2040
- 1,453,718 · +44.7%
- By 2050
- 1,753,781 · +74.6%
- By 2075
- 2,455,772 · +144.5%
- By 2100
- 2,930,528 · +191.7%
Race, ethnicity, and origin ACS 2023
- Neighborhood character
- Diverse neighborhood (Simpson 0.62)
- Race & ethnicity
- White 57% Hispanic / Latino 20% Two or more races 15% Asian 12% Black 6%
- Hispanic origin (detail)
- Mexican 10%
- Common ancestry
- Lithuanian 5% Romanian 2% Italian 1%
- Foreign-born
- 26% · Canada, China, Jamaica
- Languages at home
- 68% English-only · Spanish 17% German/W. Germanic 4% Chinese 4%
Political lean MEDSL · Fort Bend
- 2024 margin
- Toss-up / Even · D 49.5% · R 47.9% · Other 2.6%
- 2008→2024 swing
- +4.0pp toward D · 2008: -2.4pp · 2024: 1.6pp
- All cycles
- 2024: D+1.6 2020: D+10.6 2016: D+6.6 2012: R+6.8 2008: R+2.4
Not yet ingested
- Civics
- —
Market trends
- HPI YoY
- ▼ -154.74%
- Current HPI
- 275.8798
- Rent YoY
- ▼ -1.63%
- Metro
- Houston-The Woodlands-Sugar Land, TX
- State GDP YoY
- ▲ 3.95%
- F500 in state
- 110
Industry mix (Fortune 500 HQ in TX)
| Industry | F500 HQs | Revenue |
|---|---|---|
| Energy | 16 | $1,198B |
|
||
| Technology | 5 | $198B |
|
||
| Engineering / Construction | 4 | $72B |
|
||
| Energy Services | 3 | $60B |
|
||
| Utilities | 3 | $41B |
|
||
| Healthcare | 2 | $330B |
|
||
Price history
-1.1% since first listed9 events — show timeline
- 2025-08-12 Price Changed $270,490 Zillow
- 2025-08-12 Price Changed $279,490 Zillow
- 2025-07-02 Price Changed $270,490 Zillow
- 2025-03-08 Price Changed $280,490 Zillow
- 2025-01-17 Price Changed $279,740 Zillow
- 2024-07-18 Price Changed $278,490 Zillow
- 2024-04-02 Price Changed $277,490 Zillow
- 2024-02-10 Price Changed $274,490 Zillow
- 2023-11-01 Listed $273,490 Zillow
Cash-flow waterfall
monthlySold comps — $/sqft
last 12 mo · ≤1 miLoading sold comps…