 🏷️ Likely Rental
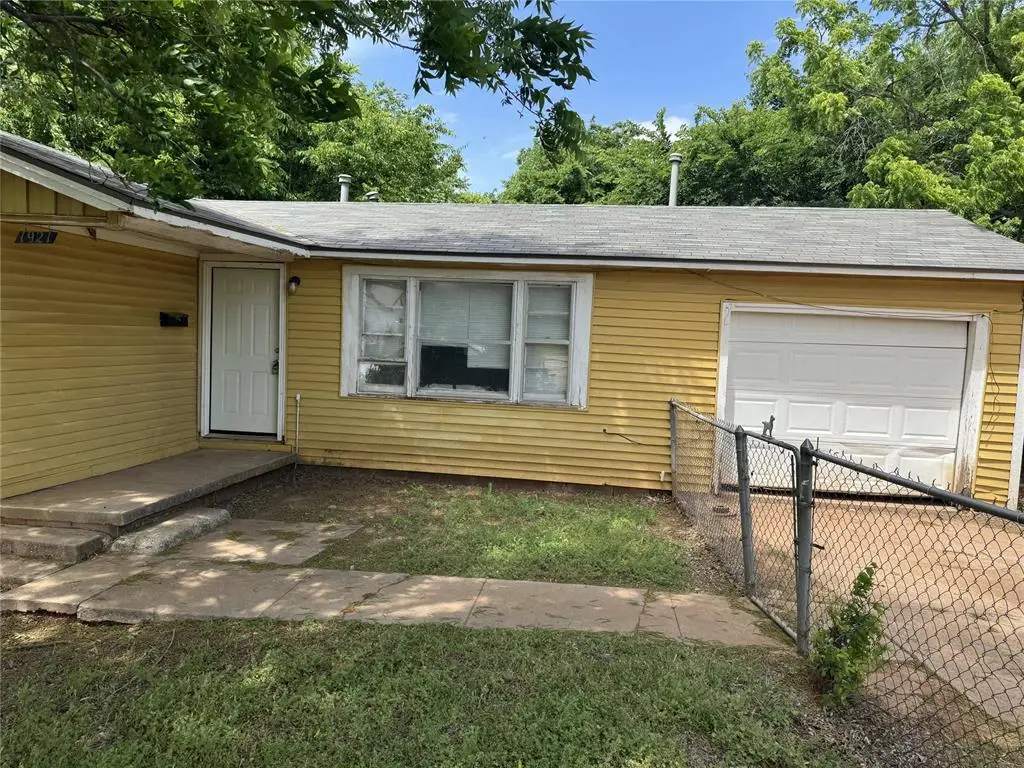
1921 N Vine St · Oklahoma City, OK
Flood risk 1/10 · Minimal
- FEMA flood zone
- X (unshaded)
- Chance of flooding over 30 yrs
- 0.0%
- Est. flood insurance / yr
- $507 – $1,088
Fire risk 4/10 · Minor
- Est. fire insurance / yr
- $2,463 – $4,575
Heat risk 5/10 · Moderate
- Hot days now (above 107°F)
- 7 days/yr
- Hot days in 30 yrs
- 19 days/yr
Wind risk 3/10 · Minor
- Chance of severe wind over 30 yrs
- 4.0%
Air-quality risk 2/10 · Minimal
- Unhealthy air days now
- 1 days/yr
- Unhealthy air days in 30 yrs
- 2 days/yr
Risk factors via First Street. Map © Google.
Why this score? — see what drove the B+ grade
The composite is a weighted blend of 9 inputs, each scored 0–100. Each bar is that input's sub-score; the figure is the points it added to the 100-point composite (weight × sub-score).
- Cash flow +30.0/30.0
- ARV discount +15.0/15.0
- 1% rule +10.0/10.0
- DSCR +10.0/10.0
- Livability +4.0/5.0
- Rent growth +2.5/5.0
- Condition / age +2.5/5.0
- Schools +1.2/10.0
- Appreciation +0.0/10.0
$80,000
🖨 Deal sheet 📄 Offer letter ✓ Due diligence
Listing remarks
INVESTOR SPECIAL! This three bed/one bath home sits on a quarter acre lot with mature trees on a quiet street. Large kitchen space. One car garage. Newer HVAC and water tank. With some TLC this unit could rent for $1050-1100/month.
Key facts
- 0.24 acre lot
- Garage
- Built 1962
Property features AI
Finance
- Other: Listing status: Active; Occupied: No; Directions: East of Coltrane and NE 23rd
- Financial info: Not assumable
- HOA & community: No mandatory association dues
Exterior
- Parking: 1-car garage
- Utilities: No flood insurance required (per listing)
- Home design: Single family residence; One story; Residential property; Located in Days Garden Add
- Construction: Brick and frame construction; Shingle roof; Built with conventional foundation
- Exterior features: Wooded lot; No exterior special features listed; Existing property
Interior
- Bedrooms: 3 bedrooms (all on one level)
- Bathrooms: 1 full bathroom
- Interior features: One living area; No fireplace; Conventional foundation
Neighborhood map
What this means for you Summary
Snapshot
- This is a 3-bed/1.0-bath single-family listed at $80k.
Deal economics
- At list price, monthly cash flow is $448 ($5k/yr) — positive.
- The deal already cash-flows at list — no discount required.
- Meets the 1% rule at list price ($1k rent vs $80k).
- Recommended offer: $78k (3.0% below list) — sets the bar for market timing.
- Cap rate 13.0% vs local median 3.7% in Oklahoma City — top-decile yield for the area; either an underpriced asset or a hidden risk that comps aren't pricing in. Stress-test before assuming the spread holds.
Location & tenants
- Location reads 80/100 on livability (#3 in OK, #1,635 nationally) — a professional / high-income tenant draw. Strengths: amenities A+, commute A+, cost of living A+; Watch: schools F, crime F.
- Midwest City-Del City (suburban): math 10% / reading 17% proficiency, ranked #231 of 270 in OK (top 86%) — low school quality limits family demand, transient renter base, plan for 1-2y turnover.
- Market conditions: 28 active listings in the ZIP; 7 comparable units currently listed for rent nearby; rentals leasing fast (median 11d on market — plan ~1-2 weeks tenant-placement turnaround); 43% of comp listings sitting > 30 days — soft ceiling on asking rent; 5,365 units permitted in Oklahoma County in 2024 (569 in 5+ unit buildings).
Forward outlook
- Local home prices are declining (-3.0%/yr); year-one equity from $553 of loan paydown is wiped out by about $2k of value loss. Plan a longer hold.
- Oklahoma County population projected at +41% by 2050 — long-run rental-demand tailwind backs the buy-and-hold thesis.
- At projected returns (-3.0% appreciation + 3.0% rent growth), your $22k cash investment doubles in ~6 years — after that, you're playing with house money.
Negotiation context
- It's been on market 36 days — a 3% lower offer ($78k) is reasonable based on typical stale-listing flexibility.
Risks & watch-outs
- Climate carrying-cost: extreme-heat days projected 7→19/yr by 2055 (HVAC capex compounding) — expect insurance premiums to compound above CPI over the hold.
Questions for the listing agent
- It's been on market 36 days. Have you received any prior offers? Is the seller open to a 3% concession, seller financing, or rate buy-down credit?
- Built in 1962 — when were the roof, HVAC, electrical panel, plumbing, and water heater last replaced?
- Is there a deadline driving the sale (1031 exchange, divorce, estate, relocation)? That informs how much negotiation room exists.
- Schools are F-rated, which usually means shorter tenancies and higher turnover. Who's the typical renter profile here, and what's been the actual vacancy rate?
- Crime grade is F in this area — have there been break-ins, vandalism, or insurance claims at this property in the last 3 years? What carrier currently insures it and at what premium?
- What's the average days-on-market for RENTAL listings here right now (not sales)? A rising rental-DOM trend means longer vacancies and softer asking-rent achievability than the comps imply.
- What's the recent tenant-quality profile in this submarket — average credit score on applications, eviction rate, late-payment / NSF rate, and stable-employment percentage? A property-management company in the area should have these aggregated.
- How much new for-sale + rental construction is in the pipeline within 1–3 miles? Heavy new supply typically softens prices + rents 12–24 months out; constrained supply supports both.
Investment metrics
- 1% rule
- 1.55% ✓
- Cap rate
- 13.02%
- Cash-on-cash
- 24.02%
- DSCR
- 2.07
- GRM
- 5.4
CMA / ARV
- ARV (on-the-fly)
- $150,328
- Comps found
- 2
Show comp detail 2 sales within ~0.75 mi
| Address | Dist | Beds/Ba | Sqft | Sold | Price | $/sf | Match |
|---|---|---|---|---|---|---|---|
| 4209 NE 16th St | 0.24mi | 3/1.0 | 880 (+1%) | 9mo | $90,000 | $102 | 80 |
| 1912 Peachtree St | 0.05mi | 4/1.0 (+1) | 754 (-14%) | 15mo | $130,000 | $172 | 57 |
Match score weights: distance 35% · size 25% · config 20% · recency 20%. Top-matched comps best support the ARV.
Projected returns pro-forma
-3.0% appreciation · 3.0% rent growth · sell at horizon
- IRR
- 17.2%
- Equity multiple
- 1.70×
- Total profit
- $15,602
- Equity at exit
- $11,928
- IRR
- 25.8%
- Equity multiple
- 3.25×
- Total profit
- $50,389
- Equity at exit
- $6,917
Cash invested: $22,400 (down + closing). Projections, not guarantees.
Landlord ↔ Tenant lean methodology
- Overall (STATE)
- 83 Strongly Landlord-Friendly
- State Oklahoma
- 83 Strongly Landlord-Friendly · R+20
- County
- — inherits STATE
- City
- — inherits STATE
ZIP-level market 73121
- Home prices YoY
- -13.2%
- Active inventory
- 28
- Price-to-rent
- 5.4×
Monthly cashflow live
- Estimated rent
- $1,244 high interval (Pro) →
- Mortgage (P&I)
- −$420
- Tax from tax record
- −$81 /mo · $978/yr
- Insurance
- −$33
- HOA
- −$0
- Vacancy / Maint / Mgmt
- −$261
- Net cashflow
- $448
Break-even live
UW: 25.0% down · 7.5% · 30yr · 1.5% tax · 5.0% vac · 8.0% maint · 8.0% mgmt
Financing live
Cash to close
- Down payment
- $20,000
- Closing costs
- $2,400
- Reserves months
- —
- Total cash needed
- —
Loan-product check · same deal, 3 products live
Conventional
25% down · 7.5% · 30yr
- Down + closing
- —
- Monthly P&I
- —
- Monthly cashflow
- —
- DSCR
- —
- Eligible?
- —
Personal DTI + credit; lowest rate.
DSCR
20% down · 8.5% · 30yr
- Down + closing
- —
- Monthly P&I
- —
- Monthly cashflow
- —
- DSCR
- —
- Eligible?
- —
No personal income docs; deal must DSCR.
Hard money
10% down · 12.0% · 12mo
- Down + closing
- —
- Monthly P&I
- —
- Monthly cashflow
- —
- DSCR
- —
- Eligible?
- —
Short-term bridge; refi at stabilization.
Rent comps 7 comps
| Address | Beds | Baths | Sqft | Rent | $/sqft | DOM | Units | Dist |
|---|---|---|---|---|---|---|---|---|
| 4245 NE 20th St Oklahoma City, OK | 4.0 | 2.0 | 1060 | $1,361 | $1.28 | 2d | 1 | 0.14mi |
| 4205 NE 16th Ter Oklahoma City, OK | 3.0 | 2.0 | 1100 | $1,250 | $1.14 | 2d | 1 | 0.20mi |
| 3317 NE 15th St Oklahoma City, OK | 3.0 | 1.0 | 816 | $1,395 | $1.71 | 43d | 1 | 0.81mi |
| 3333 NE 12th St Oklahoma City, OK | 2.0 | 1.0 | 720 | $1,000 | $1.39 | 43d | 1 | 0.91mi |
| 3212 NE 15th St Oklahoma City, OK | 3.0 | 1.0 | 825 | $965 | $1.17 | 10d | 1 | 0.93mi |
| 3049 NE 15th St Oklahoma City, OK | 2.0 | 1.0 | 660 | $895 | $1.36 | 2d | 1 | 1.09mi |
| 2620 NE 19th St Oklahoma City, OK | 2.0 | 1.0 | 900 | $995 | $1.11 | 43d | 1 | 1.46mi |
Listing history 14 events
-
2026-06-18days on market $80,000 Active 36 DOM
-
2026-06-17days on market $80,000 Active 35 DOM
-
2026-06-16days on market $80,000 Active 34 DOM
-
2026-06-15days on market $80,000 Active 33 DOM
-
2026-06-13days on market $80,000 Active 31 DOM
-
2026-06-13days on market $80,000 Active 30 DOM
-
2026-06-09days on market $80,000 Active 27 DOM
-
2026-06-08days on market $80,000 Active 26 DOM
-
2026-06-07days on market $80,000 Active 25 DOM
-
2026-06-03days on market $80,000 Active 21 DOM
-
2026-06-02days on market $80,000 Active 20 DOM
-
2026-06-01days on market $80,000 Active 19 DOM
-
2026-05-31days on market $80,000 Active 18 DOM
-
2026-05-13$80,000 Active
ⓘ Source: listings_history table (triggers on properties + properties_extension) + one-shot
backfill from property_details.listing_events for pre-trigger history.
Tax reassessment forecast OK · Resets to sale price
- Current annual tax
- $978 · $81/mo
- Projected year-2 tax
- $978 · $81/mo
- Expected delta
- $0/yr ($0/mo · -0.0%)
ⓘ Screening estimate from a state-policy table — verify with the county assessor before closing.
Climate risk First Street
- Flood 1/10 Low FEMA zone X (unshaded) · 0% chance over 30 yrs
- Wildfire 4/10 Moderate
- Heat 5/10 Major 7 d/yr ≥107°F today · 19 d/yr by 30 yrs out
- Wind 3/10 Moderate 4% chance of damaging wind over 30 yrs
- Air quality 2/10 Low 1 unhealthy d/yr today · 2 by 30 yrs out
Nearby sold comps map
Loading sold comps map…
Walkable amenities ~0.75 mi
Loading nearby amenities…
Taxation est. · year 1
- Rental income
- $14,928
- − Mortgage interest
- −$4,481
- − Property taxes
- −$978
- − Insurance
- −$400
- − Repairs & maintenance
- −$1,194
- − Management
- −$1,194
- − Depreciation
- −$2,327
- Taxable income
- $4,353
- Est. tax owed @ 24.0%
- −$1,045
- After-tax cash flow
- $4,336/yr
For passive investors: Depreciation is non-cash, so a rental often shows a tax loss while cash-flowing — sheltering income. Rental losses are passive: they offset passive income freely, and up to $25,000/yr can offset ordinary (W-2) income if you actively participate and your MAGI is under $100k (phasing out to $0 by $150k); unused losses carry forward. On sale, claimed depreciation is recaptured at up to 25%, and gains may owe capital-gains tax (a 1031 exchange can defer both). Figures are a year-1 estimate at your 24.0% rate — not tax advice; consult a CPA.
Schools (NCES district)
- District
- Midwest City-Del City
- NCES district ID
- 4019950
- Math proficiency
- 10% ▼ -11.00%
- Reading proficiency
- 17% ▼ -8.00%
- Median HH income
- $45,724
- Composite
- 12.09/100
- National rank
- #9658
- State rank
- #231 of 270 in OK
Livability — Oklahoma City
- Score
- 80/100
- State rank
- #3
- US rank
- #1635
Category grades
Schools grade is shown separately in the Schools card above.
Census & demographics
- Census place
- Oklahoma City, OK
- City population
- 498,656
- Population (ZIP)
- 2,935
Population outlook (Oklahoma County) Hauer SSP2
- Today (2025)
- 911,875 people
- By 2030
- 982,413 · +7.7%
- By 2040
- 1,130,468 · +24.0%
- By 2050
- 1,288,422 · +41.3%
- By 2075
- 1,711,482 · +87.7%
- By 2100
- 2,088,448 · +129.0%
Race, ethnicity, and origin ACS 2023
- Neighborhood character
- Diverse neighborhood (Simpson 0.66)
- Race & ethnicity
- Black 44% White 35% Hispanic / Latino 15% Native American 5% Two or more races 4% Asian 2%
- Hispanic origin (detail)
- Mexican 14%
- Common ancestry
- Slovak 1%
- Foreign-born
- 6% · Canada, Vietnam, Dominican Republic
- Languages at home
- 86% English-only · Spanish 12% Vietnamese 1%
Political lean MEDSL · Oklahoma
- 2024 margin
- Toss-up / Even · D 48.0% · R 49.7% · Other 2.3%
- 2008→2024 swing
- +15.1pp toward D · 2008: -16.8pp · 2024: -1.7pp
- All cycles
- 2024: R+1.7 2020: R+1.1 2016: R+10.5 2012: R+16.7 2008: R+16.8
Not yet ingested
- Civics
- —
Market trends
- HPI YoY
- ▼ -46.07%
- Current HPI
- 302.3617
- Rent YoY
- —
- Metro
- —
- State GDP YoY
- ▲ 1.55%
- F500 in state
- 6
Industry mix (Fortune 500 HQ in OK)
| Industry | F500 HQs | Revenue |
|---|---|---|
| Energy | 3 | $48B |
|
||
Price history
1 event — show timeline
- 2026-05-13 Listed $80,000 MLSOK
Property tax history
+16.7%/yrLatest (2025): $978 · +4.2% YoY. Source: county tax records.
Cash-flow waterfall
monthlySold comps — $/sqft
last 12 mo · ≤1 miLoading sold comps…