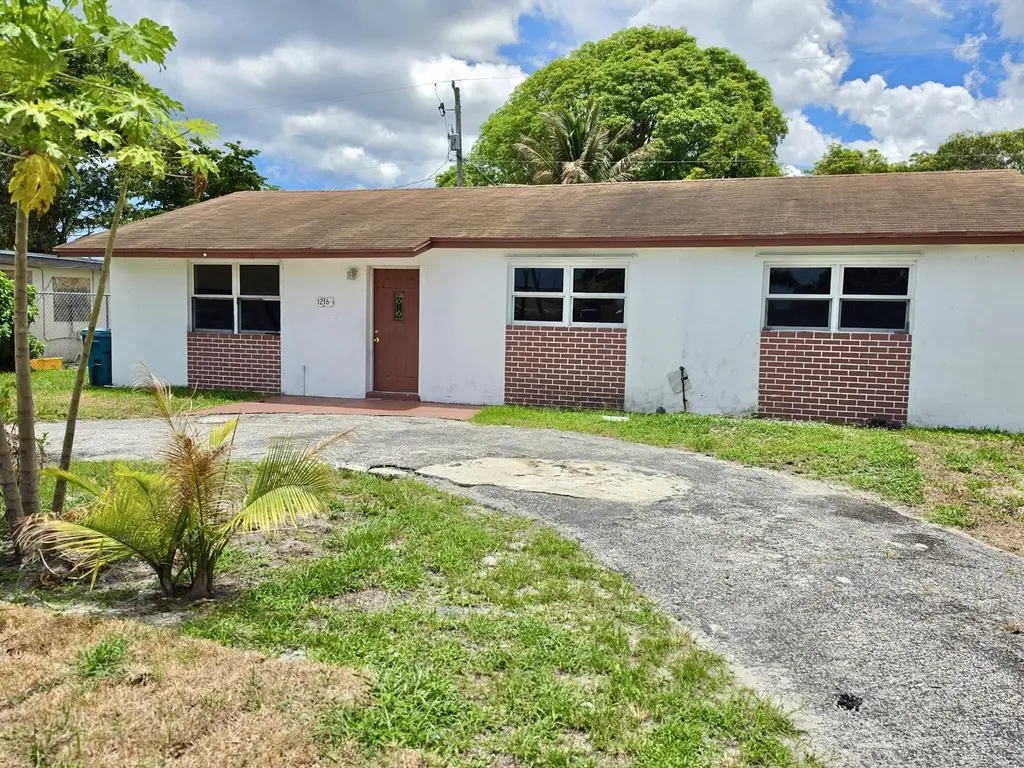
1216 Giller Ave · Mangonia Park, FL
Flood risk 1/10 · Minimal
- FEMA flood zone
- X (unshaded)
- Chance of flooding over 30 yrs
- 0.0%
- Est. flood insurance / yr
- $507 – $1,088
Fire risk 1/10 · Minimal
- Est. fire insurance / yr
- $947 – $1,759
Heat risk 10/10 · Severe
- Hot days now (above 105°F)
- 7 days/yr
- Hot days in 30 yrs
- 24 days/yr
Wind risk 10/10 · Severe
- Chance of severe wind over 30 yrs
- 99.0%
Air-quality risk 2/10 · Minimal
- Unhealthy air days now
- 0 days/yr
- Unhealthy air days in 30 yrs
- 1 days/yr
Risk factors via First Street. Map © Google.
Why this score? — see what drove the C grade
The composite is a weighted blend of 9 inputs, each scored 0–100. Each bar is that input's sub-score; the figure is the points it added to the 100-point composite (weight × sub-score).
- Cash flow +23.1/30.0
- ARV discount +7.5/15.0
- DSCR +7.4/10.0
- 1% rule +5.7/10.0
- Schools +4.3/10.0
- Livability +3.5/5.0
- Rent growth +3.3/5.0
- Condition / age +2.5/5.0
- Appreciation +0.0/10.0
$339,000
🖨 Deal sheet (PDF) 📄 Offer letter ✓ Due diligence
Listing remarks
NO MORE SHOWINGS. .. .HIGHEST AND BEST DUE 6/16 2PM, Large 4/2 Block SFH approx 1836sf. 2025 a/c. Previously leased at 2800/mo. Priced at only 184/sf. Needs appliances and a little TLC. In the heart of WPB. Under 4 miles to the beaches of Phil Foster Park, Peanut Island, and close to John D MacArthur Park and 4 miles to Singer Island Beach. 7 miles to Palm Beach International Airport and only 1 mile to Mangonia Park Tri-Rail and bus terminals. Also close to St Mary's Medical Center, Palm Beach Children's Hospital, and Good Samaritan Medical Center, giving the property excellent rental potential. Enjoy the Salt Life with nearby dog friendly beaches , swimming, boat docks, boat ramps, dive bo
Key facts
- Nearby swimming
- Nearby boat docks
- Nearby boat ramps
Tags
Property features AI
Finance
- Other: Pets allowed with no restrictions
Exterior
- Parking: Driveway; Parking for 4 vehicles
- Security: No security features listed
- Utilities: Public water; Public sewer; Cable available; Electricity connected; Water connected
- Home design: Single-family residence; One story; North-facing; Resale property
- Construction: Built with brick veneer, frame and concrete block (no stucco); Shingle roof
- Exterior features: Not waterfront
Interior
- Kitchen: No appliances listed
- Bedrooms: One bedroom on the main level
- Flooring: Ceramic tile; Other flooring
- Bathrooms: Two full bathrooms (one on the main level)
- Heating & cooling: Central heating; Central air conditioning
- Interior features: No notable interior features reported
- Laundry & utility: No laundry appliances listed
Neighborhood map
What this means for you Summary
Snapshot
- This is a 4-bed/1.0-bath single-family listed at $339k.
Deal economics
- At list price, monthly cash flow is $608 ($7k/yr) — positive.
- The deal already cash-flows at list — no discount required.
- Meets the 1% rule at list price ($4k rent vs $339k).
- Recommended offer: $334k (1.5% below list) — sets the bar for market timing.
Location & tenants
- Location reads 69/100 on livability (#482 in FL) — a middle-class / working-renter tenant base. Strengths: cost of living A+, housing A+, health & safety A+; Watch: crime F, amenities F, employment D-.
- Palm Beach (suburban): math 46% / reading 53% proficiency, ranked #34 of 73 in FL (top 47%) — families likely to look elsewhere, expect single-tenant / working-renter base with shorter leases.
- Zoned schools: West Riviera Elementary School (math 26% / reading 22%, grade F, #2,057 of 2,144 statewide, top 96%, 487 students, 83% FRL); John F. Kennedy Middle School (math 28% / reading 29%, grade F, #482 of 571 statewide, top 85%, 826 students, 78% FRL); Palm Beach Lakes High School (math 17% / reading 26%, grade F, #546 of 667 statewide, top 82%, 2,688 students, 70% FRL) — zoned schools average 77% FRL vs 52% district-wide (25 pts higher); higher-poverty schools than district average — tighter screening recommended.
- Zoned-school proficiency averages 25% at this address vs 50% district-wide (-25 pts) — the specific schools serving this property underperform the Palm Beach average; the district grade overstates school quality for this exact location.
- Market conditions: Rents rising (+3.1%/yr); 305 active listings in the ZIP; 18 comparable units currently listed for rent nearby; rentals at typical pace (median 26d on market — plan ~3-4 weeks tenant-placement turnaround); 3,974 units permitted in Palm Beach County in 2024 (1,012 in 5+ unit buildings).
- At $3,627/mo this rent would consume 73% of the median local household income ($60k/yr) (locally 2157% of renters already pay >50% of income on rent) — very limited rent-growth headroom before tenants either downsize or default.
Forward outlook
- Local home prices are declining (-3.0%/yr); year-one equity from $2k of loan paydown is wiped out by about $10k of value loss. Plan a longer hold.
- Palm Beach County population projected at +30% by 2050 — long-run rental-demand tailwind backs the buy-and-hold thesis.
Negotiation context
- It's been on market 18 days — a 2% lower offer ($334k) is reasonable based on typical stale-listing flexibility.
- Current owner paid $24k; list at $339k implies a 1343% gain — meaningful room to come down on a strong offer.
Risks & watch-outs
- Climate carrying-cost: severe wind risk, 99% chance of damaging wind over 30y; extreme-heat days projected 7→24/yr by 2055 (HVAC capex compounding) — expect insurance premiums to compound above CPI over the hold.
Questions for the listing agent
- Built in 1972 — when were the roof, HVAC, electrical panel, plumbing, and water heater last replaced?
- Is there a deadline driving the sale (1031 exchange, divorce, estate, relocation)? That informs how much negotiation room exists.
- Schools are B-rated — typically a magnet for longer-tenancy family renters. What's the average tenant stay here, and is there a school-zone premium baked into asking?
- Crime grade is F in this area — have there been break-ins, vandalism, or insurance claims at this property in the last 3 years? What carrier currently insures it and at what premium?
- What's the average days-on-market for RENTAL listings here right now (not sales)? A rising rental-DOM trend means longer vacancies and softer asking-rent achievability than the comps imply.
- What's the recent tenant-quality profile in this submarket — average credit score on applications, eviction rate, late-payment / NSF rate, and stable-employment percentage? A property-management company in the area should have these aggregated.
- How much new for-sale + rental construction is in the pipeline within 1–3 miles? Heavy new supply typically softens prices + rents 12–24 months out; constrained supply supports both.
Investment metrics
- 1% rule
- 1.07% ✓
- Cap rate
- 8.44%
- Cash-on-cash
- 7.68%
- DSCR
- 1.34
- GRM
- 7.8
CMA / ARV
No comps found within radius.
Projected returns pro-forma
-3.0% appreciation · 3.08% rent growth · sell at horizon
- IRR
- -4.5%
- Equity multiple
- 0.83×
- Total profit
- $-15,930
- Equity at exit
- $50,546
- IRR
- 5.3%
- Equity multiple
- 1.39×
- Total profit
- $37,183
- Equity at exit
- $29,311
Cash invested: $94,920 (down + closing). Projections, not guarantees.
Landlord ↔ Tenant lean methodology
- Overall (STATE)
- 87 Strongly Landlord-Friendly
- State Florida
- 87 Strongly Landlord-Friendly · R+3
- County
- — inherits STATE
- City
- — inherits STATE
ZIP-level market 33407
- Rents YoY
- 3.1%
- Active inventory
- 305
- Price-to-rent
- 7.8×
Monthly cashflow live
- Estimated rent
- $3,627 high interval (Pro) →
- Mortgage (P&I)
- −$1,778
- Tax from tax record
- −$339 /mo · $4,065/yr
- Insurance
- −$141
- HOA
- −$0
- Vacancy / Maint / Mgmt
- −$762
- Net cashflow
- $608
Break-even live
Sensitivity live
| Price | -10% $800 | -5% $704 | +0% $608 | +5% $512 | +10% $416 |
|---|---|---|---|---|---|
| Rent | -10% $321 | -5% $464 | +0% $608 | +5% $751 | +10% $894 |
| Rate | -1.0pp $778 | -0.5pp $694 | base $608 | +0.5pp $520 | +1.0pp $431 |
UW: 25.0% down · 7.5% · 30yr · 1.5% tax · 5.0% vac · 8.0% maint · 8.0% mgmt
Financing live
Cash to close
- Down payment
- $84,750
- Closing costs
- $10,170
- Reserves months
- —
- Total cash needed
- —
Loan-product check · same deal, 3 products live
Conventional
25% down · 7.5% · 30yr
- Down + closing
- —
- Monthly P&I
- —
- Monthly cashflow
- —
- DSCR
- —
- Eligible?
- —
Personal DTI + credit; lowest rate.
DSCR
20% down · 8.5% · 30yr
- Down + closing
- —
- Monthly P&I
- —
- Monthly cashflow
- —
- DSCR
- —
- Eligible?
- —
No personal income docs; deal must DSCR.
Hard money
10% down · 12.0% · 12mo
- Down + closing
- —
- Monthly P&I
- —
- Monthly cashflow
- —
- DSCR
- —
- Eligible?
- —
Short-term bridge; refi at stabilization.
Rent comps 18 comps
| Address | Beds | Baths | Sqft | Rent | $/sqft | DOM | Units | Dist |
|---|---|---|---|---|---|---|---|---|
| 1721 Lindley St Mangonia Park, FL | 3.0 | 2.5 | 1760 | $3,300 | $1.88 | 9d | 1 | 0.57mi |
| 1616 Crandon Ave Mangonia Park, FL | 3.0 | 2.0 | 2400 | $3,200 | $1.33 | 25d | 1 | 0.57mi |
| 1401 W 9th St Riviera Beach, FL | 3.0 | 2.0 | 1304 | $3,200 | $2.45 | 25d | 1 | 0.58mi |
| 5649 Mentmore Dr Riviera Beach, FL | 3.0 | 2.5 | 1450 | $2,900 | $2.00 | 25d | 1 | 0.66mi |
| 1563 40th St West Palm Beach, FL | 4.0 | 2.0 | 1680 | $3,600 | $2.14 | 5d | 1 | 0.83mi |
| 5605 Pinewood Ave West Palm Beach, FL | 4.0 | 2.0 | 1440 | $3,500 | $2.43 | 0d | 1 | 0.86mi |
| 1537 39th St West Palm Beach, FL | 5.0 | 3.0 | 2463 | $4,800 | $1.95 | 25d | 1 | 0.91mi |
| 629 56th St West Palm Beach, FL | 4.0 | 2.0 | 1689 | $3,100 | $1.84 | 16d | 1 | 1.01mi |
| 195 River Grove Way West Palm Beach, FL | 3.0 | 1.0–2.0 | 958 | $3,717 | $3.88 | 0d | 18 | 1.12mi |
| 3808 Westview Ave West Palm Beach, FL | 4.0 | 3.0 | 1617 | $3,100 | $1.92 | 25d | 1 | 1.21mi |
| 424 51st St Unit 426 West Palm Beach, FL | 3.0 | 2.0 | 1230 | $3,500 | $2.85 | 12d | 1 | 1.24mi |
| 5203 N Flagler Dr West Palm Beach, FL | 3.0 | 1.5 | 1458 | $6,000 | $4.12 | 25d | 1 | 1.28mi |
| 5301 N Flagler Dr West Palm Beach, FL | 4.0 | 3.0 | 1616 | $6,000 | $3.71 | 25d | 1 | 1.28mi |
| 3590 Village Blvd West Palm Beach, FL | 1.0–3.0 | 1.0–2.0 | 1074 | $3,295 | $3.07 | 0d | 30 | 1.32mi |
| 701 37th St West Palm Beach, FL | 3.0 | 2.0 | 1426 | $3,600 | $2.52 | 25d | 1 | 1.37mi |
| 65 W 16th St Apt 1 Riviera Beach, FL | 4.0 | 2.0 | 1232 | $3,500 | $2.84 | 18d | 1 | 1.41mi |
| 619 37th St West Palm Beach, FL | 3.0 | 2.0 | 1414 | $3,350 | $2.37 | 25d | 1 | 1.41mi |
| 401 42nd St West Palm Beach, FL | 3.0 | 1.0 | 1400 | $4,950 | $3.54 | 16d | 1 | 1.45mi |
Listing history 11 events
-
2026-06-21statusdays on market $339,000 Active Under Contract 18 DOM
-
2026-06-18days on market $339,000 Active 15 DOM
-
2026-06-17days on market $339,000 Active 14 DOM
-
2026-06-16days on market $339,000 Active 13 DOM
-
2026-06-15days on market $339,000 Active 12 DOM
-
2026-06-13pricedays on market $339,000 Active 10 DOM
-
2026-06-09days on market $349,000 Active 6 DOM
-
2026-06-08days on market $349,000 Active 5 DOM
-
2026-06-07pricedays on market $349,000 Active 4 DOM
-
2026-06-04remarks 699-char remark
-
2026-06-04$379,000 Active 1 DOM
ⓘ Source: listings_history table (triggers on properties + properties_extension) + one-shot
backfill from property_details.listing_events for pre-trigger history.
Tax reassessment forecast FL · Resets to sale price
- Current annual tax
- $4,065 · $339/mo
- Projected year-2 tax
- $4,065 · $339/mo
- Expected delta
- $0/yr ($0/mo · 0.0%)
ⓘ Screening estimate from a state-policy table — verify with the county assessor before closing.
Climate risk First Street
- Flood 1/10 Low FEMA zone X (unshaded) · 0% chance over 30 yrs
- Wildfire 1/10 Low
- Heat 10/10 Extreme 7 d/yr ≥105°F today · 24 d/yr by 30 yrs out
- Wind 10/10 Extreme 99% chance of damaging wind over 30 yrs
- Air quality 2/10 Low 0 unhealthy d/yr today · 1 by 30 yrs out
Nearby sold comps map
Loading sold comps map…
Walkable amenities ~0.75 mi
Loading nearby amenities…
Taxation est. · year 1
- Rental income
- $43,527
- − Mortgage interest
- −$18,989
- − Property taxes
- −$4,065
- − Insurance
- −$1,695
- − Repairs & maintenance
- −$3,482
- − Management
- −$3,482
- − Depreciation
- −$9,862
- Taxable income
- $1,951
- Est. tax owed @ 24.0%
- −$468
- After-tax cash flow
- $6,825/yr
For passive investors: Depreciation is non-cash, so a rental often shows a tax loss while cash-flowing — sheltering income. Rental losses are passive: they offset passive income freely, and up to $25,000/yr can offset ordinary (W-2) income if you actively participate and your MAGI is under $100k (phasing out to $0 by $150k); unused losses carry forward. On sale, claimed depreciation is recaptured at up to 25%, and gains may owe capital-gains tax (a 1031 exchange can defer both). Figures are a year-1 estimate at your 24.0% rate — not tax advice; consult a CPA.
Schools (NCES district)
- District
- Palm Beach
- NCES district ID
- 1201500
- Math proficiency
- 46% ▼ -16.00%
- Reading proficiency
- 53% ▼ -4.00%
- Median HH income
- $53,943
- Composite
- 42.72/100
- National rank
- #3160
- State rank
- #34 of 73 in FL
Livability — Mangonia Park
- Score
- 69/100
- State rank
- #482
- US rank
- #8801
Category grades
Schools grade is shown separately in the Schools card above.
Census & demographics
- Census place
- Mangonia Park, FL
- County
- Palm Beach County · 1,438,312 people
- Metro
- Miami-Fort Lauderdale-Pompano Beach, FL
- Population (ZIP)
- 34,851
- Household income
- $59,993
- Rent vs Own
- Severe rent burden
- 2157.0
Population outlook (Palm Beach County) Hauer SSP2
- Today (2025)
- 1,637,487 people
- By 2030
- 1,743,255 · +6.5%
- By 2040
- 1,948,712 · +19.0%
- By 2050
- 2,132,979 · +30.3%
- By 2075
- 2,530,027 · +54.5%
- By 2100
- 2,706,979 · +65.3%
Race, ethnicity, and origin ACS 2023
- Neighborhood character
- Diverse neighborhood (Simpson 0.62)
- Race & ethnicity
- Black 54% White 21% Hispanic / Latino 20% Two or more races 13% Asian 2%
- Hispanic origin (detail)
- Mexican 2% Puerto Rican 2% Cuban 2%
- Common ancestry
- Hispanic 8% Lithuanian 1% Romanian 1%
- Foreign-born
- 26% · Canada, Vietnam, Jamaica
- Languages at home
- 72% English-only · Spanish 17% French/Haitian/Cajun 8% Other Indo-European 1%
Political lean MEDSL · Palm Beach
- 2024 margin
- Toss-up / Even · D 50.0% · R 49.2%
- 2008→2024 swing
- -22.1pp toward R · 2008: 22.9pp · 2024: 0.8pp
- All cycles
- 2024: D+0.8 2020: D+12.8 2016: D+15.3 2012: D+17.0 2008: D+22.9
Not yet ingested
- Civics
- —
Market trends
- HPI YoY
- ▼ -299.26%
- Current HPI
- 363.3995
- Rent YoY
- ▲ 3.08%
- Metro
- Miami-Fort Lauderdale-Pompano Beach, FL
- State GDP YoY
- ▲ 3.28%
- F500 in state
- 36
Industry mix (Fortune 500 HQ in FL)
| Industry | F500 HQs | Revenue |
|---|---|---|
| Industrial Technology | 2 | $29B |
|
||
| Insurance | 2 | $17B |
|
||
| Retail | 1 | $60B |
|
||
| Technology Distribution | 1 | $58B |
|
||
| Homebuilding | 1 | $35B |
|
||
| Technology Manufacturing | 1 | $35B |
|
||
Price history
+4111.1% since first listed3 events — show timeline
- 2026-05-31 Listed $379,000 Beaches MLS
- 1973-01-01 Sold (Public Records) $23,500 Public Records
- 1972-01-01 Sold (Public Records) $9,000 Public Records
Property tax history
+7.1%/yrLatest (2025): $4,065 · +7.4% YoY. Source: county tax records.
Cash-flow waterfall
monthlySold comps — $/sqft
last 12 mo · ≤1 miLoading sold comps…