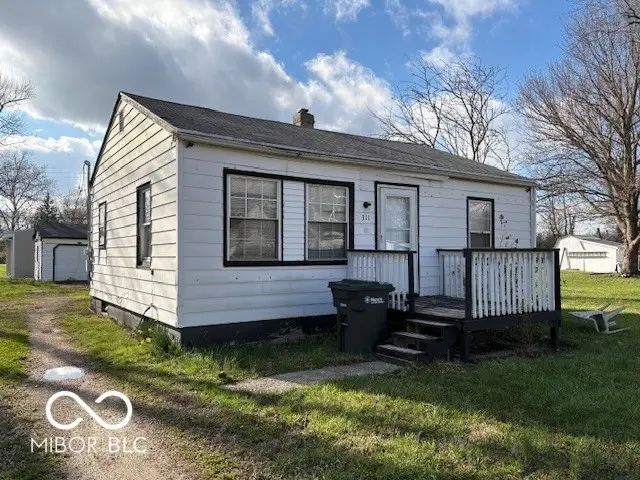
311 N Biltmore Ave · Muncie, IN
Flood risk 1/10 · Minimal
- FEMA flood zone
- X (unshaded)
- Chance of flooding over 30 yrs
- 0.0%
- Est. flood insurance / yr
- $473 – $860
Fire risk 1/10 · Minimal
- Est. fire insurance / yr
- $717 – $1,331
Heat risk 3/10 · Minor
- Hot days now (above 100°F)
- 7 days/yr
- Hot days in 30 yrs
- 18 days/yr
Wind risk 2/10 · Minimal
- Chance of severe wind over 30 yrs
- 1.0%
Air-quality risk 3/10 · Minor
- Unhealthy air days now
- 2 days/yr
- Unhealthy air days in 30 yrs
- 3 days/yr
Risk factors via First Street. Map © Google.
Why this score? — see what drove the C+ grade
The composite is a weighted blend of 9 inputs, each scored 0–100. Each bar is that input's sub-score; the figure is the points it added to the 100-point composite (weight × sub-score).
- Cash flow +24.3/30.0
- ARV discount +13.3/15.0
- DSCR +7.8/10.0
- 1% rule +6.1/10.0
- Rent growth +4.5/5.0
- Livability +4.0/5.0
- Condition / age +2.5/5.0
- Schools +1.7/10.0
- Appreciation +0.0/10.0
$79,900
🖨 Deal sheet (PDF) 📄 Offer letter ✓ Due diligence
Listing remarks MLS
Tenant is moving. Was rented for $850 per month. 2 bedroom, 1 bath home featuring a 2 car detached garage and plenty of parking. Enjoy the front deck, perfect for relaxing or entertaining.
Key facts
- Front deck
- Plenty of parking
- Detached garage
Tags
Neighborhood map
What this means for you Summary
Snapshot
- This is a 2-bed/1.0-bath single-family listed at $80k.
Deal economics
- At list price, monthly cash flow is $161 ($2k/yr) — positive.
- The deal already cash-flows at list — no discount required.
- Meets the 1% rule at list price ($887 rent vs $80k).
- Recommended offer: $75k (6.0% below list) — sets the bar for market timing.
- Cap rate 8.7% vs local median 6.0% in Muncie — top-decile yield for the area; either an underpriced asset or a hidden risk that comps aren't pricing in. Stress-test before assuming the spread holds.
Location & tenants
- Location reads 80/100 on livability (#18 in IN, #1,654 nationally) — a professional / high-income tenant draw. Strengths: amenities A+, commute A+, cost of living A+; Watch: schools D+, crime F, employment F.
- Muncie Community Schools (urban): math 18% / reading 25% proficiency, ranked #275 of 301 in IN (top 91%) — low school quality limits family demand, transient renter base, plan for 1-2y turnover; 68% free/reduced lunch — lower-income household profile, screen leases tightly.
- Market conditions: Rents rising fast (+7.8%/yr); 112 active listings in the ZIP; 1 comparable units currently listed for rent nearby; 171 units permitted in Delaware County in 2024 (57 in 5+ unit buildings).
Forward outlook
- Local home prices are declining (-3.0%/yr); year-one equity from $552 of loan paydown is wiped out by about $2k of value loss. Plan a longer hold.
- Delaware County population projected at -11% by 2050 — secular population decline; favor cash flow + early exit over multi-decade hold.
- At projected returns (-3.0% appreciation + 7.8% rent growth), your $22k cash investment doubles in ~8 years — after that, you're playing with house money.
Negotiation context
- It's been on market 83 days — a 6% lower offer ($75k) is reasonable based on typical stale-listing flexibility.
- 4 sale attempts since 10y ago with the ask held roughly flat each time — persistent listings suggest the price (not the market) is what's stuck; bring a comps-based counter.
Risks & watch-outs
- Watch-outs: built in 1947 — expect roof / HVAC / electrical / plumbing capex.
Questions for the listing agent
- It's been on market 83 days. Have you received any prior offers? Is the seller open to a 6% concession, seller financing, or rate buy-down credit?
- Built in 1947 — when were the roof, HVAC, electrical panel, plumbing, and water heater last replaced?
- Why hasn't it sold? Are there any deal-killer items the seller is aware of (foundation, flood, title, zoning, code violations)?
- Is there a deadline driving the sale (1031 exchange, divorce, estate, relocation)? That informs how much negotiation room exists.
- Schools are D-rated, which usually means shorter tenancies and higher turnover. Who's the typical renter profile here, and what's been the actual vacancy rate?
- Crime grade is F in this area — have there been break-ins, vandalism, or insurance claims at this property in the last 3 years? What carrier currently insures it and at what premium?
- What's the average days-on-market for RENTAL listings here right now (not sales)? A rising rental-DOM trend means longer vacancies and softer asking-rent achievability than the comps imply.
- What's the recent tenant-quality profile in this submarket — average credit score on applications, eviction rate, late-payment / NSF rate, and stable-employment percentage? A property-management company in the area should have these aggregated.
- How much new for-sale + rental construction is in the pipeline within 1–3 miles? Heavy new supply typically softens prices + rents 12–24 months out; constrained supply supports both.
Investment metrics
- 1% rule
- 1.11% ✓
- Cap rate
- 8.72%
- Cash-on-cash
- 8.65%
- DSCR
- 1.38
- GRM
- 7.5
CMA / ARV
- ARV (median comp)
- $91,651
- List price
- $79,900
- Delta
- -12.82%
- Verdict
- UNDERPRICED
- Comps
- 20 within 1.0 mi
Show comp detail 5 sales within ~0.75 mi
| Address | Dist | Beds/Ba | Sqft | Sold | Price | $/sf | Match |
|---|---|---|---|---|---|---|---|
| 307 N Biltmore Ave | 0.03mi | 2/1.0 | 720 (+7%) | 22mo | $58,000 | $81 | 68 |
| 3000 E Manor St | 0.29mi | 2/1.0 | 736 (+10%) | 6mo | $125,000 | $170 | 65 |
| 215 N Grafton Ave | 0.20mi | 2/1.0 | 760 (+13%) | 16mo | $75,000 | $99 | 55 |
| 707 S Luick Ave | 0.62mi | 1/1.0 (-1) | 625 (-7%) | 6mo | $24,000 | $38 | 50 |
| 1008 N Bellaire Ave | 0.63mi | 2/1.0 | 768 (+14%) | 8mo | $95,000 | $124 | 40 |
Match score weights: distance 35% · size 25% · config 20% · recency 20%. Top-matched comps best support the ARV.
Projected returns pro-forma
-3.0% appreciation · 7.8% rent growth · sell at horizon
- IRR
- 2.0%
- Equity multiple
- 1.08×
- Total profit
- $1,821
- Equity at exit
- $11,913
- IRR
- 15.8%
- Equity multiple
- 2.57×
- Total profit
- $35,182
- Equity at exit
- $6,908
Cash invested: $22,372 (down + closing). Projections, not guarantees.
Landlord ↔ Tenant lean methodology
- Overall (STATE)
- 90 Strongly Landlord-Friendly
- State Indiana
- 90 Strongly Landlord-Friendly · R+11
- County
- — inherits STATE
- City
- — inherits STATE
ZIP-level market 47303
- Home prices YoY
- -18.0%
- Rents YoY
- 7.8%
- Active inventory
- 112
- Price-to-rent
- 7.5×
Monthly cashflow live
- Estimated rent
- $887 medium interval (Pro) →
- Mortgage (P&I)
- −$419
- Tax from tax record
- −$87 /mo · $1,042/yr
- Insurance
- −$33
- HOA
- −$0
- Vacancy / Maint / Mgmt
- −$186
- Net cashflow
- $161
Break-even live
Sensitivity live
| Price | -10% $207 | -5% $184 | +0% $161 | +5% $139 | +10% $116 |
|---|---|---|---|---|---|
| Rent | -10% $91 | -5% $126 | +0% $161 | +5% $196 | +10% $231 |
| Rate | -1.0pp $202 | -0.5pp $182 | base $161 | +0.5pp $141 | +1.0pp $120 |
UW: 25.0% down · 7.5% · 30yr · 1.5% tax · 5.0% vac · 8.0% maint · 8.0% mgmt
Financing live
Cash to close
- Down payment
- $19,975
- Closing costs
- $2,397
- Reserves months
- —
- Total cash needed
- —
Loan-product check · same deal, 3 products live
Conventional
25% down · 7.5% · 30yr
- Down + closing
- —
- Monthly P&I
- —
- Monthly cashflow
- —
- DSCR
- —
- Eligible?
- —
Personal DTI + credit; lowest rate.
DSCR
20% down · 8.5% · 30yr
- Down + closing
- —
- Monthly P&I
- —
- Monthly cashflow
- —
- DSCR
- —
- Eligible?
- —
No personal income docs; deal must DSCR.
Hard money
10% down · 12.0% · 12mo
- Down + closing
- —
- Monthly P&I
- —
- Monthly cashflow
- —
- DSCR
- —
- Eligible?
- —
Short-term bridge; refi at stabilization.
Rent comps 1 comps
| Address | Beds | Baths | Sqft | Rent | $/sqft | DOM | Units | Dist |
|---|---|---|---|---|---|---|---|---|
| 1521 E Kirby Ave Muncie, IN | 2.0–4.0 | 1.0–2.0 | 972 | $800 | $0.82 | 44d | 2 | 1.09mi |
Listing history 21 events
-
2026-06-19days on market $79,900 Active 83 DOM
-
2026-06-18days on market $79,900 Active 82 DOM
-
2026-06-17days on market $79,900 Active 81 DOM
-
2026-06-16days on market $79,900 Active 80 DOM
-
2026-06-15days on market $79,900 Active 79 DOM
-
2026-06-14days on market $79,900 Active 77 DOM
-
2026-06-13days on market $79,900 Active 76 DOM
-
2026-06-10days on market $79,900 Active 74 DOM
-
2026-06-09days on market $79,900 Active 73 DOM
-
2026-06-08days on market $79,900 Active 72 DOM
-
2026-06-07days on market $79,900 Active 71 DOM
-
2026-06-05days on market $79,900 Active 68 DOM
-
2026-06-03days on market $79,900 Active 67 DOM
-
2026-06-02days on market $79,900 Active 66 DOM
-
2026-06-01days on market $79,900 Active 65 DOM
-
2026-05-31days on market $79,900 Active 64 DOM
-
2026-05-30days on market $79,900 Active 63 DOM
-
2026-03-27$79,900 Active 188-char remark
Show marketing remark (188 chars)
Tenant is moving. Was rented for $850 per month. 2 bedroom, 1 bath home featuring a 2 car detached garage and plenty of parking. Enjoy the front deck, perfect for relaxing or entertaining.
-
2026-03-27$79,900 Active 188-char remark
Show marketing remark (188 chars)
Tenant is moving. Was rented for $850 per month. 2 bedroom, 1 bath home featuring a 2 car detached garage and plenty of parking. Enjoy the front deck, perfect for relaxing or entertaining.
-
2017-01-26$22,500
-
2016-04-04$127,900
ⓘ Source: listings_history table (triggers on properties + properties_extension) + one-shot
backfill from property_details.listing_events for pre-trigger history.
Tax reassessment forecast IN · Partial reset (capped growth)
- Current annual tax
- $1,042 · $87/mo
- Projected year-2 tax
- $1,042 · $87/mo
- Expected delta
- $0/yr ($0/mo · 0.0%)
ⓘ Screening estimate from a state-policy table — verify with the county assessor before closing.
Climate risk First Street
- Flood 1/10 Low FEMA zone X (unshaded) · 0% chance over 30 yrs
- Wildfire 1/10 Low
- Heat 3/10 Moderate 7 d/yr ≥100°F today · 18 d/yr by 30 yrs out
- Wind 2/10 Low 100% chance of damaging wind over 30 yrs
- Air quality 3/10 Moderate 2 unhealthy d/yr today · 3 by 30 yrs out
Nearby sold comps map
Loading sold comps map…
Walkable amenities ~0.75 mi
Loading nearby amenities…
Taxation est. · year 1
- Rental income
- $10,639
- − Mortgage interest
- −$4,476
- − Property taxes
- −$1,042
- − Insurance
- −$400
- − Repairs & maintenance
- −$851
- − Management
- −$851
- − Depreciation
- −$2,324
- Taxable income
- $696
- Est. tax owed @ 24.0%
- −$167
- After-tax cash flow
- $1,769/yr
For passive investors: Depreciation is non-cash, so a rental often shows a tax loss while cash-flowing — sheltering income. Rental losses are passive: they offset passive income freely, and up to $25,000/yr can offset ordinary (W-2) income if you actively participate and your MAGI is under $100k (phasing out to $0 by $150k); unused losses carry forward. On sale, claimed depreciation is recaptured at up to 25%, and gains may owe capital-gains tax (a 1031 exchange can defer both). Figures are a year-1 estimate at your 24.0% rate — not tax advice; consult a CPA.
Schools (NCES district)
- District
- Muncie Community Schools
- NCES district ID
- 1807320
- Math proficiency
- 18% ▼ -9.00%
- Reading proficiency
- 25% ▼ -4.00%
- Median HH income
- $30,052
- Composite
- 17.22/100
- National rank
- #9099
- State rank
- #275 of 301 in IN
Livability — Muncie
- Score
- 80/100
- State rank
- #18
- US rank
- #1654
Category grades
Schools grade is shown separately in the Schools card above.
Census & demographics
- Census place
- Muncie, IN
- County
- Delaware County · 84,658 people
- City population
- 84,658
- Metro
- Muncie, IN
- Population (ZIP)
- 24,392
- Household income
- $47,674
- Rent vs Own
- Severe rent burden
- 1434.0
Population outlook (Delaware County) Hauer SSP2
- Today (2025)
- 113,036 people
- By 2030
- 111,313 · -1.5%
- By 2040
- 106,432 · -5.8%
- By 2050
- 100,747 · -10.9%
- By 2075
- 91,000 · -19.5%
- By 2100
- 80,687 · -28.6%
Race, ethnicity, and origin ACS 2023
- Neighborhood character
- Predominantly White (82%)
- Race & ethnicity
- White 82% Black 9% Two or more races 5% Hispanic / Latino 3%
- Common ancestry
- Italian 4% Slovak 3% Lithuanian 2%
- Foreign-born
- 2% · Canada
- Languages at home
- 97% English-only · Spanish 1%
Political lean MEDSL · Delaware
- 2024 margin
- R (+15.8) · D 41.2% · R 57.0% · Other 1.8%
- 2008→2024 swing
- -30.8pp toward R · 2008: 15.0pp · 2024: -15.8pp
- All cycles
- 2024: R+15.8 2020: R+13.2 2016: R+13.7 2012: D+3.1 2008: D+15.0
Not yet ingested
- Civics
- —
Market trends
- HPI YoY
- ▼ -50.45%
- Current HPI
- 229.8654
- Rent YoY
- ▲ 7.80%
- Metro
- Muncie, IN
- State GDP YoY
- ▲ 2.90%
- F500 in state
- 18
Industry mix (Fortune 500 HQ in IN)
| Industry | F500 HQs | Revenue |
|---|---|---|
| Industrial Machinery | 2 | $37B |
|
||
| Healthcare | 1 | $177B |
|
||
| Pharmaceuticals | 1 | $45B |
|
||
| Metals / Steel | 1 | $18B |
|
||
| Agriculture | 1 | $17B |
|
||
| Packaging | 1 | $12B |
|
||
Price history
-37.5% since first listed4 events — show timeline
- 2026-03-27 Listed $79,900 IRMLS
- 2026-03-27 Listed $79,900 MIBOR as Distributed by MLS Grid
- 2017-01-26 Listed $22,500 IRMLS
- 2016-04-04 Listed $127,900 IRMLS
Property tax history
-3.9%/yrLatest (2024): $1,042 · +25.5% YoY. Source: county tax records.
Cash-flow waterfall
monthlySold comps — $/sqft
last 12 mo · ≤1 miLoading sold comps…