1514 Mainsail Dr #4 · Marco Shores-Hammock Bay, FL
Flood risk 9/10 · Severe
- FEMA flood zone
- AE
- Chance of flooding over 30 yrs
- 0.99%
- Est. flood insurance / yr
- $1,737 – $8,500
Fire risk 4/10 · Minor
- Est. fire insurance / yr
- $947 – $1,759
Heat risk 10/10 · Severe
- Hot days now (above 107°F)
- 7 days/yr
- Hot days in 30 yrs
- 30 days/yr
Wind risk 10/10 · Severe
- Chance of severe wind over 30 yrs
- 99.0%
Air-quality risk 3/10 · Minor
- Unhealthy air days now
- 3 days/yr
- Unhealthy air days in 30 yrs
- 3 days/yr
Risk factors via First Street. Map © Google.
Why this score? — see what drove the C- grade
The composite is a weighted blend of 9 inputs, each scored 0–100. Each bar is that input's sub-score; the figure is the points it added to the 100-point composite (weight × sub-score).
- Cash flow +15.2/30.0
- ARV discount +7.5/15.0
- 1% rule +5.6/10.0
- Schools +5.0/10.0
- DSCR +4.7/10.0
- Appreciation +4.3/10.0
- Rent growth +3.3/5.0
- Livability +2.5/5.0
- Condition / age +2.5/5.0
$259,900
🖨 Deal sheet 📄 Offer letter ✓ Due diligence
Listing remarks
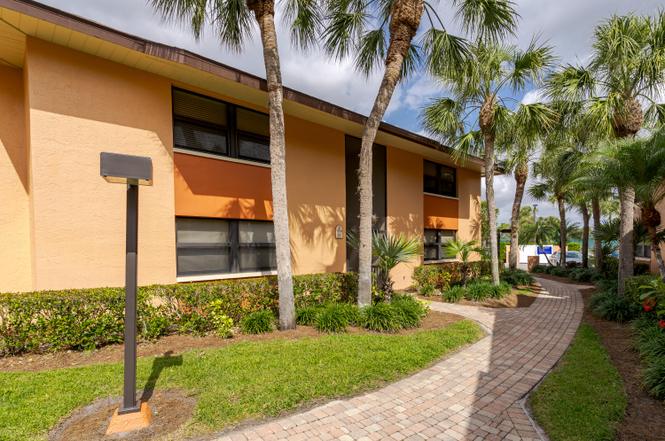
Beautiful second floor condo at Tropic Schooner with views of the pool area and furnished with a tropical flair. The kitchen features white cabinets and appliances plus a breakfast nook to enjoy your morning coffee. Move in ready. There are two bedrooms, two bathrooms, a utility area with washer and dryer plus a large storage closet. BRAND NEW AC installed in 2026. Tropic Schooner offers tennis, pickleball, bocce, a community room with gas grills and car wash area, and two lovely pool areas. Tropic Schooner is located close to The Isle of Capri, Marco Island, and minutes away from all the activities of Naples. You will have no shortage of restaurants, beaches, shopping, and entertainment
Key facts
- Breakfast nook
- Large storage closet
- Utility area
Tags
Property features AI
Finance
- HOA & community: Monthly condo fee of $435; Annual recurring HOA fees approximately $5,220; One-time fees approximately $375; Professional management; HOA maintenance covers insurance, irrigation water, lawn/land maintenance, legal/accounting, manager, exterior pest control, and reserves; Community amenities include BBQ/picnic area, bike and jog path, bocce court, community pool, internet access, pickleball, sidewalks, and tennis courts; Non-gated community
Exterior
- Parking: See remarks for building/parking details
- Security: Impact resistant doors and windows
- Utilities: Central water; Central sewer; Cable available
- Home design: Residential low-rise (1-3 stories); Built in 1983; Rear exposure to the west; Located in Marco Shores development
- Construction: Concrete block construction; Shingle roof
- Exterior features: Screened lanai/porch; Stucco exterior; Impact resistant windows and doors; Sliding windows; Pool/club view; Lake/canal irrigation
Interior
- Kitchen: Dishwasher; Disposal; Microwave; Range; Refrigerator; Pantry
- Bedrooms: 2 bedrooms
- Flooring: Laminate; Tile
- Bathrooms: 2 full bathrooms; Master bathroom with combo tub and shower
- Heating & cooling: Central electric heat; Central electric cooling; Ceiling fans; Humidistat
- Interior features: Cable prewire; High-speed internet available; Pantry; Smoke detectors; Walk-in closet; Window coverings; Great room floor plan; Partially furnished
- Laundry & utility: Washer and dryer in unit; Laundry in residence
Neighborhood map
What this means for you Summary
Snapshot
- This is a 2-bed/2.0-bath condo listed at $260k.
Deal economics
- At list price, monthly cash flow is $-337 ($-4k/yr) — negative.
- To cash-flow at today's rent, offer at most $200k (22.9% below list).
- Meets the 1% rule at list price ($3k rent vs $260k).
- Recommended offer: $200k (22.9% below list) — sets the bar for cash-flow.
Location & tenants
- Location reads: area grade C — affects rentability + tenant quality, not the cash-flow math above.
- Collier (suburban): math 60% / reading 56% proficiency, ranked #16 of 73 in FL (top 22%) — acceptable for families but not a draw, mixed tenant base, ~2y average lease.
- Market conditions: Rents rising (+3.2%/yr); 900 active listings in the ZIP; 8 comparable units currently listed for rent nearby; rentals at typical pace (median 21d on market — plan ~3-4 weeks tenant-placement turnaround); solid renter incomes; 3,520 units permitted in Collier County in 2024 (959 in 5+ unit buildings).
- This rent runs 37% of the median local income ($89k/yr) — at the standard rent-burdened threshold; future hikes will face affordability resistance.
Forward outlook
- Local home prices are declining (-1.5%/yr); year-one equity from $2k of loan paydown is wiped out by about $4k of value loss. Plan a longer hold.
- Collier County population projected at +30% by 2050 — long-run rental-demand tailwind backs the buy-and-hold thesis.
Negotiation context
- It's been on market 117 days — a 9% lower offer ($237k) is reasonable based on typical stale-listing flexibility.
- Current owner paid $93k; list at $260k implies a 179% gain — meaningful room to come down on a strong offer.
Risks & watch-outs
- Watch-outs: flood insurance adds $427/mo.
- Climate carrying-cost: in FEMA flood zone AE (mandatory federal flood insurance); severe wind risk, 99% chance of damaging wind over 30y; extreme-heat days projected 7→30/yr by 2055 (HVAC capex compounding) — expect insurance premiums to compound above CPI over the hold.
Questions for the listing agent
- What do current leases actually rent for vs. the listed asking? Can we see a recent rent roll and the last 12 months of T-12 income?
- It's been on market 117 days. Have you received any prior offers? Is the seller open to a 23% concession, seller financing, or rate buy-down credit?
- What's the actual annual flood-insurance premium (NFIP or private), and is the property in a SFHA with mandatory coverage?
- What does the HOA fee cover, when was the last increase, and are there any pending special assessments or reserve-fund shortfalls?
- Any open or pending special assessments — roof, HVAC, plumbing, elevator, façade? What's the per-unit balance and payoff schedule, and is the seller paying it off at close or rolling it to the buyer?
- Why hasn't it sold? Are there any deal-killer items the seller is aware of (foundation, flood, title, zoning, code violations)?
- Is there a deadline driving the sale (1031 exchange, divorce, estate, relocation)? That informs how much negotiation room exists.
- What's the average days-on-market for RENTAL listings here right now (not sales)? A rising rental-DOM trend means longer vacancies and softer asking-rent achievability than the comps imply.
- What's the recent tenant-quality profile in this submarket — average credit score on applications, eviction rate, late-payment / NSF rate, and stable-employment percentage? A property-management company in the area should have these aggregated.
- How much new apartment / multifamily construction is in the pipeline within 1–3 miles? Heavy new supply (>2% of stock underway) typically softens rents 12–24 months out; light construction supports rent growth.
Investment metrics
- 1% rule
- 1.06% ✓
- Cap rate
- 6.71%
- Cash-on-cash
- 1.48%
- DSCR
- 1.07
- GRM
- 7.8
CMA / ARV
No comps found within radius.
Projected returns pro-forma
-1.48% appreciation · 3.21% rent growth · sell at horizon
- IRR
- -15.2%
- Equity multiple
- 0.37×
- Total profit
- $-45,526
- Equity at exit
- $56,792
- IRR
- -7.7%
- Equity multiple
- 0.35×
- Total profit
- $-47,320
- Equity at exit
- $54,706
Cash invested: $72,772 (down + closing). Projections, not guarantees.
Landlord ↔ Tenant lean methodology
- Overall (STATE)
- 87 Strongly Landlord-Friendly
- State Florida
- 87 Strongly Landlord-Friendly · R+3
- County
- — inherits STATE
- City
- — inherits STATE
ZIP-level market 34114
- Home prices YoY
- -0.6%
- Rents YoY
- 3.2%
- Active inventory
- 900
- Price-to-rent
- 7.8×
Monthly cashflow live
- Estimated rent
- $2,768 high interval (Pro) →
- Mortgage (P&I)
- −$1,363
- Tax from tax record
- −$190 /mo · $2,284/yr
- Insurance
- −$108
- Flood insurance flood zone
- −$427 /mo · $5,118/yr
- HOA
- −$435
- Vacancy / Maint / Mgmt
- −$581
- Net cashflow
- $-337
Break-even live
UW: 25.0% down · 7.5% · 30yr · 1.5% tax · 5.0% vac · 8.0% maint · 8.0% mgmt
Financing live
Cash to close
- Down payment
- $64,975
- Closing costs
- $7,797
- Reserves months
- —
- Total cash needed
- —
Loan-product check · same deal, 3 products live
Conventional
25% down · 7.5% · 30yr
- Down + closing
- —
- Monthly P&I
- —
- Monthly cashflow
- —
- DSCR
- —
- Eligible?
- —
Personal DTI + credit; lowest rate.
DSCR
20% down · 8.5% · 30yr
- Down + closing
- —
- Monthly P&I
- —
- Monthly cashflow
- —
- DSCR
- —
- Eligible?
- —
No personal income docs; deal must DSCR.
Hard money
10% down · 12.0% · 12mo
- Down + closing
- —
- Monthly P&I
- —
- Monthly cashflow
- —
- DSCR
- —
- Eligible?
- —
Short-term bridge; refi at stabilization.
Rent comps 8 comps
| Address | Beds | Baths | Sqft | Rent | $/sqft | DOM | Units | Dist |
|---|---|---|---|---|---|---|---|---|
| 1510 Mainsail Dr #7 Naples, FL | 2.0 | 2.0 | 966 | $4,500 | $4.66 | 13d | 1 | 0.03mi |
| 1516 Mainsail Dr #2 Naples, FL | 2.0 | 2.0 | 966 | $1,900 | $1.97 | 13d | 1 | 0.04mi |
| 1522 Mainsail Dr #2 Naples, FL | 2.0 | 2.0 | 900 | $1,895 | $2.11 | 13d | 1 | 0.09mi |
| 1315 Mainsail Dr Naples, FL | 2.0 | 2.0 | 828 | $2,075 | $2.51 | 13d | 2 | 0.35mi |
| 1315 Mainsail Dr Naples, FL | 2.0 | 2.0 | 828 | $2,075 | $2.51 | 23d | 2 | 0.35mi |
| 1305 Mainsail Dr Naples, FL | 2.0 | 2.0 | 871 | $1,912 | $2.19 | 21d | 2 | 0.41mi |
| 1305 Mainsail Dr Naples, FL | 2.0 | 2.0 | 925 | $1,862 | $2.01 | 23d | 2 | 0.41mi |
| 1165 Mainsail Dr #603 Naples, FL | 2.0 | 2.0 | 843 | $3,000 | $3.56 | 23d | 1 | 0.51mi |
HOA detail condo
- Monthly dues
- $435 · $5,220/yr
- Likely covers
- gaspool
- Assessments
- None detected in remarks — confirm with the listing agent.
Listing history 12 events
-
2026-06-18days on market $259,900 Active 117 DOM
-
2026-06-17days on market $259,900 Active 116 DOM
-
2026-06-16days on market $259,900 Active 115 DOM
-
2026-06-15days on market $259,900 Active 114 DOM
-
2026-06-14days on market $259,900 Active 112 DOM
-
2026-06-10days on market $259,900 Active 109 DOM
-
2026-06-09days on market $259,900 Active 108 DOM
-
2026-06-08days on market $259,900 Active 107 DOM
-
2026-06-07days on market $259,900 Active 106 DOM
-
2026-06-03days on market $259,900 Active 102 DOM
-
2026-06-03remarks 699-char remark
-
2026-06-03$259,900 Active 101 DOM
ⓘ Source: listings_history table (triggers on properties + properties_extension) + one-shot
backfill from property_details.listing_events for pre-trigger history.
Tax reassessment forecast FL · Resets to sale price
- Current annual tax
- $2,284 · $190/mo
- Projected year-2 tax
- $2,284 · $190/mo
- Expected delta
- $0/yr ($0/mo · 0.0%)
ⓘ Screening estimate from a state-policy table — verify with the county assessor before closing.
Climate risk First Street
- Flood 9/10 Extreme FEMA zone AE · 99% chance over 30 yrs
- Wildfire 4/10 Moderate
- Heat 10/10 Extreme 7 d/yr ≥107°F today · 30 d/yr by 30 yrs out
- Wind 10/10 Extreme 99% chance of damaging wind over 30 yrs
- Air quality 3/10 Moderate 3 unhealthy d/yr today · 3 by 30 yrs out
Nearby sold comps map
Loading sold comps map…
Walkable amenities ~0.75 mi
Loading nearby amenities…
Taxation est. · year 1
- Rental income
- $33,212
- − Mortgage interest
- −$14,558
- − Property taxes
- −$2,284
- − Insurance
- −$6,418
- − Repairs & maintenance
- −$2,657
- − Management
- −$2,657
- − HOA
- −$5,220
- − Depreciation
- −$7,561
- Taxable loss
- −$8,143
- Est. tax savings @ 24.0%
- +$1,954
- After-tax cash flow
- $-2,086/yr
For passive investors: Depreciation is non-cash, so a rental often shows a tax loss while cash-flowing — sheltering income. Rental losses are passive: they offset passive income freely, and up to $25,000/yr can offset ordinary (W-2) income if you actively participate and your MAGI is under $100k (phasing out to $0 by $150k); unused losses carry forward. On sale, claimed depreciation is recaptured at up to 25%, and gains may owe capital-gains tax (a 1031 exchange can defer both). Figures are a year-1 estimate at your 24.0% rate — not tax advice; consult a CPA.
Schools (NCES district)
- District
- Collier
- NCES district ID
- 1200330
- Math proficiency
- 60% ▼ -4.00%
- Reading proficiency
- 56% ▼ -2.00%
- Median HH income
- $58,275
- Composite
- 50.23/100
- National rank
- #1892
- State rank
- #16 of 73 in FL
Livability — Marco Shores-Hammock Bay
No livability data for this city. (Only ~50 U.S. cities are tracked.)
Census & demographics
- Census place
- Marco Shores-Hammock Bay, FL
- County
- Collier County · 396,295 people
- Metro
- Naples-Marco Island, FL
- Population (ZIP)
- 23,559
- Household income
- $89,334
- Rent vs Own
- Severe rent burden
- 550.0
Population outlook (Collier County) Hauer SSP2
- Today (2025)
- 420,858 people
- By 2030
- 450,054 · +6.9%
- By 2040
- 502,232 · +19.3%
- By 2050
- 544,932 · +29.5%
- By 2075
- 627,203 · +49.0%
- By 2100
- 659,015 · +56.6%
Race, ethnicity, and origin ACS 2023
- Neighborhood character
- Predominantly White (72%)
- Race & ethnicity
- White 72% Hispanic / Latino 17% Two or more races 13% Black 7%
- Hispanic origin (detail)
- Mexican 7% Puerto Rican 1% Cuban 3%
- Common ancestry
- Hispanic 5% Romanian 4% Lithuanian 1%
- Foreign-born
- 21% · Canada, Jamaica
- Languages at home
- 75% English-only · Spanish 15% French/Haitian/Cajun 5% Other Indo-European 4%
Political lean MEDSL · Collier
- 2024 margin
- Solid R (+33.1) · D 33.1% · R 66.2%
- 2008→2024 swing
- -10.6pp toward R · 2008: -22.5pp · 2024: -33.1pp
- All cycles
- 2024: R+33.1 2020: R+24.7 2016: R+26.0 2012: R+30.1 2008: R+22.5
Not yet ingested
- Civics
- —
Market trends
- HPI YoY
- ▼ -1.48%
- Current HPI
- 266.5545
- Rent YoY
- ▲ 3.21%
- Metro
- Naples-Marco Island, FL
- State GDP YoY
- ▲ 3.28%
- F500 in state
- 36
Industry mix (Fortune 500 HQ in FL)
| Industry | F500 HQs | Revenue |
|---|---|---|
| Industrial Technology | 2 | $29B |
|
||
| Insurance | 2 | $17B |
|
||
| Retail | 1 | $60B |
|
||
| Technology Distribution | 1 | $58B |
|
||
| Homebuilding | 1 | $35B |
|
||
| Technology Manufacturing | 1 | $35B |
|
||
Price history
+242.4% since first listed5 events — show timeline
- 2026-03-16 Price Changed $259,900 NAPLESMLS
- 2026-02-21 Listed $279,900 NAPLESMLS
- 2001-03-07 Sold (Public Records) $93,000 Public Records
- 1998-07-13 Sold (Public Records) $57,500 Public Records
- 1986-03-01 Sold (Public Records) $75,900 Public Records
Property tax history
+19.5%/yrLatest (2025): $2,284 · +464.4% YoY. Source: county tax records.
Cash-flow waterfall
monthlySold comps — $/sqft
last 12 mo · ≤1 miLoading sold comps…