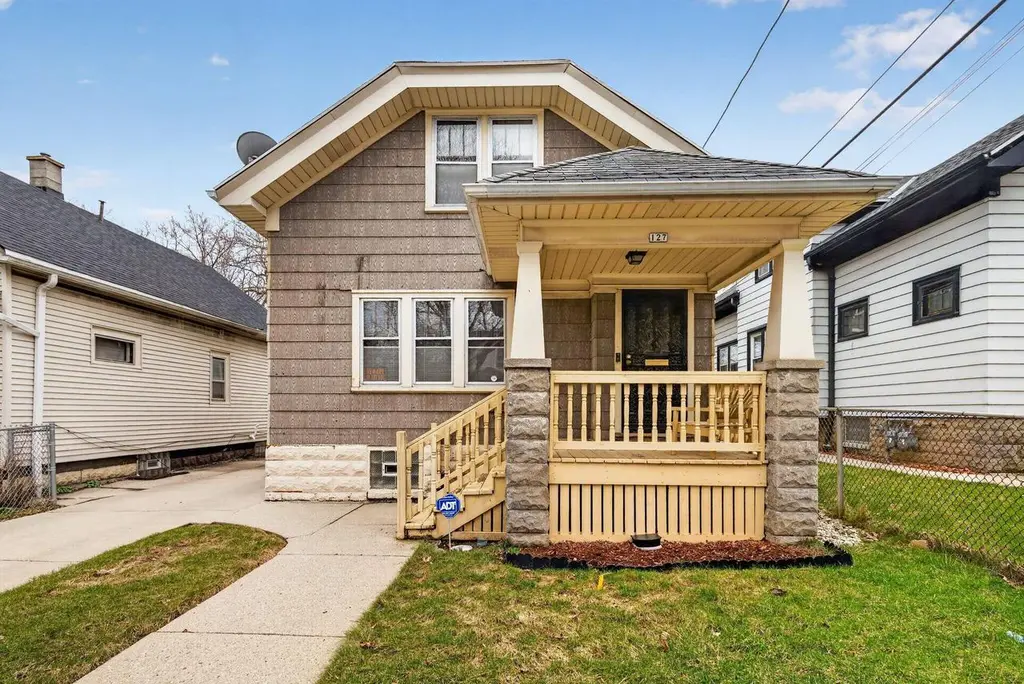
127 W Ring St · Milwaukee, WI
Flood risk 1/10 · Minimal
- FEMA flood zone
- X (unshaded)
- Chance of flooding over 30 yrs
- 0.0%
- Est. flood insurance / yr
- $473 – $860
Fire risk 1/10 · Minimal
- Est. fire insurance / yr
- $636 – $1,182
Heat risk 2/10 · Minimal
- Hot days now (above 98°F)
- 7 days/yr
- Hot days in 30 yrs
- 13 days/yr
Wind risk 2/10 · Minimal
- Chance of severe wind over 30 yrs
- —
Air-quality risk 3/10 · Minor
- Unhealthy air days now
- 3 days/yr
- Unhealthy air days in 30 yrs
- 4 days/yr
Risk factors via First Street. Map © Google.
Why this score? — see what drove the B- grade
The composite is a weighted blend of 9 inputs, each scored 0–100. Each bar is that input's sub-score; the figure is the points it added to the 100-point composite (weight × sub-score).
- Cash flow +30.0/30.0
- DSCR +10.0/10.0
- 1% rule +8.8/10.0
- ARV discount +7.5/15.0
- Livability +4.0/5.0
- Rent growth +3.8/5.0
- Condition / age +2.5/5.0
- Schools +1.2/10.0
- Appreciation +0.0/10.0
$165,000
🖨 Deal sheet 📄 Offer letter ✓ Due diligence
Listing remarks
Welcome home to a charming and beautifully maintained home nestled in the heart of Milwaukee! This spacious property is packed with character and offers plenty of room for a large family to spread out and truly make it their own. The standout feature is two full kitchens, perfect for multigenerational living, entertaining, or even generating rental income. From the moment you walk in you will feel the warmth and care that has gone into maintaining this home over the years. Classic charm meets everyday functionality in this rare find. Do not miss your chance to own a one of a kind Milwaukee property. Schedule your showing today!
Key facts
- Two full kitchens
- 3,920 sq ft lot
- Garage
Tags
Property features AI
Finance
- Other: All appliances included; Seller personal property excluded
- Financial info:
- HOA & community:
Exterior
- Parking: Detached 1-car garage
- Security:
- Utilities: Municipal water; Municipal sewer; Natural gas; Electric service
- Home design: Two-story single-family home; Entry level information not provided; Zoning: RT4
- Construction: Wood exterior; Year built: Assessor/Public Record
- Exterior features: Deck; Patio; Fenced yard; Sidewalks
Interior
- Kitchen: Cooktop; Oven; Microwave; Dishwasher; Refrigerator
- Bedrooms:
- Flooring: Wood floors
- Bathrooms: Three full bathrooms with combinations of tub only, shower over tub, and separate shower stall
- Heating & cooling: Forced air heating; Central air; Natural gas heating
- Interior features: Walk-in closets; Wood floors
- Laundry & utility: Washer; Dryer
Neighborhood map
What this means for you Summary
Snapshot
- This is a 6-bed/2.0-bath single-family listed at $165k.
Deal economics
- At list price, monthly cash flow is $686 ($8k/yr) — positive.
- The deal already cash-flows at list — no discount required.
- Meets the 1% rule at list price ($2k rent vs $165k).
- Recommended offer: $160k (3.0% below list) — sets the bar for market timing.
- Cap rate 11.3% vs local median 5.1% in Milwaukee — top-decile yield for the area; either an underpriced asset or a hidden risk that comps aren't pricing in. Stress-test before assuming the spread holds.
Location & tenants
- Location reads 81/100 on livability (#55 in WI, #1,534 nationally) — a professional / high-income tenant draw. Strengths: amenities A+, commute A+, cost of living A+; Watch: employment D+, schools F, crime F.
- Milwaukee School District (urban): math 10% / reading 18% proficiency, ranked #337 of 342 in WI (top 98%) — low school quality limits family demand, transient renter base, plan for 1-2y turnover; 77% free/reduced lunch — lower-income household profile, screen leases tightly.
- Market conditions: Rents rising fast (+5.0%/yr); 129 active listings in the ZIP; 1 comparable units currently listed for rent nearby; 1,017 units permitted in Milwaukee County in 2024 (803 in 5+ unit buildings).
- At $2,278/mo this rent would consume 58% of the median local household income ($47k/yr) (locally 2397% of renters already pay >50% of income on rent) — very limited rent-growth headroom before tenants either downsize or default.
Forward outlook
- Local home prices are declining (-3.0%/yr); year-one equity from $1k of loan paydown is wiped out by about $5k of value loss. Plan a longer hold.
- Milwaukee County population projected at +4% by 2050 — modest demand growth; plan on rents tracking national, not racing it.
- At projected returns (-3.0% appreciation + 5.0% rent growth), your $46k cash investment doubles in ~6 years — after that, you're playing with house money.
Negotiation context
- It's been on market 35 days — a 3% lower offer ($160k) is reasonable based on typical stale-listing flexibility.
Risks & watch-outs
- Watch-outs: built in 1923 — expect roof / HVAC / electrical / plumbing capex.
Questions for the listing agent
- It's been on market 35 days. Have you received any prior offers? Is the seller open to a 3% concession, seller financing, or rate buy-down credit?
- Built in 1923 — when were the roof, HVAC, electrical panel, plumbing, and water heater last replaced?
- Is there a deadline driving the sale (1031 exchange, divorce, estate, relocation)? That informs how much negotiation room exists.
- Schools are F-rated, which usually means shorter tenancies and higher turnover. Who's the typical renter profile here, and what's been the actual vacancy rate?
- Crime grade is F in this area — have there been break-ins, vandalism, or insurance claims at this property in the last 3 years? What carrier currently insures it and at what premium?
- What's the average days-on-market for RENTAL listings here right now (not sales)? A rising rental-DOM trend means longer vacancies and softer asking-rent achievability than the comps imply.
- What's the recent tenant-quality profile in this submarket — average credit score on applications, eviction rate, late-payment / NSF rate, and stable-employment percentage? A property-management company in the area should have these aggregated.
- How much new for-sale + rental construction is in the pipeline within 1–3 miles? Heavy new supply typically softens prices + rents 12–24 months out; constrained supply supports both.
Investment metrics
- 1% rule
- 1.38% ✓
- Cap rate
- 11.28%
- Cash-on-cash
- 17.81%
- DSCR
- 1.79
- GRM
- 6.0
CMA / ARV
- ARV (median comp)
- $101,352
- List price
- $165,000
- Delta
- 62.80%
- Verdict
- OVERPRICED
- Comps
- 20 within 1.0 mi
Show comp detail 10 sales within ~0.75 mi
| Address | Dist | Beds/Ba | Sqft | Sold | Price | $/sf | Match |
|---|---|---|---|---|---|---|---|
| 503 W Chambers St | 0.42mi | 5/1.5 (-1) | 1,791 (+2%) | 7mo | $360,000 | $201 | 65 |
| 3715 N 2nd St | 0.48mi | 5/2.0 (-1) | 1,718 (-2%) | 11mo | $197,000 | $115 | 60 |
| 3230 N 12th St | 0.72mi | 5/1.0 (-1) | 1,762 (+0%) | 4mo | $140,000 | $79 | 54 |
| 3002 N Buffum St | 0.41mi | 5/2.0 (-1) | 1,879 (+7%) | 14mo | $95,000 | $51 | 52 |
| 2863 N Dr William Finlayson St | 0.53mi | 6/2.0 | 1,574 (-10%) | 10mo | $10,000 | $6 | 49 |
| 2863 N Richards St #2857 | 0.50mi | 5/1.5 (-1) | 1,640 (-7%) | 14mo | $165,000 | $101 | 46 |
| 3634 N 9th St | 0.70mi | 5/3.0 (-1) | 1,887 (+7%) | 7mo | $169,000 | $90 | 40 |
| 2846 N Vel R Phillips Ave | 0.51mi | 5/4.0 (-1) | 1,931 (+10%) | 13mo | $245,000 | $127 | 36 |
| 3834 N Dr William Finlayson St | 0.66mi | 5/2.5 (-1) | 1,676 (-5%) | 23mo | $218,450 | $130 | 36 |
| 3118 N 12th St | 0.73mi | 5/2.0 (-1) | 1,563 (-11%) | 11mo | $60,000 | $38 | 33 |
Match score weights: distance 35% · size 25% · config 20% · recency 20%. Top-matched comps best support the ARV.
Projected returns pro-forma
-3.0% appreciation · 5.0% rent growth · sell at horizon
- IRR
- 11.5%
- Equity multiple
- 1.47×
- Total profit
- $21,630
- Equity at exit
- $24,602
- IRR
- 22.1%
- Equity multiple
- 3.06×
- Total profit
- $95,134
- Equity at exit
- $14,266
Cash invested: $46,200 (down + closing). Projections, not guarantees.
Landlord ↔ Tenant lean methodology
- Overall (STATE)
- 73 Landlord-Friendly
- State Wisconsin
- 73 Landlord-Friendly · R+2
- County
- — inherits STATE
- City
- — inherits STATE
ZIP-level market 53212
- Rents YoY
- 5.0%
- Active inventory
- 129
- Price-to-rent
- 6.0×
Monthly cashflow live
- Estimated rent
- $2,278 medium interval (Pro) →
- Mortgage (P&I)
- −$865
- Tax from tax record
- −$180 /mo · $2,161/yr
- Insurance
- −$69
- HOA
- −$0
- Vacancy / Maint / Mgmt
- −$478
- Net cashflow
- $686
Break-even live
UW: 25.0% down · 7.5% · 30yr · 1.5% tax · 5.0% vac · 8.0% maint · 8.0% mgmt
Financing live
Cash to close
- Down payment
- $41,250
- Closing costs
- $4,950
- Reserves months
- —
- Total cash needed
- —
Loan-product check · same deal, 3 products live
Conventional
25% down · 7.5% · 30yr
- Down + closing
- —
- Monthly P&I
- —
- Monthly cashflow
- —
- DSCR
- —
- Eligible?
- —
Personal DTI + credit; lowest rate.
DSCR
20% down · 8.5% · 30yr
- Down + closing
- —
- Monthly P&I
- —
- Monthly cashflow
- —
- DSCR
- —
- Eligible?
- —
No personal income docs; deal must DSCR.
Hard money
10% down · 12.0% · 12mo
- Down + closing
- —
- Monthly P&I
- —
- Monthly cashflow
- —
- DSCR
- —
- Eligible?
- —
Short-term bridge; refi at stabilization.
Rent comps 1 comps
| Address | Beds | Baths | Sqft | Rent | $/sqft | DOM | Units | Dist |
|---|---|---|---|---|---|---|---|---|
| 2634 N Doctor M.L.K. Jr Dr Milwaukee, WI | 5.0 | 2.5 | 2512 | $3,700 | $1.47 | 43d | 1 | 0.73mi |
Listing history 16 events
-
2026-06-18price $165,000 Active 35 DOM
-
2026-06-18days on market $175,000 Active 35 DOM
-
2026-06-17days on market $175,000 Active 34 DOM
-
2026-06-16days on market $175,000 Active 33 DOM
-
2026-06-15days on market $175,000 Active 32 DOM
-
2026-06-13days on market $175,000 Active 30 DOM
-
2026-06-13pricedays on market $175,000 Active 29 DOM
-
2026-06-09days on market $180,000 Active 26 DOM
-
2026-06-08days on market $180,000 Active 25 DOM
-
2026-06-07pricedays on market $180,000 Active 24 DOM
-
2026-06-05days on market $185,000 Active 21 DOM
-
2026-06-03days on market $185,000 Active 20 DOM
-
2026-06-02days on market $185,000 Active 19 DOM
-
2026-06-01days on market $185,000 Active 18 DOM
-
2026-05-31days on market $185,000 Active 17 DOM
-
2026-05-14$195,000 Active 635-char remark
ⓘ Source: listings_history table (triggers on properties + properties_extension) + one-shot
backfill from property_details.listing_events for pre-trigger history.
Tax reassessment forecast WI · Partial reset (capped growth)
- Current annual tax
- $2,161 · $180/mo
- Projected year-2 tax
- $2,607 · $217/mo
- Expected delta
- +$446/yr (+$37/mo · 20.6%)
ⓘ Screening estimate from a state-policy table — verify with the county assessor before closing.
Climate risk First Street
- Flood 1/10 Low FEMA zone X (unshaded) · 0% chance over 30 yrs
- Wildfire 1/10 Low
- Heat 2/10 Low 7 d/yr ≥98°F today · 13 d/yr by 30 yrs out
- Wind 2/10 Low
- Air quality 3/10 Moderate 3 unhealthy d/yr today · 4 by 30 yrs out
Nearby sold comps map
Loading sold comps map…
Walkable amenities ~0.75 mi
Loading nearby amenities…
Taxation est. · year 1
- Rental income
- $27,339
- − Mortgage interest
- −$9,243
- − Property taxes
- −$2,161
- − Insurance
- −$825
- − Repairs & maintenance
- −$2,187
- − Management
- −$2,187
- − Depreciation
- −$4,800
- Taxable income
- $5,936
- Est. tax owed @ 24.0%
- −$1,425
- After-tax cash flow
- $6,804/yr
For passive investors: Depreciation is non-cash, so a rental often shows a tax loss while cash-flowing — sheltering income. Rental losses are passive: they offset passive income freely, and up to $25,000/yr can offset ordinary (W-2) income if you actively participate and your MAGI is under $100k (phasing out to $0 by $150k); unused losses carry forward. On sale, claimed depreciation is recaptured at up to 25%, and gains may owe capital-gains tax (a 1031 exchange can defer both). Figures are a year-1 estimate at your 24.0% rate — not tax advice; consult a CPA.
Schools (NCES district)
- District
- Milwaukee School District
- NCES district ID
- 5509600
- Math proficiency
- 10% ▼ -5.00%
- Reading proficiency
- 18% ▬ 0.00%
- Median HH income
- $36,339
- Composite
- 11.61/100
- National rank
- #9696
- State rank
- #337 of 342 in WI
Livability — Milwaukee
- Score
- 81/100
- State rank
- #55
- US rank
- #1534
Category grades
Schools grade is shown separately in the Schools card above.
Census & demographics
- Census place
- Milwaukee, WI
- County
- Milwaukee County · 926,379 people
- City population
- 573,768
- Metro
- Milwaukee-Waukesha, WI
- Population (ZIP)
- 28,938
- Household income
- $47,298
- Rent vs Own
- Severe rent burden
- 2397.0
Population outlook (Milwaukee County) Hauer SSP2
- Today (2025)
- 995,758 people
- By 2030
- 1,009,124 · +1.3%
- By 2040
- 1,028,128 · +3.3%
- By 2050
- 1,040,066 · +4.4%
- By 2075
- 1,057,849 · +6.2%
- By 2100
- 1,039,774 · +4.4%
Race, ethnicity, and origin ACS 2023
- Neighborhood character
- Diverse neighborhood (Simpson 0.64)
- Race & ethnicity
- Black 48% White 35% Hispanic / Latino 12% Two or more races 9%
- Hispanic origin (detail)
- Mexican 4% Puerto Rican 6%
- Common ancestry
- Romanian 4% Portuguese 2% Italian 2%
- Foreign-born
- 2% · Canada
- Languages at home
- 92% English-only · Spanish 6%
Political lean MEDSL · Milwaukee
- 2024 margin
- Solid D (+38.5) · D 68.3% · R 29.8% · Other 1.8%
- 2008→2024 swing
- +2.7pp toward D · 2008: 35.9pp · 2024: 38.5pp
- All cycles
- 2024: D+38.5 2020: D+39.9 2016: D+37.5 2012: D+34.6 2008: D+35.9
Not yet ingested
- Civics
- —
Market trends
- HPI YoY
- ▼ -216.73%
- Current HPI
- 385.8225
- Rent YoY
- ▲ 5.00%
- Metro
- Milwaukee-Waukesha, WI
- State GDP YoY
- ▲ 2.10%
- F500 in state
- 20
Industry mix (Fortune 500 HQ in WI)
| Industry | F500 HQs | Revenue |
|---|---|---|
| Industrial Machinery | 4 | $23B |
|
||
| Industrial Technology | 2 | $36B |
|
||
| Insurance | 1 | $36B |
|
||
| Professional Services | 1 | $19B |
|
||
| Utilities | 1 | $9B |
|
||
| Consumer Goods | 1 | $3B |
|
||
Price history
-10.3% since first listed5 events — show timeline
- 2026-06-11 Price Changed $175,000 METROMLS
- 2026-06-05 Price Changed $180,000 METROMLS
- 2026-05-29 Price Changed $185,000 METROMLS
- 2026-05-22 Price Changed $190,000 METROMLS
- 2026-05-14 Listed $195,000 METROMLS
Property tax history
+7.5%/yrLatest (2024): $2,161 · +7.0% YoY. Source: county tax records.
Cash-flow waterfall
monthlySold comps — $/sqft
last 12 mo · ≤1 miLoading sold comps…