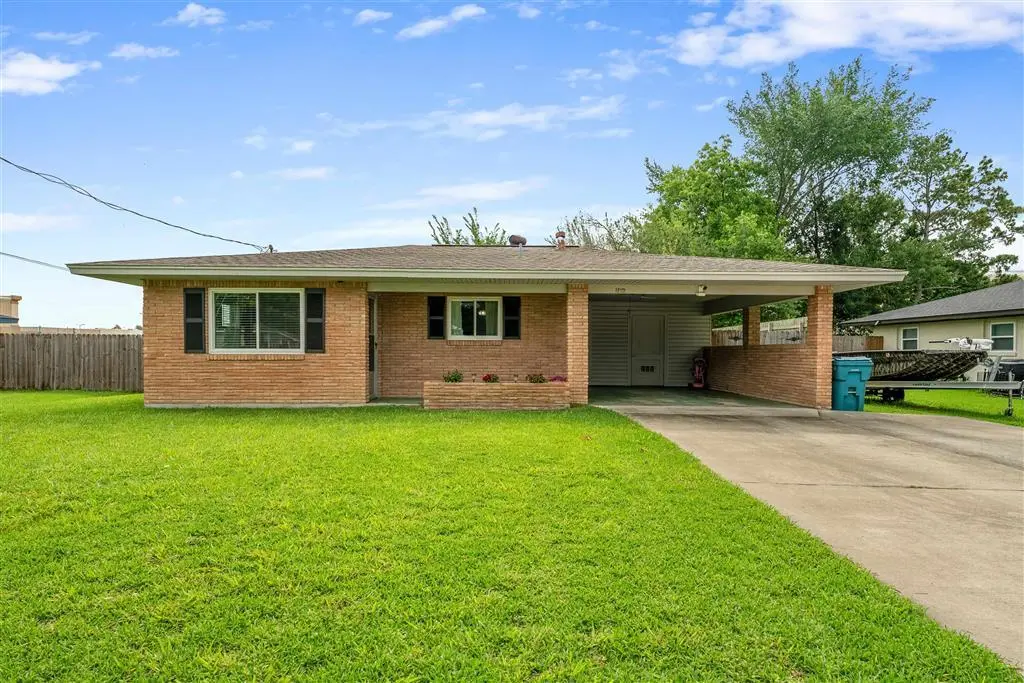
1406 Loretto Ave Ave · Sulphur, LA
Flood risk 3/10 · Minor
- FEMA flood zone
- X (unshaded)
- Chance of flooding over 30 yrs
- 0.12%
- Est. flood insurance / yr
- $507 – $1,088
Fire risk 2/10 · Minimal
- Est. fire insurance / yr
- $1,269 – $2,357
Heat risk 9/10 · Severe
- Hot days now (above 109°F)
- 7 days/yr
- Hot days in 30 yrs
- 23 days/yr
Wind risk 9/10 · Severe
- Chance of severe wind over 30 yrs
- 99.0%
Air-quality risk 2/10 · Minimal
- Unhealthy air days now
- 1 days/yr
- Unhealthy air days in 30 yrs
- 1 days/yr
Risk factors via First Street. Map © Google.
Why this score? — see what drove the C- grade
The composite is a weighted blend of 9 inputs, each scored 0–100. Each bar is that input's sub-score; the figure is the points it added to the 100-point composite (weight × sub-score).
- Cash flow +22.2/30.0
- DSCR +7.1/10.0
- 1% rule +5.0/10.0
- Rent growth +4.4/5.0
- ARV discount +3.7/15.0
- Livability +3.6/5.0
- Schools +3.1/10.0
- Condition / age +2.5/5.0
- Appreciation +0.0/10.0
$165,000
🖨 Deal sheet 📄 Offer letter ✓ Due diligence
Listing remarks MLS
Cute and well kept 3 bedroom, 1.5 bathroom home in Sulphur in the heart of Sulphur. Nice privacy fenced backyard with large oak tree for shade to enjoy. Located near schools, library, restaurants, and stores. Outside has one car carport, large back patio, and large outdoor laundry with extra storage.
Key facts
- Large covered patio
- Fenced backyard
- Sizable lot
Tags
Property features AI
Exterior
- Utilities: Public water; Public sewer; Electricity connected; Natural gas connected; Sewer connected; Water connected
- Home design: Single-story house; Single family residence; Residential property
- Exterior features: City lot; Rectangular lot; Lot dimensions approximately 70 x 143
Interior
- Bathrooms: 1 full bathroom; 1 half bathroom
- Heating & cooling: Central heating; Central air conditioning
- Interior features: No fireplace
Neighborhood map
What this means for you Summary
Snapshot
- This is a 3-bed/1.5-bath single-family listed at $165k.
Deal economics
- At list price, monthly cash flow is $268 ($3k/yr) — positive.
- The deal already cash-flows at list — no discount required.
- To meet the 1% rule (rent ≥ 1% of price), the offer needs to be $164k (0.4% below list).
- Recommended offer: $163k (1.5% below list) — sets the bar for market timing.
Location & tenants
- Location reads 71/100 on livability (#48 in LA) — a middle-class / working-renter tenant base. Strengths: cost of living A+, housing A+, schools A; Watch: crime D-, amenities F, commute F.
- Calcasieu Parish (other): math 30% / reading 44% proficiency, ranked #29 of 98 in LA (top 30%) — families likely to look elsewhere, expect single-tenant / working-renter base with shorter leases.
- Market conditions: Rents rising fast (+7.7%/yr); 291 active listings in the ZIP; 4 comparable units currently listed for rent nearby; rentals lingering (median 44d on market — plan ~5-8 weeks vacancy on turnover, expect pricing pressure); 50% of comp listings sitting > 30 days — soft ceiling on asking rent; 1,298 units permitted in Calcasieu Parish in 2024 (526 in 5+ unit buildings).
- This rent runs 30% of the median local income ($65k/yr) — at the standard rent-burdened threshold; future hikes will face affordability resistance.
Forward outlook
- Local home prices are declining (-3.0%/yr); year-one equity from $1k of loan paydown is wiped out by about $5k of value loss. Plan a longer hold.
- Calcasieu County population projected at +11% by 2050 — modest demand growth; plan on rents tracking national, not racing it.
- At projected returns (-3.0% appreciation + 7.7% rent growth), your $46k cash investment doubles in ~9 years — after that, you're playing with house money.
Negotiation context
- It's been on market 28 days — a 2% lower offer ($163k) is reasonable based on typical stale-listing flexibility.
- 3 sale attempts since 6y ago with the ask held roughly flat each time — persistent listings suggest the price (not the market) is what's stuck; bring a comps-based counter.
- Current owner paid $138k; 19% above their basis — modest negotiation headroom, anchor on the comps not their cost.
Risks & watch-outs
- Climate carrying-cost: severe wind risk, 99% chance of damaging wind over 30y; extreme-heat days projected 7→23/yr by 2055 (HVAC capex compounding) — expect insurance premiums to compound above CPI over the hold.
Questions for the listing agent
- Built in 1965 — when were the roof, HVAC, electrical panel, plumbing, and water heater last replaced?
- Is there a deadline driving the sale (1031 exchange, divorce, estate, relocation)? That informs how much negotiation room exists.
- Schools are A-rated — typically a magnet for longer-tenancy family renters. What's the average tenant stay here, and is there a school-zone premium baked into asking?
- Crime grade is D in this area — have there been break-ins, vandalism, or insurance claims at this property in the last 3 years? What carrier currently insures it and at what premium?
- What's the average days-on-market for RENTAL listings here right now (not sales)? A rising rental-DOM trend means longer vacancies and softer asking-rent achievability than the comps imply.
- What's the recent tenant-quality profile in this submarket — average credit score on applications, eviction rate, late-payment / NSF rate, and stable-employment percentage? A property-management company in the area should have these aggregated.
- How much new for-sale + rental construction is in the pipeline within 1–3 miles? Heavy new supply typically softens prices + rents 12–24 months out; constrained supply supports both.
Investment metrics
- 1% rule
- 1.00% ✗
- Cap rate
- 8.24%
- Cash-on-cash
- 6.96%
- DSCR
- 1.31
- GRM
- 8.4
CMA / ARV
- ARV (median comp)
- $152,192
- List price
- $165,000
- Delta
- 8.42%
- Verdict
- FAIR
- Comps
- 20 within 1.0 mi
Show comp detail 10 sales within ~0.75 mi
| Address | Dist | Beds/Ba | Sqft | Sold | Price | $/sf | Match |
|---|---|---|---|---|---|---|---|
| 1218 E Kent E | 0.51mi | 2/2.0 (-1) | 1,102 (-4%) | 1mo | $160,000 | $145 | 62 |
| 1201 Texas St | 0.65mi | 3/1.0 | 1,196 (+4%) | 2mo | $140,500 | $117 | 59 |
| 1310 W Kent Dr W | 0.55mi | 3/1.0 | 1,173 (+2%) | 24mo | $135,000 | $115 | 49 |
| 617 S Kent Dr S | 0.60mi | 3/1.0 | 1,160 (+1%) | 23mo | $115,000 | $99 | 49 |
| 215 Michigan Ave | 0.43mi | 3/2.0 | 1,245 (+8%) | 22mo | $140,000 | $112 | 46 |
| 701 Ginger St | 0.49mi | 3/1.0 | 1,300 (+13%) | 10mo | $155,000 | $119 | 45 |
| 1030 Gulf Ln | 0.53mi | 3/2.0 | 1,279 (+11%) | 15mo | $148,500 | $116 | 42 |
| 203 Michigan Ave | 0.44mi | 3/1.0 | 986 (-14%) | 15mo | $128,500 | $130 | 41 |
| 206 Louisiana Ave | 0.48mi | 3/1.0 | 1,025 (-11%) | 22mo | $125,000 | $122 | 39 |
| 209 Michigan Ave | 0.43mi | 3/1.0 | 1,300 (+13%) | 20mo | $168,000 | $129 | 39 |
Match score weights: distance 35% · size 25% · config 20% · recency 20%. Top-matched comps best support the ARV.
Projected returns pro-forma
-3.0% appreciation · 7.65% rent growth · sell at horizon
- IRR
- -0.9%
- Equity multiple
- 0.96×
- Total profit
- $-1,674
- Equity at exit
- $24,602
- IRR
- 12.9%
- Equity multiple
- 2.23×
- Total profit
- $56,683
- Equity at exit
- $14,266
Cash invested: $46,200 (down + closing). Projections, not guarantees.
Landlord ↔ Tenant lean methodology
- Overall (STATE)
- 90 Strongly Landlord-Friendly
- State Louisiana
- 90 Strongly Landlord-Friendly · R+12
- County
- — inherits STATE
- City
- — inherits STATE
ZIP-level market 70663
- Rents YoY
- 7.7%
- Active inventory
- 291
- Price-to-rent
- 8.4×
Monthly cashflow live
- Estimated rent
- $1,643 medium interval (Pro) →
- Mortgage (P&I)
- −$865
- Tax from tax record
- −$96 /mo · $1,149/yr
- Insurance
- −$69
- HOA
- −$0
- Vacancy / Maint / Mgmt
- −$345
- Net cashflow
- $268
Break-even live
UW: 25.0% down · 7.5% · 30yr · 1.5% tax · 5.0% vac · 8.0% maint · 8.0% mgmt
Financing live
Cash to close
- Down payment
- $41,250
- Closing costs
- $4,950
- Reserves months
- —
- Total cash needed
- —
Loan-product check · same deal, 3 products live
Conventional
25% down · 7.5% · 30yr
- Down + closing
- —
- Monthly P&I
- —
- Monthly cashflow
- —
- DSCR
- —
- Eligible?
- —
Personal DTI + credit; lowest rate.
DSCR
20% down · 8.5% · 30yr
- Down + closing
- —
- Monthly P&I
- —
- Monthly cashflow
- —
- DSCR
- —
- Eligible?
- —
No personal income docs; deal must DSCR.
Hard money
10% down · 12.0% · 12mo
- Down + closing
- —
- Monthly P&I
- —
- Monthly cashflow
- —
- DSCR
- —
- Eligible?
- —
Short-term bridge; refi at stabilization.
Rent comps 4 comps
| Address | Beds | Baths | Sqft | Rent | $/sqft | DOM | Units | Dist |
|---|---|---|---|---|---|---|---|---|
| 1917 Linda Ave Sulphur, LA | 3.0 | 2.0 | 1288 | $1,890 | $1.47 | 43d | 1 | 0.60mi |
| 2310 Timberlane Dr Sulphur, LA | 2.0 | 2.0 | 1350 | $2,450 | $1.81 | 43d | 1 | 0.83mi |
| 2304 Merwood St Unit B Sulphur, LA | 3.0 | 2.0 | 1200 | $900 | $0.75 | 21d | 1 | 0.87mi |
| 309 W Mimosa Dr Sulphur, LA | 3.0 | 2.0 | 1310 | $1,500 | $1.15 | 13d | 1 | 1.16mi |
Listing history 22 events
-
2026-06-17status $165,000 Pending 28 DOM
-
2026-06-17days on market $165,000 Active 28 DOM
-
2026-06-16days on market $165,000 Active 27 DOM
-
2026-06-15days on market $165,000 Active 26 DOM
-
2026-06-14days on market $165,000 Active 24 DOM
-
2026-06-13days on market $165,000 Active 23 DOM
-
2026-06-10days on market $165,000 Active 21 DOM
-
2026-06-09days on market $165,000 Active 20 DOM
-
2026-06-08days on market $165,000 Active 19 DOM
-
2026-06-07days on market $165,000 Active 18 DOM
-
2026-06-05days on market $165,000 Active 15 DOM
-
2026-06-02days on market $165,000 Active 13 DOM
-
2026-06-01days on market $165,000 Active 12 DOM
-
2026-05-31days on market $165,000 Active 11 DOM
-
2026-05-30days on market $165,000 Active 10 DOM
-
2026-05-17status Pending 534-char remark
-
2026-05-15$165,000 Active 534-char remark
-
2020-07-30soldstatus $138,500
-
2020-07-29soldstatus 301-char remark
Show marketing remark (301 chars)
Cute and well kept 3 bedroom, 1.5 bathroom home in Sulphur in the heart of Sulphur. Nice privacy fenced backyard with large oak tree for shade to enjoy. Located near schools, library, restaurants, and stores. Outside has one car carport, large back patio, and large outdoor laundry with extra storage.
-
2020-06-18$145,000 301-char remark
Show marketing remark (301 chars)
Cute and well kept 3 bedroom, 1.5 bathroom home in Sulphur in the heart of Sulphur. Nice privacy fenced backyard with large oak tree for shade to enjoy. Located near schools, library, restaurants, and stores. Outside has one car carport, large back patio, and large outdoor laundry with extra storage.
-
2018-11-14soldstatus $123,300
-
2014-09-25soldstatus $109,900
ⓘ Source: listings_history table (triggers on properties + properties_extension) + one-shot
backfill from property_details.listing_events for pre-trigger history.
Tax reassessment forecast LA · Resets to sale price
- Current annual tax
- $1,149 · $96/mo
- Projected year-2 tax
- $1,149 · $96/mo
- Expected delta
- $0/yr ($0/mo · 0.0%)
ⓘ Screening estimate from a state-policy table — verify with the county assessor before closing.
Climate risk First Street
- Flood 3/10 Moderate FEMA zone X (unshaded) · 12% chance over 30 yrs
- Wildfire 2/10 Low
- Heat 9/10 Extreme 7 d/yr ≥109°F today · 23 d/yr by 30 yrs out
- Wind 9/10 Extreme 99% chance of damaging wind over 30 yrs
- Air quality 2/10 Low 1 unhealthy d/yr today · 1 by 30 yrs out
Nearby sold comps map
Loading sold comps map…
Walkable amenities ~0.75 mi
Loading nearby amenities…
Taxation est. · year 1
- Rental income
- $19,711
- − Mortgage interest
- −$9,243
- − Property taxes
- −$1,149
- − Insurance
- −$825
- − Repairs & maintenance
- −$1,577
- − Management
- −$1,577
- − Depreciation
- −$4,800
- Taxable income
- $541
- Est. tax owed @ 24.0%
- −$130
- After-tax cash flow
- $3,085/yr
For passive investors: Depreciation is non-cash, so a rental often shows a tax loss while cash-flowing — sheltering income. Rental losses are passive: they offset passive income freely, and up to $25,000/yr can offset ordinary (W-2) income if you actively participate and your MAGI is under $100k (phasing out to $0 by $150k); unused losses carry forward. On sale, claimed depreciation is recaptured at up to 25%, and gains may owe capital-gains tax (a 1031 exchange can defer both). Figures are a year-1 estimate at your 24.0% rate — not tax advice; consult a CPA.
Schools (NCES district)
- District
- Calcasieu Parish
- NCES district ID
- 2200330
- Math proficiency
- 30% ▼ -39.00%
- Reading proficiency
- 44% ▼ -33.00%
- Median HH income
- $44,700
- Composite
- 31.45/100
- National rank
- #5979
- State rank
- #29 of 98 in LA
Livability — Sulphur
- Score
- 71/100
- State rank
- #48
- US rank
- #7164
Category grades
Schools grade is shown separately in the Schools card above.
Census & demographics
- Census place
- Sulphur, LA
- County
- Calcasieu Parish · 170,889 people
- City population
- 27,799
- Metro
- Lake Charles, LA
- Population (ZIP)
- 27,799
- Household income
- $64,707
- Rent vs Own
- Severe rent burden
- 197.0
Population outlook (Calcasieu County) Hauer SSP2
- Today (2025)
- 212,179 people
- By 2030
- 218,199 · +2.8%
- By 2040
- 228,486 · +7.7%
- By 2050
- 236,208 · +11.3%
- By 2075
- 251,696 · +18.6%
- By 2100
- 247,848 · +16.8%
Race, ethnicity, and origin ACS 2023
- Neighborhood character
- Predominantly White (82%)
- Race & ethnicity
- White 82% Black 8% Hispanic / Latino 5% Two or more races 4%
- Common ancestry
- Lithuanian 13% Slovak 2% Scandinavian 1%
- Foreign-born
- 3% · Canada, Vietnam
- Languages at home
- 94% English-only · Spanish 2% French/Haitian/Cajun 2% Other Indo-European 1%
Political lean MEDSL · Calcasieu
- 2024 margin
- Solid R (+39.6) · D 29.5% · R 69.0% · Other 1.5%
- 2008→2024 swing
- -15.0pp toward R · 2008: -24.6pp · 2024: -39.6pp
- All cycles
- 2024: R+39.6 2020: R+35.2 2016: R+33.3 2012: R+28.7 2008: R+24.6
Not yet ingested
- Civics
- —
Market trends
- HPI YoY
- ▼ -104.29%
- Current HPI
- 100.0895
- Rent YoY
- ▲ 7.65%
- Metro
- Lake Charles, LA
- State GDP YoY
- ▲ 3.29%
- F500 in state
- 10
Industry mix (Fortune 500 HQ in LA)
| Industry | F500 HQs | Revenue |
|---|---|---|
| Telecommunications | 2 | $23B |
|
||
| Utilities | 1 | $12B |
|
||
| Wholesale / Distribution | 1 | $5B |
|
||
| Advertising | 1 | $2B |
|
||
Price history
+50.1% since first listed9 events — show timeline
- 2026-06-17 Pending — SWLAR
- 2026-05-22 Relisted — SWLAR
- 2026-05-17 Pending — SWLAR
- 2026-05-15 Listed $165,000 SWLAR
- 2020-07-30 Sold (Public Records) $138,500 Public Records
- 2020-07-29 Sold (MLS) — SWLAR
- 2020-06-18 Listed $145,000 SWLAR
- 2018-11-14 Sold (Public Records) $123,300 Public Records
- 2014-09-25 Sold (Public Records) $109,900 Public Records
Property tax history
+7.7%/yrLatest (2025): $1,149 · +0.8% YoY. Source: county tax records.
Cash-flow waterfall
monthlySold comps — $/sqft
last 12 mo · ≤1 miLoading sold comps…