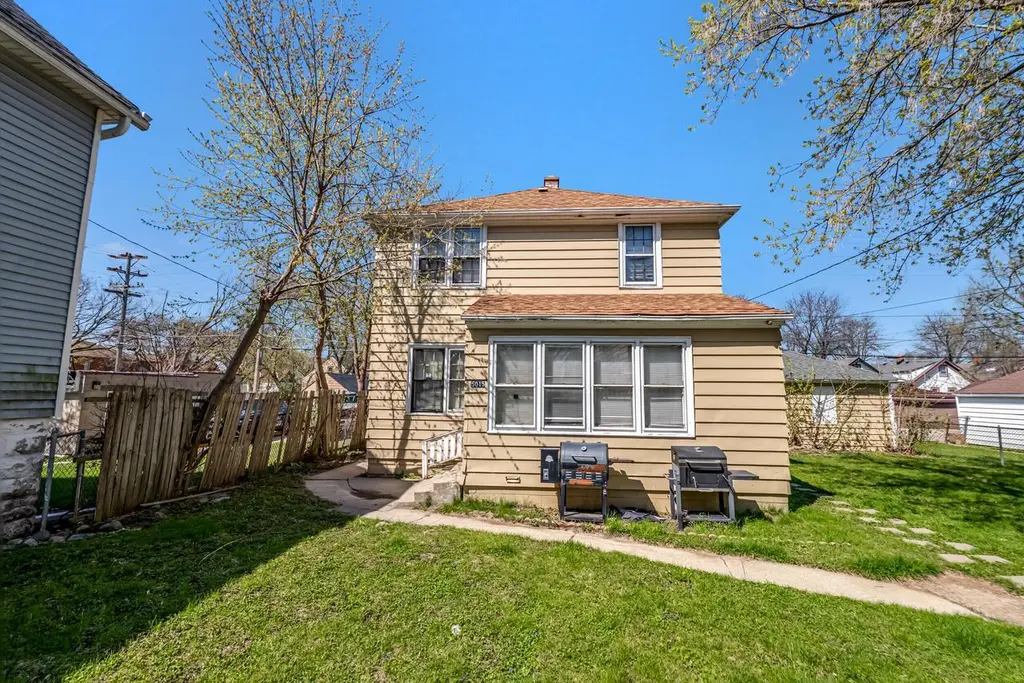
 Duplex
5015 N 38th St · Milwaukee, WI
Flood risk 1/10 · Minimal
- FEMA flood zone
- X (unshaded)
- Chance of flooding over 30 yrs
- 0.0%
- Est. flood insurance / yr
- $473 – $860
Fire risk 1/10 · Minimal
- Est. fire insurance / yr
- $636 – $1,182
Heat risk 2/10 · Minimal
- Hot days now (above 98°F)
- 7 days/yr
- Hot days in 30 yrs
- 13 days/yr
Wind risk 2/10 · Minimal
- Chance of severe wind over 30 yrs
- —
Air-quality risk 2/10 · Minimal
- Unhealthy air days now
- 2 days/yr
- Unhealthy air days in 30 yrs
- 2 days/yr
Risk factors via First Street. Map © Google.
Why this score? — see what drove the B- grade
The composite is a weighted blend of 9 inputs, each scored 0–100. Each bar is that input's sub-score; the figure is the points it added to the 100-point composite (weight × sub-score).
- Cash flow +30.0/30.0
- DSCR +10.0/10.0
- 1% rule +9.3/10.0
- ARV discount +7.5/15.0
- Rent growth +4.7/5.0
- Livability +4.0/5.0
- Condition / age +2.2/5.0
- Schools +1.2/10.0
- Appreciation +0.0/10.0
$179,900
🖨 Deal sheet (PDF) 📄 Offer letter ✓ Due diligence
Multi-family units
County records classify this as Multi-Family (2-4 Unit). Listing-text estimate: 2 units. confirmed
Listing remarks MLS
This turnkey 2/2 duplex is the perfect home or investment property. Currently rented for $1,550 per month, this property leaves room for an increase in cashflow. Schedule a showing today!
Key facts
- Practical layouts
- Near lincoln park
- Near oak leaf trail
Tags
Property features AI
Finance
- Other: Lot size approximately 0.09 acres (less than 1/2 acre)
Exterior
- Utilities: Municipal water; Municipal sewer; 2 electric meters; 2 gas meters
- Home design: 2-story duplex; Multi-family property; Zoning: RT3
- Construction: Assessor/Public Record used for year built information
- Exterior features: Vinyl exterior; Other exterior materials
Interior
- Kitchen: Unit 2 kitchen on upper level
- Bedrooms: Unit 1: 2 bedrooms; Unit 2: 2 bedrooms (master and second bedroom on upper level)
- Bathrooms: Unit 1: 1 full bathroom; Unit 2: 1 full bathroom
- Interior features: Full basement
Neighborhood map
What this means for you Summary
Snapshot
- This is a 2 × 2-bed/1.0-bath units multifamily listed at $180k. Condition is rated fair.
Deal economics
- At list price, monthly cash flow is $783 ($9k/yr) — positive. Per door: $392/mo.
- The deal already cash-flows at list — no discount required.
- Meets the 1% rule at list price ($3k rent vs $180k).
- Recommended offer: $175k (3.0% below list) — sets the bar for market timing.
- Cap rate 11.5% vs local median 5.1% in Milwaukee — top-decile yield for the area; either an underpriced asset or a hidden risk that comps aren't pricing in. Stress-test before assuming the spread holds.
Location & tenants
- Location reads 81/100 on livability (#55 in WI, #1,534 nationally) — a professional / high-income tenant draw. Strengths: amenities A+, commute A+, cost of living A+; Watch: employment D+, schools F, crime F.
- Milwaukee School District (urban): math 10% / reading 18% proficiency, ranked #337 of 342 in WI (top 98%) — low school quality limits family demand, transient renter base, plan for 1-2y turnover; 77% free/reduced lunch — lower-income household profile, screen leases tightly.
- Market conditions: Rents rising fast (+8.6%/yr); 171 active listings in the ZIP; 10 comparable units currently listed for rent nearby; rentals at typical pace (median 25d on market — plan ~3-4 weeks tenant-placement turnaround); 40% of comp listings sitting > 30 days — soft ceiling on asking rent; 1,017 units permitted in Milwaukee County in 2024 (803 in 5+ unit buildings).
- At $2,565/mo this rent would consume 63% of the median local household income ($48k/yr) (locally 3390% of renters already pay >50% of income on rent) — very limited rent-growth headroom before tenants either downsize or default.
Forward outlook
- Local home prices are declining (-3.0%/yr); year-one equity from $1k of loan paydown is wiped out by about $5k of value loss. Plan a longer hold.
- Milwaukee County population projected at +4% by 2050 — modest demand growth; plan on rents tracking national, not racing it.
- At projected returns (-3.0% appreciation + 8.0% rent growth), your $50k cash investment doubles in ~6 years — after that, you're playing with house money.
Negotiation context
- It's been on market 59 days — a 3% lower offer ($175k) is reasonable based on typical stale-listing flexibility.
- 3 sale attempts since 3y ago with the ask held roughly flat each time — persistent listings suggest the price (not the market) is what's stuck; bring a comps-based counter.
Risks & watch-outs
- Watch-outs: built in 1940 — expect roof / HVAC / electrical / plumbing capex.
Questions for the listing agent
- It's been on market 59 days. Have you received any prior offers? Is the seller open to a 3% concession, seller financing, or rate buy-down credit?
- Can we see the unit-by-unit rent roll, current vacancy, and any below-market leases? What's the average tenancy length?
- What capital expenditures (roof, boiler, parking lot, exteriors) have been made in the last 5 years, and what's planned in the next 2?
- Have any recent inspections been done? Can we get a copy of the seller's disclosures and any deferred-maintenance estimates?
- Built in 1940 — when were the roof, HVAC, electrical panel, plumbing, and water heater last replaced?
- Is there a deadline driving the sale (1031 exchange, divorce, estate, relocation)? That informs how much negotiation room exists.
- Schools are F-rated, which usually means shorter tenancies and higher turnover. Who's the typical renter profile here, and what's been the actual vacancy rate?
- Crime grade is F in this area — have there been break-ins, vandalism, or insurance claims at this property in the last 3 years? What carrier currently insures it and at what premium?
- What's the average days-on-market for RENTAL listings here right now (not sales)? A rising rental-DOM trend means longer vacancies and softer asking-rent achievability than the comps imply.
- What's the recent tenant-quality profile in this submarket — average credit score on applications, eviction rate, late-payment / NSF rate, and stable-employment percentage? A property-management company in the area should have these aggregated.
- How much new apartment / multifamily construction is in the pipeline within 1–3 miles? Heavy new supply (>2% of stock underway) typically softens rents 12–24 months out; light construction supports rent growth.
Investment metrics
- 1% rule
- 1.43% ✓
- Cap rate
- 11.52%
- Cash-on-cash
- 18.66%
- DSCR
- 1.83
- GRM
- 5.8
CMA / ARV
- ARV (median comp)
- $108,336
- List price
- $179,900
- Delta
- 66.06%
- Verdict
- OVERPRICED
- Comps
- 20 within 1.0 mi
Show comp detail 12 sales within ~0.75 mi
| Address | Dist | Beds/Ba | Sqft | Sold | Price | $/sf | Match |
|---|---|---|---|---|---|---|---|
| 4855 N Hopkins St | 0.20mi | 4/2.0 | 1,610 (+3%) | 8mo | $70,000 | $43 | 79 |
| 3130 W Cameron Ave Unit 3130A | 0.41mi | 5/2.0 (+1) | 1,543 (-1%) | 0mo | $165,000 | $107 | 74 |
| 5337 N 38th St | 0.42mi | 4/2.0 | 1,510 (-3%) | 7mo | $110,000 | $73 | 70 |
| 5241 N 31st St | 0.53mi | 4/2.0 | 1,657 (+6%) | 2mo | $104,000 | $63 | 63 |
| 4715 W Villard Ave | 0.61mi | 4/2.0 | 1,529 (-2%) | 7mo | $99,000 | $65 | 63 |
| 5105 N 46th St #5107 | 0.51mi | 4/2.0 | 1,536 (-1%) | 14mo | $125,000 | $81 | 62 |
| 5021 N 27th St | 0.70mi | 5/2.0 (+1) | 1,630 (+5%) | 5mo | $135,000 | $83 | 50 |
| 5151 N 31st St | 0.47mi | 4/2.0 | 1,742 (+12%) | 14mo | $168,000 | $96 | 47 |
| 4703 N 35th St | 0.45mi | 4/2.0 | 1,789 (+15%) | 9mo | $147,500 | $82 | 47 |
| 5368 N 39th St Unit 5368A | 0.46mi | 3/2.0 (-1) | 1,384 (-11%) | 11mo | $90,000 | $65 | 46 |
| 5362 N 34th St Unit 5362A | 0.53mi | 3/2.0 (-1) | 1,426 (-8%) | 15mo | $99,500 | $70 | 44 |
| 5531 N 41st St | 0.68mi | 4/2.0 | 1,702 (+9%) | 13mo | $180,000 | $106 | 42 |
Match score weights: distance 35% · size 25% · config 20% · recency 20%. Top-matched comps best support the ARV.
Projected returns pro-forma
-3.0% appreciation · 8.0% rent growth · sell at horizon
- IRR
- 16.0%
- Equity multiple
- 1.68×
- Total profit
- $34,319
- Equity at exit
- $26,824
- IRR
- 28.0%
- Equity multiple
- 4.10×
- Total profit
- $155,961
- Equity at exit
- $15,554
Cash invested: $50,372 (down + closing). Projections, not guarantees.
Landlord ↔ Tenant lean methodology
- Overall (STATE)
- 73 Landlord-Friendly
- State Wisconsin
- 73 Landlord-Friendly · R+2
- County
- — inherits STATE
- City
- — inherits STATE
ZIP-level market 53209
- Rents YoY
- 8.6%
- Active inventory
- 171
- Price-to-rent
- 11.7×
Monthly cashflow live
- Estimated rent
- $2,565 high interval (Pro) →
- Mortgage (P&I)
- −$943
- Tax est. 1.5%
- −$225 /mo · $2,698/yr
- Insurance
- −$75
- HOA
- −$0
- Vacancy / Maint / Mgmt
- −$539
- Net cashflow
- $783
Break-even live
Sensitivity live
| Price | -10% $907 | -5% $845 | +0% $783 | +5% $721 | +10% $659 |
|---|---|---|---|---|---|
| Rent | -10% $580 | -5% $682 | +0% $783 | +5% $884 | +10% $986 |
| Rate | -1.0pp $874 | -0.5pp $829 | base $783 | +0.5pp $736 | +1.0pp $689 |
2-unit breakdown (identical units grouped — click to expand)
| Units | Beds | Baths | Est. rent |
|---|---|---|---|
| 2× units | 2 | 1 | $2,566 |
| #1 | 2 | 1 | $1,283 |
| #2 | 2 | 1 | $1,283 |
| Total (2 units) | $2,565 | ||
UW: 25.0% down · 7.5% · 30yr · 1.5% tax · 5.0% vac · 8.0% maint · 8.0% mgmt
Financing live
Cash to close
- Down payment
- $44,975
- Closing costs
- $5,397
- Reserves months
- —
- Total cash needed
- —
Loan-product check · same deal, 3 products live
Conventional
25% down · 7.5% · 30yr
- Down + closing
- —
- Monthly P&I
- —
- Monthly cashflow
- —
- DSCR
- —
- Eligible?
- —
Personal DTI + credit; lowest rate.
DSCR
20% down · 8.5% · 30yr
- Down + closing
- —
- Monthly P&I
- —
- Monthly cashflow
- —
- DSCR
- —
- Eligible?
- —
No personal income docs; deal must DSCR.
Hard money
10% down · 12.0% · 12mo
- Down + closing
- —
- Monthly P&I
- —
- Monthly cashflow
- —
- DSCR
- —
- Eligible?
- —
Short-term bridge; refi at stabilization.
Rent comps 10 comps
| Address | Beds | Baths | Sqft | Rent | $/sqft | DOM | Units | Dist |
|---|---|---|---|---|---|---|---|---|
| 4334 W Eggert Pl Milwaukee, WI | 4.0 | 1.0 | 1077 | $1,695 | $1.57 | 25d | 1 | 0.37mi |
| 4340 W Eggert Pl Milwaukee, WI | 4.0 | 1.0 | 1066 | $1,695 | $1.59 | 25d | 1 | 0.37mi |
| 5032 N 32nd St Milwaukee, WI | 3.0 | 2.0 | 1089 | $1,750 | $1.61 | 14d | 1 | 0.43mi |
| 4702 N 44th St Milwaukee, WI | 3.0 | 2.0 | 1050 | $1,850 | $1.76 | 45d | 1 | 0.55mi |
| 5073 N 48th St Milwaukee, WI | 4.0 | 1.0 | 1152 | $1,595 | $1.38 | 16d | 1 | 0.61mi |
| 5541 N 35th St #5543 Milwaukee, WI | 3.0 | 1.0 | 1130 | $1,195 | $1.06 | 5d | 1 | 0.68mi |
| 4900 N 58th St Milwaukee, WI | 3.0 | 1.0 | 1455 | $1,450 | $1.00 | 5d | 1 | 1.21mi |
| 3931 W Kaul Ave Milwaukee, WI | 3.0 | 1.0 | 1400 | $1,695 | $1.21 | 45d | 1 | 1.36mi |
| 4139 N 50th St Milwaukee, WI | 3.0 | 1.0 | 1275 | $1,600 | $1.25 | 45d | 1 | 1.37mi |
| 3925 N 42nd St Milwaukee, WI | 3.0 | 1.0 | 1300 | $1,675 | $1.29 | 45d | 1 | 1.42mi |
Listing history 21 events
-
2026-06-21days on market $179,900 Active 59 DOM
-
2026-06-18days on market $179,900 Active 56 DOM
-
2026-06-17days on market $179,900 Active 55 DOM
-
2026-06-16days on market $179,900 Active 54 DOM
-
2026-06-15days on market $179,900 Active 53 DOM
-
2026-06-13days on market $179,900 Active 51 DOM
-
2026-06-13days on market $179,900 Active 50 DOM
-
2026-06-09days on market $179,900 Active 47 DOM
-
2026-06-08days on market $179,900 Active 46 DOM
-
2026-06-07days on market $179,900 Active 45 DOM
-
2026-06-05days on market $179,900 Active 42 DOM
-
2026-06-03days on market $179,900 Active 41 DOM
-
2026-06-02days on market $179,900 Active 40 DOM
-
2026-06-01days on market $179,900 Active 39 DOM
-
2026-05-31days on market $179,900 Active 38 DOM
-
2026-04-23$179,900 Active 731-char remark
-
2024-02-14historical 187-char remark
Show marketing remark (187 chars)
This turnkey 2/2 duplex is the perfect home or investment property. Currently rented for $1,550 per month, this property leaves room for an increase in cashflow. Schedule a showing today!
-
2023-09-27$119,900 Active 187-char remark
Show marketing remark (187 chars)
This turnkey 2/2 duplex is the perfect home or investment property. Currently rented for $1,550 per month, this property leaves room for an increase in cashflow. Schedule a showing today!
-
2023-05-23historical
Show marketing remark (205 chars)
Turnkey duplex rented and ready for you to cashflow. Total rents are 1445/mo with room to increase. Seller also has other properties that could be a package deal. MLS #'s 1823815, 1823814, 1823810, 1823813
-
2023-02-16price $124,900
Show marketing remark (205 chars)
Turnkey duplex rented and ready for you to cashflow. Total rents are 1445/mo with room to increase. Seller also has other properties that could be a package deal. MLS #'s 1823815, 1823814, 1823810, 1823813
-
2023-02-03$119,900 Active
Show marketing remark (205 chars)
Turnkey duplex rented and ready for you to cashflow. Total rents are 1445/mo with room to increase. Seller also has other properties that could be a package deal. MLS #'s 1823815, 1823814, 1823810, 1823813
ⓘ Source: listings_history table (triggers on properties + properties_extension) + one-shot
backfill from property_details.listing_events for pre-trigger history.
Climate risk First Street
- Flood 1/10 Low FEMA zone X (unshaded) · 0% chance over 30 yrs
- Wildfire 1/10 Low
- Heat 2/10 Low 7 d/yr ≥98°F today · 13 d/yr by 30 yrs out
- Wind 2/10 Low
- Air quality 2/10 Low 2 unhealthy d/yr today · 2 by 30 yrs out
Nearby sold comps map
Loading sold comps map…
Walkable amenities ~0.75 mi
Loading nearby amenities…
Taxation est. · year 1
- Rental income
- $30,780
- − Mortgage interest
- −$10,077
- − Property taxes
- −$2,698
- − Insurance
- −$900
- − Repairs & maintenance
- −$2,462
- − Management
- −$2,462
- − Depreciation
- −$5,233
- Taxable income
- $6,947
- Est. tax owed @ 24.0%
- −$1,667
- After-tax cash flow
- $7,730/yr
For passive investors: Depreciation is non-cash, so a rental often shows a tax loss while cash-flowing — sheltering income. Rental losses are passive: they offset passive income freely, and up to $25,000/yr can offset ordinary (W-2) income if you actively participate and your MAGI is under $100k (phasing out to $0 by $150k); unused losses carry forward. On sale, claimed depreciation is recaptured at up to 25%, and gains may owe capital-gains tax (a 1031 exchange can defer both). Figures are a year-1 estimate at your 24.0% rate — not tax advice; consult a CPA.
Condition & rehab AI · 6 photos
This 2/2 duplex requires moderate renovations to improve its condition and increase its value. Immediate repairs and updates are needed to bring it up to a fair condition.
Repairs flagged
- Major siding — Significant damage
- Major exterior paint — Peeling paint
- Major flooring — Worn-out carpet
- Major interior paint — Peeling paint
- Major bathroom fixtures — Needs updating
- Major kitchen appliances — Needs updating
- Major HVAC system — Needs updating
Value-add opportunities
- Both New siding and paint — Enhances curb appeal and value
- Both New flooring and paint — Improves interior aesthetics and value
- Both New kitchen appliances and fixtures — Modernizes the space and attracts renters
- Both HVAC system replacement — Improves comfort and energy efficiency
Renovation cost estimate screening
| Repair item | Severity | Est. cost |
|---|---|---|
| siding · Significant damage | Major | $15,000–50,000 |
| exterior paint · Peeling paint | Major | $15,000–50,000 |
| flooring · Worn-out carpet | Major | $15,000–50,000 |
| interior paint · Peeling paint | Major | $15,000–50,000 |
| bathroom fixtures · Needs updating | Major | $15,000–50,000 |
| kitchen appliances · Needs updating | Major | $15,000–50,000 |
| HVAC system · Needs updating | Major | $15,000–50,000 |
| Total estimated repair cost · 7 items | $105,000–350,000 |
Value-add ROI direction
- Both New siding and paint — Enhances curb appeal and value ↑
- Both New flooring and paint — Improves interior aesthetics and value ↑
- Both New kitchen appliances and fixtures — Modernizes the space and attracts renters ↑
- Both HVAC system replacement — Improves comfort and energy efficiency ↑
ⓘ Cost ranges are severity-bucket heuristics (US national rule-of-thumb). Get contractor quotes + a written scope before underwriting a rehab budget.
Schools (NCES district)
- District
- Milwaukee School District
- NCES district ID
- 5509600
- Math proficiency
- 10% ▼ -5.00%
- Reading proficiency
- 18% ▬ 0.00%
- Median HH income
- $36,339
- Composite
- 11.61/100
- National rank
- #9696
- State rank
- #337 of 342 in WI
Livability — Milwaukee
- Score
- 81/100
- State rank
- #55
- US rank
- #1534
Category grades
Schools grade is shown separately in the Schools card above.
Census & demographics
- Census place
- Milwaukee, WI
- County
- Milwaukee County · 926,379 people
- City population
- 573,768
- Metro
- Milwaukee-Waukesha, WI
- Population (ZIP)
- 45,170
- Household income
- $48,486
- Rent vs Own
- Severe rent burden
- 3390.0
Population outlook (Milwaukee County) Hauer SSP2
- Today (2025)
- 995,758 people
- By 2030
- 1,009,124 · +1.3%
- By 2040
- 1,028,128 · +3.3%
- By 2050
- 1,040,066 · +4.4%
- By 2075
- 1,057,849 · +6.2%
- By 2100
- 1,039,774 · +4.4%
Race, ethnicity, and origin ACS 2023
- Neighborhood character
- Predominantly Black (66%)
- Race & ethnicity
- Black 66% White 22% Hispanic / Latino 5% Two or more races 5% Asian 2%
- Hispanic origin (detail)
- Mexican 2% Puerto Rican 3%
- Common ancestry
- Romanian 3% Portuguese 1% Iranian 1%
- Foreign-born
- 3% · Canada
- Languages at home
- 92% English-only · Spanish 4% Other Asian/Pacific 1% Russian/Polish/Slavic 1%
Political lean MEDSL · Milwaukee
- 2024 margin
- Solid D (+38.5) · D 68.3% · R 29.8% · Other 1.8%
- 2008→2024 swing
- +2.7pp toward D · 2008: 35.9pp · 2024: 38.5pp
- All cycles
- 2024: D+38.5 2020: D+39.9 2016: D+37.5 2012: D+34.6 2008: D+35.9
Not yet ingested
- Civics
- —
Market trends
- HPI YoY
- ▼ -194.98%
- Current HPI
- 172.4275
- Rent YoY
- ▲ 8.61%
- Metro
- Milwaukee-Waukesha, WI
- State GDP YoY
- ▲ 2.10%
- F500 in state
- 20
Industry mix (Fortune 500 HQ in WI)
| Industry | F500 HQs | Revenue |
|---|---|---|
| Industrial Machinery | 4 | $23B |
|
||
| Industrial Technology | 2 | $36B |
|
||
| Insurance | 1 | $36B |
|
||
| Professional Services | 1 | $19B |
|
||
| Utilities | 1 | $9B |
|
||
| Consumer Goods | 1 | $3B |
|
||
Price history
+50.0% since first listed6 events — show timeline
- 2026-04-23 Listed $179,900 METROMLS
- 2024-02-14 Listing Removed — METROMLS
- 2023-09-27 Listed $119,900 METROMLS
- 2023-05-23 Listing Removed — METROMLS
- 2023-02-16 Price Changed $124,900 METROMLS
- 2023-02-03 Listed $119,900 METROMLS
Cash-flow waterfall
monthlySold comps — $/sqft
last 12 mo · ≤1 miLoading sold comps…