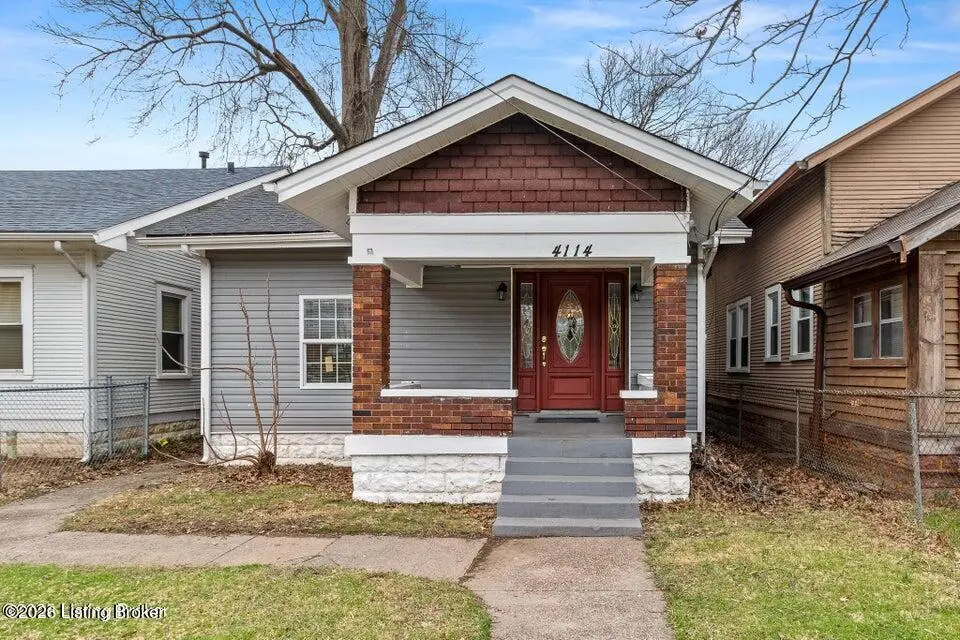
4114 Bank St · Louisville, KY
Flood risk 1/10 · Minimal
- FEMA flood zone
- X (unshaded)
- Chance of flooding over 30 yrs
- 0.0%
- Est. flood insurance / yr
- $473 – $860
Fire risk 1/10 · Minimal
- Est. fire insurance / yr
- $839 – $1,559
Heat risk 5/10 · Moderate
- Hot days now (above 104°F)
- 7 days/yr
- Hot days in 30 yrs
- 20 days/yr
Wind risk 2/10 · Minimal
- Chance of severe wind over 30 yrs
- 2.0%
Air-quality risk 2/10 · Minimal
- Unhealthy air days now
- 1 days/yr
- Unhealthy air days in 30 yrs
- 2 days/yr
Risk factors via First Street. Map © Google.
Why this score? — see what drove the C grade
The composite is a weighted blend of 9 inputs, each scored 0–100. Each bar is that input's sub-score; the figure is the points it added to the 100-point composite (weight × sub-score).
- Cash flow +20.1/30.0
- Appreciation +10.0/10.0
- DSCR +6.4/10.0
- ARV discount +4.6/15.0
- 1% rule +4.3/10.0
- Livability +3.2/5.0
- Rent growth +2.6/5.0
- Condition / age +2.5/5.0
- Schools +2.3/10.0
$141,000
🖨 Deal sheet 📄 Offer letter ✓ Due diligence
Listing remarks
This fully renovated 3BR/1BA single-family home offers 1,506 sq ft in West Park subdivision. Updates: new metal roof, modern HVAC, central cooling, fresh paint, new upstairs carpet. Open-concept layout with modern kitchen flowing to living/dining. Parking: garage & off-street. Located in Shawnee near Shawnee Park (basketball, playgrounds, spray pads, sports, pavilions). Close to downtown: Slugger Museum, KFC Yum! Center, riverfront trails. Local dining & transport nearby. Month-to-month tenant at $1,150/mo (tenant pays utilities). No HOA. Showings with notice. Section 8 Fair Market Rate: $1,625. Beats the 1% rule by bunches!
Key facts
- New metal roof
- Modern hvac
- Fresh paint
Tags
Property features AI
Finance
- HOA & community: No association fee
Exterior
- Parking: Detached garage (1 car)
- Utilities: Natural gas fuel
- Home design: Single family residence; Cape Cod style; Two stories; Built in 1935
- Construction: Vinyl siding; Shingle roof; Crawl space foundation
- Exterior features: Partial chain-link fencing; Located in the WEST PARK subdivision
Interior
- Kitchen: Kitchen on the first floor
- Bedrooms: Three bedrooms total (two on the first floor, one on the second)
- Bathrooms: One full bathroom on the first floor
- Interior features: Five total rooms; Living room on the first floor; No basement
- Laundry & utility: Laundry room on the first floor
Neighborhood map
What this means for you Summary
Snapshot
- This is a 3-bed/1.0-bath single-family listed at $141k.
Deal economics
- At list price, monthly cash flow is $174 ($2k/yr) — positive.
- The deal already cash-flows at list — no discount required.
- To meet the 1% rule (rent ≥ 1% of price), the offer needs to be $131k (6.9% below list).
- Recommended offer: $131k (6.9% below list) — sets the bar for 1% rule.
- Cap rate 7.8% vs local median 5.0% in Louisville — top-decile yield for the area; either an underpriced asset or a hidden risk that comps aren't pricing in. Stress-test before assuming the spread holds.
Location & tenants
- Location reads 63/100 on livability (#333 in KY) — a middle-class / working-renter tenant base. Strengths: cost of living A+, housing A+; Watch: employment C-, health & safety D+, schools D-.
- Jefferson County (urban): math 19% / reading 35% proficiency, ranked #121 of 165 in KY (top 73%) — low school quality limits family demand, transient renter base, plan for 1-2y turnover.
- Market conditions: Rents flat; 140 active listings in the ZIP; 25 comparable units currently listed for rent nearby; rentals at typical pace (median 20d on market — plan ~3-4 weeks tenant-placement turnaround); lower-income renter base — watch delinquency; 2,836 units permitted in Jefferson County in 2024 (1,558 in 5+ unit buildings).
Forward outlook
- In year one you build about $15k of equity ($975 loan paydown + $14k appreciation (10.0% local appreciation)).
- Jefferson County population projected at +13% by 2050 — modest demand growth; plan on rents tracking national, not racing it.
- At projected returns (10.0% appreciation + 0.5% rent growth), your $39k cash investment doubles in ~3 years — after that, you're playing with house money.
- By year 3, paydown + projected appreciation supports a ~$38k cash-out refi (75% LTV) — recoverable capital for the next deal without selling this one.
Negotiation context
- It's been on market 27 days — a 2% lower offer ($139k) is reasonable based on typical stale-listing flexibility.
- 4 sale attempts since 27y ago with the ask held roughly flat each time — persistent listings suggest the price (not the market) is what's stuck; bring a comps-based counter.
- Current owner paid $115k; 23% above their basis — modest negotiation headroom, anchor on the comps not their cost.
Risks & watch-outs
- Watch-outs: built in 1935 — expect roof / HVAC / electrical / plumbing capex.
- Climate carrying-cost: extreme-heat days projected 7→20/yr by 2055 (HVAC capex compounding) — expect insurance premiums to compound above CPI over the hold.
Questions for the listing agent
- Built in 1935 — when were the roof, HVAC, electrical panel, plumbing, and water heater last replaced?
- Is there a deadline driving the sale (1031 exchange, divorce, estate, relocation)? That informs how much negotiation room exists.
- Schools are D-rated, which usually means shorter tenancies and higher turnover. Who's the typical renter profile here, and what's been the actual vacancy rate?
- Crime grade is F in this area — have there been break-ins, vandalism, or insurance claims at this property in the last 3 years? What carrier currently insures it and at what premium?
- What's the average days-on-market for RENTAL listings here right now (not sales)? A rising rental-DOM trend means longer vacancies and softer asking-rent achievability than the comps imply.
- What's the recent tenant-quality profile in this submarket — average credit score on applications, eviction rate, late-payment / NSF rate, and stable-employment percentage? A property-management company in the area should have these aggregated.
- How much new for-sale + rental construction is in the pipeline within 1–3 miles? Heavy new supply typically softens prices + rents 12–24 months out; constrained supply supports both.
Investment metrics
- 1% rule
- 0.93% ✗
- Cap rate
- 7.78%
- Cash-on-cash
- 5.30%
- DSCR
- 1.24
- GRM
- 9.0
CMA / ARV
- ARV (on-the-fly)
- $132,528
- Comps found
- 12
Show comp detail 12 sales within ~0.75 mi
| Address | Dist | Beds/Ba | Sqft | Sold | Price | $/sf | Match |
|---|---|---|---|---|---|---|---|
| 4210 Miami Ave | 0.09mi | 3/2.0 | 1,568 (+4%) | 12mo | $208,000 | $133 | 75 |
| 366 N 41st St | 0.19mi | 3/1.0 | 1,400 (-7%) | 10mo | $175,200 | $125 | 71 |
| 3931 Northwestern Pkwy | 0.21mi | 2/1.0 (-1) | 1,373 (-9%) | 5mo | $100,000 | $73 | 66 |
| 431 N 44th St | 0.25mi | 2/1.0 (-1) | 1,350 (-10%) | 5mo | $109,994 | $81 | 62 |
| 405 N 38th St | 0.25mi | 4/2.0 (+1) | 1,616 (+7%) | 7mo | $190,000 | $118 | 62 |
| 121 N Shawnee Ter | 0.48mi | 4/1.0 (+1) | 1,458 (-3%) | 9mo | $80,000 | $55 | 60 |
| 107 N 38th St | 0.56mi | 3/1.0 | 1,649 (+10%) | 8mo | $145,000 | $88 | 52 |
| 102 N 45th St | 0.51mi | 3/2.0 | 1,569 (+4%) | 16mo | $210,000 | $134 | 52 |
| 238 S 41st St | 0.74mi | 3/2.0 | 1,450 (-4%) | 8mo | $119,900 | $83 | 48 |
| 224 N 38th St | 0.39mi | 3/2.0 | 1,685 (+12%) | 12mo | $75,000 | $45 | 48 |
| 234 S 39th St | 0.74mi | 3/1.0 | 1,583 (+5%) | 16mo | $80,000 | $51 | 44 |
| 119 S Longworth Ave | 0.66mi | 3/1.5 | 1,329 (-12%) | 14mo | $178,000 | $134 | 36 |
Match score weights: distance 35% · size 25% · config 20% · recency 20%. Top-matched comps best support the ARV.
Projected returns pro-forma
10.0% appreciation · 0.51% rent growth · sell at horizon
- IRR
- 27.2%
- Equity multiple
- 3.14×
- Total profit
- $84,646
- Equity at exit
- $127,024
- IRR
- 23.2%
- Equity multiple
- 6.94×
- Total profit
- $234,561
- Equity at exit
- $273,932
Cash invested: $39,480 (down + closing). Projections, not guarantees.
Landlord ↔ Tenant lean methodology
- Overall (STATE)
- 83 Strongly Landlord-Friendly
- State Kentucky
- 83 Strongly Landlord-Friendly · R+16
- County
- — inherits STATE
- City
- — inherits STATE
ZIP-level market 40212
- Home prices YoY
- 11.0%
- Rents YoY
- 0.5%
- Active inventory
- 140
- Price-to-rent
- 9.0×
Monthly cashflow live
- Estimated rent
- $1,313 high interval (Pro) →
- Mortgage (P&I)
- −$739
- Tax from tax record
- −$65 /mo · $774/yr
- Insurance
- −$59
- HOA
- −$0
- Vacancy / Maint / Mgmt
- −$276
- Net cashflow
- $174
Break-even live
UW: 25.0% down · 7.5% · 30yr · 1.5% tax · 5.0% vac · 8.0% maint · 8.0% mgmt
Financing live
Cash to close
- Down payment
- $35,250
- Closing costs
- $4,230
- Reserves months
- —
- Total cash needed
- —
Loan-product check · same deal, 3 products live
Conventional
25% down · 7.5% · 30yr
- Down + closing
- —
- Monthly P&I
- —
- Monthly cashflow
- —
- DSCR
- —
- Eligible?
- —
Personal DTI + credit; lowest rate.
DSCR
20% down · 8.5% · 30yr
- Down + closing
- —
- Monthly P&I
- —
- Monthly cashflow
- —
- DSCR
- —
- Eligible?
- —
No personal income docs; deal must DSCR.
Hard money
10% down · 12.0% · 12mo
- Down + closing
- —
- Monthly P&I
- —
- Monthly cashflow
- —
- DSCR
- —
- Eligible?
- —
Short-term bridge; refi at stabilization.
Rent comps 25 comps
| Address | Beds | Baths | Sqft | Rent | $/sqft | DOM | Units | Dist |
|---|---|---|---|---|---|---|---|---|
| 3901 Jewell Ave Louisville, KY | 3.0 | 1.0 | 1069 | $1,140 | $1.07 | 20d | 1 | 0.24mi |
| 127 N 40th St Louisville, KY | 3.0 | 2.0 | 1500 | $1,570 | $1.05 | 3d | 1 | 0.40mi |
| 106 N 40th St Louisville, KY | 3.0 | 1.0 | 1325 | $1,220 | $0.92 | 3d | 1 | 0.44mi |
| 247 Cecil Ave Louisville, KY | 3.0 | 2.0 | 1083 | $1,305 | $1.20 | 19d | 1 | 0.70mi |
| 4129 W Muhammad Ali Blvd Louisville, KY | 4.0 | 2.0 | 1224 | $1,500 | $1.23 | 1d | 1 | 0.92mi |
| 807 E Main St New Albany, IN | 3.0 | 2.0 | 1500 | $1,650 | $1.10 | 20d | 1 | 1.06mi |
| 3819 River Park Dr Louisville, KY | 3.0 | 1.0 | 1108 | $1,090 | $0.98 | 20d | 1 | 1.07mi |
| 3922 River Park Dr Louisville, KY | 2.0 | 2.0 | 1800 | $1,195 | $0.66 | 11d | 1 | 1.09mi |
| 2906 Montgomery St Unit B Louisville, KY | 3.0 | 1.0 | 1152 | $1,060 | $0.92 | 23d | 1 | 1.12mi |
| 608 E Spring St Unit 2 New Albany, IN | 2.0 | 2.0 | 1100 | $1,195 | $1.09 | 23d | 1 | 1.15mi |
| 608 E Spring St Unit 2 New Albany, IN | 2.0 | 2.0 | 1100 | $1,195 | $1.09 | 3d | 1 | 1.15mi |
| 652 N 29th St Louisville, KY | 3.0 | 1.0 | 1127 | $1,350 | $1.20 | 17d | 1 | 1.17mi |
| 627 S 38th St Louisville, KY | 4.0 | 1.0 | 1300 | $1,349 | $1.04 | 16d | 1 | 1.18mi |
| 628 S 39th St Louisville, KY | 3.0 | 1.0 | 1448 | $1,220 | $0.84 | 16d | 1 | 1.19mi |
| 353 N 27th St Louisville, KY | 2.0 | 1.0 | 1100 | $1,100 | $1.00 | 23d | 1 | 1.20mi |
| 644 S 40th St Louisville, KY | 2.0 | 1.0 | 1200 | $1,500 | $1.25 | 2d | 1 | 1.26mi |
| 1112 E Spring St Unit 1 New Albany, IN | 2.0 | 2.0 | 1200 | $1,440 | $1.20 | 23d | 1 | 1.29mi |
| 652 S 37th St #9 Louisville, KY | 3.0 | 1.0 | 1070 | $1,095 | $1.02 | 23d | 1 | 1.32mi |
| 905 E Elm St New Albany, IN | 1.0–2.0 | 1.0 | 937 | $1,035 | $1.10 | 23d | 1 | 1.32mi |
| 663 S 43rd St Louisville, KY | 2.0 | 2.0 | 1736 | $1,250 | $0.72 | 23d | 1 | 1.35mi |
| 901 E Oak St New Albany, IN | 3.0 | 1.0 | 1100 | $1,350 | $1.23 | 23d | 1 | 1.38mi |
| 2506 Montgomery St Louisville, KY | 3.0 | 2.0 | 1081 | $1,295 | $1.20 | 3d | 4 | 1.39mi |
| 2529 W Main St #2 Louisville, KY | 3.0 | 1.0 | 1404 | $1,200 | $0.85 | 23d | 1 | 1.40mi |
| 212 N 25th St Louisville, KY | 3.0 | 1.0 | 1104 | $895 | $0.81 | 23d | 1 | 1.43mi |
| 2508 W Main St Louisville, KY | 3.0 | 1.0 | 1327 | $1,500 | $1.13 | 23d | 1 | 1.46mi |
Listing history 26 events
-
2026-06-18days on market $141,000 Active 27 DOM
-
2026-06-17days on market $141,000 Active 26 DOM
-
2026-06-16days on market $141,000 Active 25 DOM
-
2026-06-15days on market $141,000 Active 24 DOM
-
2026-06-13days on market $141,000 Active 22 DOM
-
2026-06-10days on market $141,000 Active 19 DOM
-
2026-06-09days on market $141,000 Active 18 DOM
-
2026-06-08days on market $141,000 Active 17 DOM
-
2026-06-07days on market $141,000 Active 16 DOM
-
2026-06-03days on market $141,000 Active 12 DOM
-
2026-06-02days on market $141,000 Active 11 DOM
-
2026-06-01days on market $141,000 Active 10 DOM
-
2026-05-31days on market $141,000 Active 9 DOM
-
2026-05-22$141,000 Active
-
2025-04-03price $149,900
-
2025-04-03price $149,900
-
2023-11-03soldstatus $114,999
-
2022-04-04soldstatus $65,000
-
2009-02-26historical
-
2009-01-21historical
-
2009-01-21$15,900
-
2008-04-15$15,900
-
2005-01-10soldstatus $79,000
-
2004-02-05soldstatus $57,500
-
1999-10-13soldstatus $41,000
-
1999-08-20$46,900
ⓘ Source: listings_history table (triggers on properties + properties_extension) + one-shot
backfill from property_details.listing_events for pre-trigger history.
Tax reassessment forecast KY · Resets to sale price
- Current annual tax
- $774 · $65/mo
- Projected year-2 tax
- $1,213 · $101/mo
- Expected delta
- +$439/yr (+$37/mo · 56.7%)
ⓘ Screening estimate from a state-policy table — verify with the county assessor before closing.
Climate risk First Street
- Flood 1/10 Low FEMA zone X (unshaded) · 0% chance over 30 yrs
- Wildfire 1/10 Low
- Heat 5/10 Major 7 d/yr ≥104°F today · 20 d/yr by 30 yrs out
- Wind 2/10 Low 2% chance of damaging wind over 30 yrs
- Air quality 2/10 Low 1 unhealthy d/yr today · 2 by 30 yrs out
Nearby sold comps map
Loading sold comps map…
Walkable amenities ~0.75 mi
Loading nearby amenities…
Taxation est. · year 1
- Rental income
- $15,754
- − Mortgage interest
- −$7,898
- − Property taxes
- −$774
- − Insurance
- −$705
- − Repairs & maintenance
- −$1,260
- − Management
- −$1,260
- − Depreciation
- −$4,102
- Taxable loss
- −$246
- Est. tax savings @ 24.0%
- +$59
- After-tax cash flow
- $2,153/yr
For passive investors: Depreciation is non-cash, so a rental often shows a tax loss while cash-flowing — sheltering income. Rental losses are passive: they offset passive income freely, and up to $25,000/yr can offset ordinary (W-2) income if you actively participate and your MAGI is under $100k (phasing out to $0 by $150k); unused losses carry forward. On sale, claimed depreciation is recaptured at up to 25%, and gains may owe capital-gains tax (a 1031 exchange can defer both). Figures are a year-1 estimate at your 24.0% rate — not tax advice; consult a CPA.
Schools (NCES district)
- District
- Jefferson County
- NCES district ID
- 2102990
- Math proficiency
- 19% ▼ -17.00%
- Reading proficiency
- 35% ▼ -11.00%
- Median HH income
- $47,885
- Composite
- 23.45/100
- National rank
- #7884
- State rank
- #121 of 165 in KY
Livability — Louisville
- Score
- 63/100
- State rank
- #333
- US rank
- #15887
Category grades
Schools grade is shown separately in the Schools card above.
Census & demographics
- Census place
- Louisville, KY
- County
- Jefferson County · 790,184 people
- City population
- 769,292
- Metro
- Louisville/Jefferson County, KY-IN
- Population (ZIP)
- 14,661
- Household income
- $35,753
- Rent vs Own
- Severe rent burden
- 1148.0
Population outlook (Jefferson County) Hauer SSP2
- Today (2025)
- 823,112 people
- By 2030
- 849,343 · +3.2%
- By 2040
- 895,696 · +8.8%
- By 2050
- 933,630 · +13.4%
- By 2075
- 1,028,262 · +24.9%
- By 2100
- 1,072,675 · +30.3%
Race, ethnicity, and origin ACS 2023
- Neighborhood character
- Majority Black (60%)
- Race & ethnicity
- Black 60% White 37% Two or more races 2% Hispanic / Latino 1%
- Common ancestry
- Slovak 1% Lithuanian 1% Iranian 1%
- Foreign-born
- 1% · Canada
- Languages at home
- 98% English-only · Spanish 1%
Political lean MEDSL · Jefferson
- 2024 margin
- D (+16.6) · D 57.4% · R 40.9% · Other 1.7%
- 2008→2024 swing
- +4.5pp toward D · 2008: 12.0pp · 2024: 16.6pp
- All cycles
- 2024: D+16.6 2020: D+20.1 2016: D+13.3 2012: D+11.1 2008: D+12.0
Not yet ingested
- Civics
- —
Market trends
- HPI YoY
- ▲ 29.02%
- Current HPI
- 293.2624
- Rent YoY
- ▲ 0.51%
- Metro
- Louisville/Jefferson County, KY-IN
- State GDP YoY
- ▲ 1.81%
- F500 in state
- 4
Industry mix (Fortune 500 HQ in KY)
| Industry | F500 HQs | Revenue |
|---|---|---|
| Healthcare | 1 | $118B |
|
||
| Food / Beverage | 1 | $7B |
|
||
Price history
+200.6% since first listed13 events — show timeline
- 2026-05-22 Listed $141,000 Metro Search MLS
- 2025-04-03 Price Changed $149,900 HKARMLS
- 2025-04-03 Price Changed $149,900 Metro Search MLS
- 2023-11-03 Sold (Public Records) $114,999 Public Records
- 2022-04-04 Sold (Public Records) $65,000 Public Records
- 2009-02-26 Listing Removed — Metro Search MLS
- 2009-01-21 Listed $15,900 Metro Search MLS
- 2009-01-21 Listing Removed — Metro Search MLS
- 2008-04-15 Listed $15,900 Metro Search MLS
- 2005-01-10 Sold (Public Records) $79,000 Public Records
- 2004-02-05 Sold (Public Records) $57,500 Public Records
- 1999-10-13 Sold (MLS) $41,000 Metro Search MLS
- 1999-08-20 Listed $46,900 Metro Search MLS
Property tax history
-1.9%/yrLatest (2025): $774 · -1.9% YoY. Source: county tax records.
Cash-flow waterfall
monthlySold comps — $/sqft
last 12 mo · ≤1 miLoading sold comps…