590 Oak Park Dr · Parsons, TN
Flood risk 1/10 · Minimal
- FEMA flood zone
- X (unshaded)
- Chance of flooding over 30 yrs
- 0.0%
- Est. flood insurance / yr
- $507 – $1,088
Fire risk 4/10 · Minor
- Est. fire insurance / yr
- $949 – $1,763
Heat risk 5/10 · Moderate
- Hot days now (above 109°F)
- 7 days/yr
- Hot days in 30 yrs
- 20 days/yr
Wind risk 4/10 · Minor
- Chance of severe wind over 30 yrs
- 13.0%
Air-quality risk 1/10 · Minimal
- Unhealthy air days now
- 0 days/yr
- Unhealthy air days in 30 yrs
- 0 days/yr
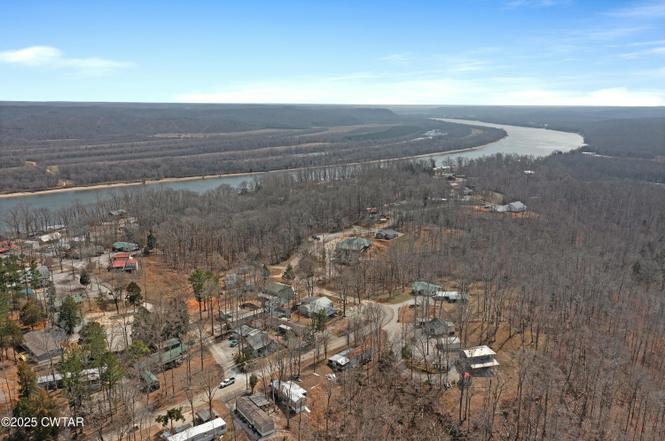
Risk factors via First Street. Map © Google.
Why this score? — see what drove the D- grade
The composite is a weighted blend of 9 inputs, each scored 0–100. Each bar is that input's sub-score; the figure is the points it added to the 100-point composite (weight × sub-score).
- Cash flow +8.0/30.0
- ARV discount +7.5/15.0
- Appreciation +5.9/10.0
- Schools +3.2/10.0
- Livability +3.0/5.0
- Rent growth +2.5/5.0
- Condition / age +2.5/5.0
- 1% rule +2.4/10.0
- DSCR +2.0/10.0
$139,500
🖨 Deal sheet (PDF) 📄 Offer letter ✓ Due diligence
Listing remarks
This charming 3-bedroom, 2-bath mobile home is tucked on a corner lot in Woodlawn Shores, just a short golf cart ride to the river. Whether you're dreaming of quiet weekends away or a seasonal escape filled with fun on the water, this home delivers. The spacious layout offers plenty of room to relax after a day outdoors, while the boat/trailer shed provides the perfect spot to keep your river gear ready to go. Imagine warm summer nights on the porch, mornings by the water, and making memories with family and friends in your own river retreat. With a significant price reduction, now is the time to make it yours. Being sold as is. This charming 3-bedroom, 2-bath mobile home is tucked on a cor
Key facts
- Full bathroom
- Living area
- Corner lot
Tags
Neighborhood map
What this means for you Summary
Snapshot
- This is a 3-bed/2.0-bath other listed at $140k.
Deal economics
- At list price, monthly cash flow is $-144 ($-2k/yr) — negative.
- To cash-flow at today's rent, offer at most $119k (14.9% below list).
- To meet the 1% rule (rent ≥ 1% of price), the offer needs to be $104k (25.6% below list).
- Recommended offer: $104k (25.6% below list) — sets the bar for 1% rule.
Location & tenants
- Location reads 59/100 on livability (#288 in TN) — a working-class tenant base; expect higher turnover. Strengths: cost of living A+, housing A-; Watch: health & safety C-, crime F, amenities F.
- Decatur County (rural): math 45% / reading 33% proficiency, ranked #19 of 139 in TN (top 14%) — families likely to look elsewhere, expect single-tenant / working-renter base with shorter leases.
- Zoned schools: Parsons Elementary (math 52% / reading 47%, grade D, #119 of 952 statewide, top 14%, 376 students, 0% FRL); Decatur County Middle School (math 48% / reading 28%, grade F, #51 of 333 statewide, top 16%, 426 students, 0% FRL); Riverside High School (math 27% / reading 27%, grade F, #104 of 332 statewide, top 33%, 460 students, 0% FRL) — zoned schools average 0% FRL vs 50% district-wide (50 pts lower); this property's tenant base skews higher-income than the district average.
- Market conditions: 38 active listings in the ZIP; 10 units permitted in Decatur County in 2024 (0 in 5+ unit buildings).
Forward outlook
- In year one you build about $3k of equity ($964 loan paydown + $2k appreciation (1.8% local appreciation)).
- Decatur County population projected at -16% by 2050 — secular population decline; favor cash flow + early exit over multi-decade hold.
- By year 10, paydown + projected appreciation supports a ~$34k cash-out refi (75% LTV) — recoverable capital for the next deal without selling this one.
Negotiation context
- It's been on market 361 days — a 12% lower offer ($123k) is reasonable based on typical stale-listing flexibility.
- Current owner paid $40k; list at $140k implies a 249% gain — meaningful room to come down on a strong offer.
Risks & watch-outs
- Climate carrying-cost: extreme-heat days projected 7→20/yr by 2055 (HVAC capex compounding) — expect insurance premiums to compound above CPI over the hold.
Questions for the listing agent
- What do current leases actually rent for vs. the listed asking? Can we see a recent rent roll and the last 12 months of T-12 income?
- It's been on market 361 days. Have you received any prior offers? Is the seller open to a 26% concession, seller financing, or rate buy-down credit?
- Why hasn't it sold? Are there any deal-killer items the seller is aware of (foundation, flood, title, zoning, code violations)?
- Is there a deadline driving the sale (1031 exchange, divorce, estate, relocation)? That informs how much negotiation room exists.
- Schools are F-rated, which usually means shorter tenancies and higher turnover. Who's the typical renter profile here, and what's been the actual vacancy rate?
- Crime grade is F in this area — have there been break-ins, vandalism, or insurance claims at this property in the last 3 years? What carrier currently insures it and at what premium?
- The area grade is low — what's the realistic commute time and amenity access for the typical tenant pool here? Any planned neighborhood developments (good or bad) we should know about?
- What's the average days-on-market for RENTAL listings here right now (not sales)? A rising rental-DOM trend means longer vacancies and softer asking-rent achievability than the comps imply.
- What's the recent tenant-quality profile in this submarket — average credit score on applications, eviction rate, late-payment / NSF rate, and stable-employment percentage? A property-management company in the area should have these aggregated.
- How much new for-sale + rental construction is in the pipeline within 1–3 miles? Heavy new supply typically softens prices + rents 12–24 months out; constrained supply supports both.
Investment metrics
- 1% rule
- 0.74% ✗
- Cap rate
- 5.06%
- Cash-on-cash
- -4.42%
- DSCR
- 0.80
- GRM
- 11.2
CMA / ARV
No comps found within radius.
Projected returns pro-forma
1.75% appreciation · 3.0% rent growth · sell at horizon
- IRR
- -0.7%
- Equity multiple
- 0.96×
- Total profit
- $-1,368
- Equity at exit
- $53,113
- IRR
- 3.8%
- Equity multiple
- 1.51×
- Total profit
- $19,839
- Equity at exit
- $75,043
Cash invested: $39,060 (down + closing). Projections, not guarantees.
Landlord ↔ Tenant lean methodology
- Overall (STATE)
- 87 Strongly Landlord-Friendly
- State Tennessee
- 87 Strongly Landlord-Friendly · R+13
- County
- — inherits STATE
- City
- — inherits STATE
ZIP-level market 38380
- Home prices YoY
- 0.7%
- Active inventory
- 38
- Price-to-rent
- 11.2×
Monthly cashflow live
- Estimated rent
- $1,038 medium interval (Pro) →
- Mortgage (P&I)
- −$732
- Tax est. 1.5%
- −$174 /mo · $2,092/yr
- Insurance
- −$58
- HOA
- −$0
- Vacancy / Maint / Mgmt
- −$218
- Net cashflow
- $-144
Break-even live
Sensitivity live
| Price | -10% $-47 | -5% $-96 | +0% $-144 | +5% $-192 | +10% $-240 |
|---|---|---|---|---|---|
| Rent | -10% $-226 | -5% $-185 | +0% $-144 | +5% $-103 | +10% $-62 |
| Rate | -1.0pp $-73 | -0.5pp $-108 | base $-144 | +0.5pp $-180 | +1.0pp $-217 |
UW: 25.0% down · 7.5% · 30yr · 1.5% tax · 5.0% vac · 8.0% maint · 8.0% mgmt
Financing live
Cash to close
- Down payment
- $34,875
- Closing costs
- $4,185
- Reserves months
- —
- Total cash needed
- —
Loan-product check · same deal, 3 products live
Conventional
25% down · 7.5% · 30yr
- Down + closing
- —
- Monthly P&I
- —
- Monthly cashflow
- —
- DSCR
- —
- Eligible?
- —
Personal DTI + credit; lowest rate.
DSCR
20% down · 8.5% · 30yr
- Down + closing
- —
- Monthly P&I
- —
- Monthly cashflow
- —
- DSCR
- —
- Eligible?
- —
No personal income docs; deal must DSCR.
Hard money
10% down · 12.0% · 12mo
- Down + closing
- —
- Monthly P&I
- —
- Monthly cashflow
- —
- DSCR
- —
- Eligible?
- —
Short-term bridge; refi at stabilization.
Listing history 4 events
-
2026-03-16status Pending
-
2025-09-20price $139,500
-
2025-03-20$179,900 Active
-
2009-06-22soldstatus $40,000
ⓘ Source: listings_history table (triggers on properties + properties_extension) + one-shot
backfill from property_details.listing_events for pre-trigger history.
Climate risk First Street
- Flood 1/10 Low FEMA zone X (unshaded) · 0% chance over 30 yrs
- Wildfire 4/10 Moderate
- Heat 5/10 Major 7 d/yr ≥109°F today · 20 d/yr by 30 yrs out
- Wind 4/10 Moderate 13% chance of damaging wind over 30 yrs
- Air quality 1/10 Low 0 unhealthy d/yr today · 0 by 30 yrs out
Nearby sold comps map
Loading sold comps map…
Walkable amenities ~0.75 mi
Loading nearby amenities…
Taxation est. · year 1
- Rental income
- $12,461
- − Mortgage interest
- −$7,814
- − Property taxes
- −$2,092
- − Insurance
- −$698
- − Repairs & maintenance
- −$997
- − Management
- −$997
- − Depreciation
- −$4,058
- Taxable loss
- −$4,195
- Est. tax savings @ 24.0%
- +$1,007
- After-tax cash flow
- $-718/yr
For passive investors: Depreciation is non-cash, so a rental often shows a tax loss while cash-flowing — sheltering income. Rental losses are passive: they offset passive income freely, and up to $25,000/yr can offset ordinary (W-2) income if you actively participate and your MAGI is under $100k (phasing out to $0 by $150k); unused losses carry forward. On sale, claimed depreciation is recaptured at up to 25%, and gains may owe capital-gains tax (a 1031 exchange can defer both). Figures are a year-1 estimate at your 24.0% rate — not tax advice; consult a CPA.
Schools (NCES district)
- District
- Decatur County
- NCES district ID
- 4700960
- Math proficiency
- 45% ▼ -5.00%
- Reading proficiency
- 33% ▬ 0.00%
- Median HH income
- $34,877
- Composite
- 32.28/100
- National rank
- #5756
- State rank
- #19 of 139 in TN
Livability — Parsons
- Score
- 59/100
- State rank
- #288
- US rank
- #20310
Category grades
Schools grade is shown separately in the Schools card above.
Census & demographics
- City population
- 5,600
- Population (ZIP)
- 450
Population outlook (Decatur County) Hauer SSP2
- Today (2025)
- 11,311 people
- By 2030
- 10,995 · -2.8%
- By 2040
- 10,268 · -9.2%
- By 2050
- 9,512 · -15.9%
- By 2075
- 7,988 · -29.4%
- By 2100
- 6,639 · -41.3%
Race, ethnicity, and origin ACS 2023
- Neighborhood character
- Predominantly White (99%)
- Race & ethnicity
- White 99% Two or more races 1%
- Common ancestry
- Italian 3% Iranian 3% Lithuanian 2%
Political lean MEDSL · Decatur
- 2024 margin
- Solid R (+69.1) · D 15.0% · R 84.1%
- 2008→2024 swing
- -36.9pp toward R · 2008: -32.2pp · 2024: -69.1pp
- All cycles
- 2024: R+69.1 2020: R+63.4 2016: R+58.7 2012: R+37.0 2008: R+32.2
Not yet ingested
- Civics
- —
Market trends
- HPI YoY
- ▲ 1.75%
- Current HPI
- 250.0398
- Rent YoY
- —
- Metro
- —
- State GDP YoY
- ▲ 2.78%
- F500 in state
- 22
Industry mix (Fortune 500 HQ in TN)
| Industry | F500 HQs | Revenue |
|---|---|---|
| Healthcare | 3 | $91B |
|
||
| Retail | 3 | $72B |
|
||
| Transportation / Logistics | 1 | $88B |
|
||
| Paper / Packaging | 1 | $19B |
|
||
| Insurance | 1 | $13B |
|
||
| Energy | 1 | $12B |
|
||
Price history
+248.7% since first listed4 events — show timeline
- 2026-03-16 Pending — CWTAR
- 2025-09-20 Price Changed $139,500 CWTAR
- 2025-03-20 Listed $179,900 CWTAR
- 2009-06-22 Sold (Public Records) $40,000 Public Records
Property tax history
+5.6%/yrLatest (2025): $193 · -2.0% YoY. Source: county tax records.
Cash-flow waterfall
monthlySold comps — $/sqft
last 12 mo · ≤1 miLoading sold comps…