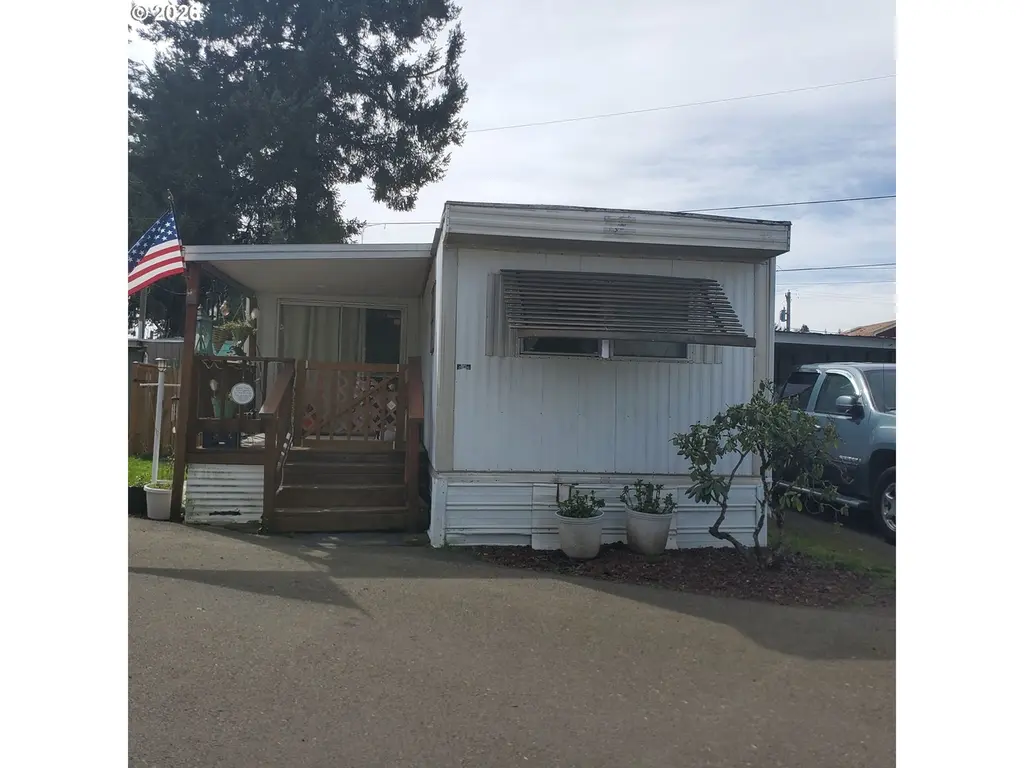
3950 Coburg Rd #3 · Eugene, OR
Flood risk 1/10 · Minimal
- FEMA flood zone
- X (shaded)
- Chance of flooding over 30 yrs
- 0.0%
- Est. flood insurance / yr
- $507 – $1,088
Fire risk 4/10 · Minor
- Est. fire insurance / yr
- $498 – $926
Heat risk 4/10 · Minor
- Hot days now (above 91°F)
- 7 days/yr
- Hot days in 30 yrs
- 15 days/yr
Wind risk 1/10 · Minimal
- Chance of severe wind over 30 yrs
- —
Air-quality risk 10/10 · Severe
- Unhealthy air days now
- 13 days/yr
- Unhealthy air days in 30 yrs
- 15 days/yr
Risk factors via First Street. Map © Google.
Why this score? — see what drove the C- grade
The composite is a weighted blend of 9 inputs, each scored 0–100. Each bar is that input's sub-score; the figure is the points it added to the 100-point composite (weight × sub-score).
- Cash flow +15.0/30.0
- ARV discount +11.6/15.0
- 1% rule +5.0/10.0
- DSCR +5.0/10.0
- Schools +4.2/10.0
- Livability +4.0/5.0
- Rent growth +3.5/5.0
- Condition / age +2.5/5.0
- Appreciation +0.0/10.0
$31,500
🖨 Deal sheet 📄 Offer letter ✓ Due diligence
Listing remarks MLS
55+ Park. This cute home is located in a desirable area, Not far away from beautiful Armitage Park — perfect for evening walks. Water, sewer, and garbage are included, making this home affordable. The park also offers a community recreation room that can be reserved for gatherings and parties. Park approval required.
Key facts
- Built 1966
- Listed 87 days
Neighborhood map
What this means for you Summary
Snapshot
- This is a 2-bed/1.0-bath manufactured listed at $32k.
Deal economics
- At list price, monthly cash flow is $1k ($16k/yr) — positive.
- The deal already cash-flows at list — no discount required.
- Meets the 1% rule at list price ($2k rent vs $32k).
- Recommended offer: $30k (6.0% below list) — sets the bar for market timing.
- Cap rate 58.0% vs local median 2.8% in Eugene — top-decile yield for the area; either an underpriced asset or a hidden risk that comps aren't pricing in. Stress-test before assuming the spread holds.
Location & tenants
- Location reads 81/100 on livability (#52 in OR, #1,587 nationally) — a professional / high-income tenant draw. Strengths: amenities A+, commute A+, health & safety A+; Watch: employment C-, cost of living C-, crime D-.
- Eugene SD 4J (urban): math 45% / reading 55% proficiency, ranked #10 of 58 in OR (top 17%) — acceptable for families but not a draw, mixed tenant base, ~2y average lease.
- Market conditions: Rents rising (+4.0%/yr); 100 active listings in the ZIP; 5 comparable units currently listed for rent nearby; rentals leasing fast (median 13d on market — plan ~1-2 weeks tenant-placement turnaround); solid renter incomes; 1,808 units permitted in Lane County in 2024 (972 in 5+ unit buildings).
Forward outlook
- Local home prices are declining (-3.0%/yr); year-one equity from $218 of loan paydown is wiped out by about $945 of value loss. Plan a longer hold.
- Lane County population projected at +15% by 2050 — long-run rental-demand tailwind backs the buy-and-hold thesis.
- At projected returns (-3.0% appreciation + 4.0% rent growth), your $9k cash investment doubles in ~1 year — after that, you're playing with house money.
Negotiation context
- It's been on market 87 days — a 6% lower offer ($30k) is reasonable based on typical stale-listing flexibility.
Questions for the listing agent
- It's been on market 87 days. Have you received any prior offers? Is the seller open to a 6% concession, seller financing, or rate buy-down credit?
- Built in 1966 — when were the roof, HVAC, electrical panel, plumbing, and water heater last replaced?
- Why hasn't it sold? Are there any deal-killer items the seller is aware of (foundation, flood, title, zoning, code violations)?
- Is there a deadline driving the sale (1031 exchange, divorce, estate, relocation)? That informs how much negotiation room exists.
- Schools are B-rated — typically a magnet for longer-tenancy family renters. What's the average tenant stay here, and is there a school-zone premium baked into asking?
- Crime grade is D in this area — have there been break-ins, vandalism, or insurance claims at this property in the last 3 years? What carrier currently insures it and at what premium?
- What's the average days-on-market for RENTAL listings here right now (not sales)? A rising rental-DOM trend means longer vacancies and softer asking-rent achievability than the comps imply.
- What's the recent tenant-quality profile in this submarket — average credit score on applications, eviction rate, late-payment / NSF rate, and stable-employment percentage? A property-management company in the area should have these aggregated.
- How much new for-sale + rental construction is in the pipeline within 1–3 miles? Heavy new supply typically softens prices + rents 12–24 months out; constrained supply supports both.
Investment metrics
- 1% rule
- 6.32% ✓
- Cap rate
- 57.95%
- Cash-on-cash
- 184.49%
- DSCR
- 9.21
- GRM
- 1.3
CMA / ARV
- ARV (median comp)
- $34,622
- List price
- $31,500
- Delta
- -9.02%
- Verdict
- FAIR
- Comps
- 5 within 1.0 mi
Show comp detail 1 sale within ~0.75 mi
| Address | Dist | Beds/Ba | Sqft | Sold | Price | $/sf | Match |
|---|---|---|---|---|---|---|---|
| 3950 Coburg Rd #11 | 0.00mi | 1/1.0 (-1) | 492 (-10%) | 21mo | $20,000 | $41 | 60 |
Match score weights: distance 35% · size 25% · config 20% · recency 20%. Top-matched comps best support the ARV.
Projected returns pro-forma
-3.0% appreciation · 3.97% rent growth · sell at horizon
- IRR
- —
- Equity multiple
- 10.44×
- Total profit
- $83,253
- Equity at exit
- $4,697
- IRR
- —
- Equity multiple
- 22.77×
- Total profit
- $192,040
- Equity at exit
- $2,724
Cash invested: $8,820 (down + closing). Projections, not guarantees.
Landlord ↔ Tenant lean methodology
- Overall (STATE)
- 28 Tenant-Leaning
- State Oregon
- 28 Tenant-Leaning · D+6
- County
- — inherits STATE
- City
- — inherits STATE
ZIP-level market 97408
- Rents YoY
- 4.0%
- Active inventory
- 100
- Price-to-rent
- 1.3×
Monthly cashflow live
- Estimated rent
- $1,992 high interval (Pro) →
- Mortgage (P&I)
- −$165
- Tax est. 1.5%
- −$39 /mo · $472/yr
- Insurance
- −$13
- HOA
- −$0
- Vacancy / Maint / Mgmt
- −$418
- Net cashflow
- $1,356
Break-even live
UW: 25.0% down · 7.5% · 30yr · 1.5% tax · 5.0% vac · 8.0% maint · 8.0% mgmt
Financing live
Cash to close
- Down payment
- $7,875
- Closing costs
- $945
- Reserves months
- —
- Total cash needed
- —
Loan-product check · same deal, 3 products live
Conventional
25% down · 7.5% · 30yr
- Down + closing
- —
- Monthly P&I
- —
- Monthly cashflow
- —
- DSCR
- —
- Eligible?
- —
Personal DTI + credit; lowest rate.
DSCR
20% down · 8.5% · 30yr
- Down + closing
- —
- Monthly P&I
- —
- Monthly cashflow
- —
- DSCR
- —
- Eligible?
- —
No personal income docs; deal must DSCR.
Hard money
10% down · 12.0% · 12mo
- Down + closing
- —
- Monthly P&I
- —
- Monthly cashflow
- —
- DSCR
- —
- Eligible?
- —
Short-term bridge; refi at stabilization.
Rent comps 5 comps
| Address | Beds | Baths | Sqft | Rent | $/sqft | DOM | Units | Dist |
|---|---|---|---|---|---|---|---|---|
| 2459 Lakeview Dr Eugene, OR | 1.0–3.0 | 1.0–2.0 | 966 | $1,790 | $1.85 | 13d | 24 | 1.00mi |
| 2733 Shadow View Dr Eugene, OR | 2.0 | 1.0–2.0 | 847 | $2,715 | $3.21 | 13d | 11 | 1.18mi |
| 2847 Tennyson Ave Eugene, OR | 3.0 | 1.0–2.0 | 902 | $2,178 | $2.41 | 13d | 8 | 1.23mi |
| 2940 Crescent Ave Eugene, OR | 1.0–2.0 | 1.0–2.0 | 849 | $1,930 | $2.27 | 13d | 14 | 1.25mi |
| 89325 Old Coburg Rd Unit 123 Eugene, OR | 1.0 | 1.0 | 743 | $1,400 | $1.88 | 43d | 1 | 1.36mi |
Listing history 18 events
-
2026-06-18days on market $31,500 Active 87 DOM
-
2026-06-17days on market $31,500 Active 86 DOM
-
2026-06-16days on market $31,500 Active 85 DOM
-
2026-06-15days on market $31,500 Active 84 DOM
-
2026-06-14days on market $31,500 Active 82 DOM
-
2026-06-13days on market $31,500 Active 81 DOM
-
2026-06-10days on market $31,500 Active 79 DOM
-
2026-06-09days on market $31,500 Active 78 DOM
-
2026-06-08days on market $31,500 Active 77 DOM
-
2026-06-07days on market $31,500 Active 76 DOM
-
2026-06-05days on market $31,500 Active 73 DOM
-
2026-06-03days on market $31,500 Active 72 DOM
-
2026-06-02days on market $31,500 Active 71 DOM
-
2026-06-01days on market $31,500 Active 70 DOM
-
2026-05-31days on market $31,500 Active 69 DOM
-
2026-05-30days on market $31,500 Active 68 DOM
-
2026-05-02price $31,500 327-char remark
Show marketing remark (327 chars)
55+ Park. This cute home is located in a desirable area, Not far away from beautiful Armitage Park — perfect for evening walks. Water, sewer, and garbage are included, making this home affordable. The park also offers a community recreation room that can be reserved for gatherings and parties. Park approval required.
-
2026-03-23$34,900 Active 327-char remark
Show marketing remark (327 chars)
55+ Park. This cute home is located in a desirable area, Not far away from beautiful Armitage Park — perfect for evening walks. Water, sewer, and garbage are included, making this home affordable. The park also offers a community recreation room that can be reserved for gatherings and parties. Park approval required.
ⓘ Source: listings_history table (triggers on properties + properties_extension) + one-shot
backfill from property_details.listing_events for pre-trigger history.
Climate risk First Street
- Flood 1/10 Low FEMA zone X (shaded) · 0% chance over 30 yrs
- Wildfire 4/10 Moderate
- Heat 4/10 Moderate 7 d/yr ≥91°F today · 15 d/yr by 30 yrs out
- Wind 1/10 Low
- Air quality 10/10 Extreme 13 unhealthy d/yr today · 15 by 30 yrs out
Nearby sold comps map
Loading sold comps map…
Walkable amenities ~0.75 mi
Loading nearby amenities…
Taxation est. · year 1
- Rental income
- $23,904
- − Mortgage interest
- −$1,764
- − Property taxes
- −$472
- − Insurance
- −$158
- − Repairs & maintenance
- −$1,912
- − Management
- −$1,912
- − Depreciation
- −$916
- Taxable income
- $16,769
- Est. tax owed @ 24.0%
- −$4,024
- After-tax cash flow
- $12,248/yr
For passive investors: Depreciation is non-cash, so a rental often shows a tax loss while cash-flowing — sheltering income. Rental losses are passive: they offset passive income freely, and up to $25,000/yr can offset ordinary (W-2) income if you actively participate and your MAGI is under $100k (phasing out to $0 by $150k); unused losses carry forward. On sale, claimed depreciation is recaptured at up to 25%, and gains may owe capital-gains tax (a 1031 exchange can defer both). Figures are a year-1 estimate at your 24.0% rate — not tax advice; consult a CPA.
Schools (NCES district)
- District
- Eugene SD 4J
- NCES district ID
- 4104740
- Math proficiency
- 45% ▼ -2.00%
- Reading proficiency
- 55% ▼ -4.00%
- Median HH income
- $43,688
- Composite
- 42.15/100
- National rank
- #3302
- State rank
- #10 of 58 in OR
Livability — Eugene
- Score
- 81/100
- State rank
- #52
- US rank
- #1587
Category grades
Schools grade is shown separately in the Schools card above.
Census & demographics
- County
- Lane County · 310,476 people
- City population
- 215,212
- Metro
- Eugene-Springfield, OR
- Population (ZIP)
- 15,420
- Household income
- $104,945
- Rent vs Own
- Severe rent burden
- 402.0
Population outlook (Lane County) Hauer SSP2
- Today (2025)
- 391,933 people
- By 2030
- 405,860 · +3.6%
- By 2040
- 429,386 · +9.6%
- By 2050
- 452,016 · +15.3%
- By 2075
- 508,825 · +29.8%
- By 2100
- 531,208 · +35.5%
Race, ethnicity, and origin ACS 2023
- Neighborhood character
- Predominantly White (77%)
- Race & ethnicity
- White 77% Two or more races 11% Hispanic / Latino 9% Asian 4% Black 3%
- Hispanic origin (detail)
- Mexican 4% Puerto Rican 1%
- Common ancestry
- Slovak 5% Lithuanian 5% Portuguese 4%
- Foreign-born
- 7% · Canada, China, South Korea
- Languages at home
- 91% English-only · Spanish 4% French/Haitian/Cajun 1% Chinese 1%
Political lean MEDSL · Lane
- 2024 margin
- Strong D (+23.1) · D 60.0% · R 36.9% · Other 3.1%
- 2008→2024 swing
- -4.3pp toward R · 2008: 27.4pp · 2024: 23.1pp
- All cycles
- 2024: D+23.1 2020: D+24.3 2016: D+18.9 2012: D+23.4 2008: D+27.4
Not yet ingested
- Civics
- —
Market trends
- HPI YoY
- ▼ -196.97%
- Current HPI
- 286.5805
- Rent YoY
- ▲ 3.97%
- Metro
- Eugene-Springfield, OR
- State GDP YoY
- ▲ 2.05%
- F500 in state
- 2
Industry mix (Fortune 500 HQ in OR)
| Industry | F500 HQs | Revenue |
|---|---|---|
| Consumer Goods | 1 | $51B |
|
||
Price history
-9.7% since first listed2 events — show timeline
- 2026-05-02 Price Changed $31,500 RMLS
- 2026-03-23 Listed $34,900 RMLS
Property tax history
-32.2%/yrLatest (2015): $6 · +0.0% YoY. Source: county tax records.
Cash-flow waterfall
monthlySold comps — $/sqft
last 12 mo · ≤1 miLoading sold comps…