 Fourplex
5619 S 2200 W · Roy, UT
Flood risk 1/10 · Minimal
- FEMA flood zone
- X (unshaded)
- Chance of flooding over 30 yrs
- 0.0%
- Est. flood insurance / yr
- $473 – $860
Fire risk 4/10 · Minor
- Est. fire insurance / yr
- $453 – $841
Heat risk 4/10 · Minor
- Hot days now (above 93°F)
- 6 days/yr
- Hot days in 30 yrs
- 15 days/yr
Wind risk 1/10 · Minimal
- Chance of severe wind over 30 yrs
- —
Air-quality risk 4/10 · Minor
- Unhealthy air days now
- 4 days/yr
- Unhealthy air days in 30 yrs
- 5 days/yr
Risk factors via First Street. Map © Google.
Why this score? — see what drove the C+ grade
The composite is a weighted blend of 9 inputs, each scored 0–100. Each bar is that input's sub-score; the figure is the points it added to the 100-point composite (weight × sub-score).
- Cash flow +25.5/30.0
- DSCR +8.5/10.0
- ARV discount +7.5/15.0
- 1% rule +6.7/10.0
- Livability +4.0/5.0
- Schools +3.2/10.0
- Condition / age +2.8/5.0
- Rent growth +2.4/5.0
- Appreciation +0.0/10.0
$679,000
🖨 Deal sheet 📄 Offer letter ✓ Due diligence
Multi-family units
County records classify this as Multi-Family (2-4 Unit). Listing-text estimate: 4 units. confirmed
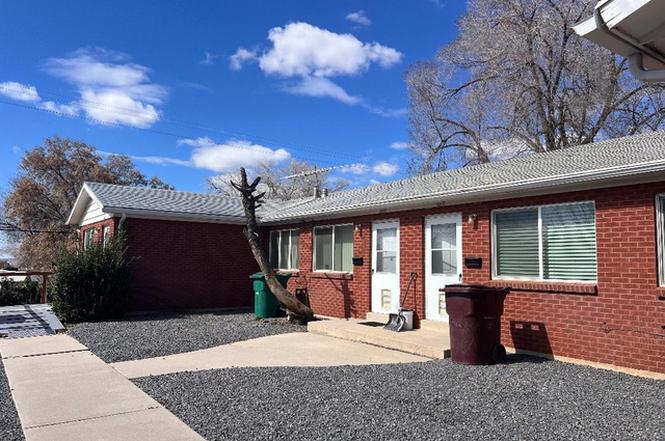
Listing remarks
Fully brick fourplex with a metal roof. Updated electrical boxes, undated furnaces, central air units, windows up and water heaters. Each unit has stack washer/dryer except 5617 unit has laundry down. Two units have walk in showers/ two units has tubs. Well maintained, easy care yard, zeroscaped. All hardwood floors and tile.
Key facts
- Stack washer dryer
- Metal roof
- Updated furnaces
Tags
Property features AI
Finance
- Other: Landscaping: full and xeriscaped areas; Topography: mostly flat
- Financial info: Multi-family zoning; Property contains 4 total units; Unit rents (as reported): two units at $1,000 each; two units at $800 each (one listing shows 4 units with $1,000 rent and square footage noted for a larger unit)
Exterior
- Parking: Uncovered open parking; Five total parking spaces (all open)
- Utilities: Natural gas connected; Electricity connected; Public sewer connected; Culinary water
- Home design: Side-by-side multi-family building; Single-level living / ground level accessibility; Faces southeast; Agent owned; Residential use
- Construction: Built in 2015 (effective year); Brick construction; Metal roof; Building in good standing / built and standing
- Exterior features: Basement entrance; Walkout; Double pane windows; Storm doors; Partially fenced; Curb and gutter; Sidewalks; Automatic full sprinkler system; Mountain view
Interior
- Kitchen: Updated kitchen(s); Free standing range/oven; Built-in dishwasher
- Bedrooms: Four 2-bedroom units (unit breakdown below includes bedroom counts per unit); One 2-bedroom unit; Three 1-bedroom units
- Flooring: Hardwood flooring; Laminate flooring
- Bathrooms: Total of 4 bathrooms across units; Some units include 1/4 bath (as noted in directions)
- Heating & cooling: Forced air heating; Gas central heating
- Interior features: Updated kitchen; Range/oven (free standing); Built-in dishwasher; Blinds; Window coverings
- Laundry & utility: Electric dryer hookup
Neighborhood map
What this means for you Summary
Snapshot
- This is a 4 × 4-bed/19.0-bath units multifamily listed at $679k. Condition is rated average.
Deal economics
- At list price, monthly cash flow is $2k ($19k/yr) — positive. Per door: $399/mo.
- The deal already cash-flows at list — no discount required.
- Meets the 1% rule at list price ($8k rent vs $679k).
- Recommended offer: $618k (9.0% below list) — sets the bar for market timing.
Location & tenants
- Location reads 81/100 on livability (#32 in UT, #1,449 nationally) — a professional / high-income tenant draw. Strengths: housing A+, health & safety A+, commute A; Watch: amenities F.
- Weber District (suburban): math 36% / reading 35% proficiency, ranked #56 of 80 in UT (top 70%) — families likely to look elsewhere, expect single-tenant / working-renter base with shorter leases.
- Zoned schools: Midland School (math 37% / reading 28%, grade F, #416 of 585 statewide, top 71%, 568 students, 29% FRL); Roy Jr High (math 23% / reading 25%, grade F, #123 of 138 statewide, top 90%, 1,008 students, 37% FRL); Roy High (math 15% / reading 39%, grade F, #131 of 171 statewide, top 79%, 1,834 students, 28% FRL).
- Market conditions: Rents soft (-0.5%/yr); 203 active listings in the ZIP; solid renter incomes; 1,630 units permitted in Weber County in 2024 (521 in 5+ unit buildings).
- At $7,958/mo this rent would consume 105% of the median local household income ($91k/yr) (locally 216% of renters already pay >50% of income on rent) — very limited rent-growth headroom before tenants either downsize or default.
Forward outlook
- Local home prices are declining (-3.0%/yr); year-one equity from $5k of loan paydown is wiped out by about $20k of value loss. Plan a longer hold.
- Weber County population projected at +24% by 2050 — long-run rental-demand tailwind backs the buy-and-hold thesis.
Negotiation context
- It's been on market 102 days — a 9% lower offer ($618k) is reasonable based on typical stale-listing flexibility.
Questions for the listing agent
- It's been on market 102 days. Have you received any prior offers? Is the seller open to a 9% concession, seller financing, or rate buy-down credit?
- Can we see the unit-by-unit rent roll, current vacancy, and any below-market leases? What's the average tenancy length?
- What capital expenditures (roof, boiler, parking lot, exteriors) have been made in the last 5 years, and what's planned in the next 2?
- Built in 1960 — when were the roof, HVAC, electrical panel, plumbing, and water heater last replaced?
- Why hasn't it sold? Are there any deal-killer items the seller is aware of (foundation, flood, title, zoning, code violations)?
- Is there a deadline driving the sale (1031 exchange, divorce, estate, relocation)? That informs how much negotiation room exists.
- Schools are D-rated, which usually means shorter tenancies and higher turnover. Who's the typical renter profile here, and what's been the actual vacancy rate?
- What's the average days-on-market for RENTAL listings here right now (not sales)? A rising rental-DOM trend means longer vacancies and softer asking-rent achievability than the comps imply.
- What's the recent tenant-quality profile in this submarket — average credit score on applications, eviction rate, late-payment / NSF rate, and stable-employment percentage? A property-management company in the area should have these aggregated.
- How much new apartment / multifamily construction is in the pipeline within 1–3 miles? Heavy new supply (>2% of stock underway) typically softens rents 12–24 months out; light construction supports rent growth.
Investment metrics
- 1% rule
- 1.17% ✓
- Cap rate
- 9.11%
- Cash-on-cash
- 10.06%
- DSCR
- 1.45
- GRM
- 7.1
CMA / ARV
No comps found within radius.
Projected returns pro-forma
-3.0% appreciation · 0.0% rent growth · sell at horizon
- IRR
- -4.6%
- Equity multiple
- 0.83×
- Total profit
- $-31,680
- Equity at exit
- $101,241
- IRR
- 1.2%
- Equity multiple
- 1.07×
- Total profit
- $13,531
- Equity at exit
- $58,708
Cash invested: $190,120 (down + closing). Projections, not guarantees.
Landlord ↔ Tenant lean methodology
- Overall (STATE)
- 86 Strongly Landlord-Friendly
- State Utah
- 86 Strongly Landlord-Friendly · R+15
- County
- — inherits STATE
- City
- — inherits STATE
ZIP-level market 84067
- Rents YoY
- -0.5%
- Active inventory
- 203
- Price-to-rent
- 28.4×
Monthly cashflow live
- Estimated rent
- $7,958 high interval (Pro) →
- Mortgage (P&I)
- −$3,561
- Tax est. 1.5%
- −$849 /mo · $10,185/yr
- Insurance
- −$283
- HOA
- −$0
- Vacancy / Maint / Mgmt
- −$1,671
- Net cashflow
- $1,594
Break-even live
4-unit breakdown (identical units grouped — click to expand)
| Units | Beds | Baths | Est. rent |
|---|---|---|---|
| 4× units | 4 | 19 | $7,956 |
| #1 | 4 | 19 | $1,989 |
| #2 | 4 | 19 | $1,989 |
| #3 | 4 | 19 | $1,989 |
| #4 | 4 | 19 | $1,989 |
| Total (4 units) | $7,958 | ||
UW: 25.0% down · 7.5% · 30yr · 1.5% tax · 5.0% vac · 8.0% maint · 8.0% mgmt
Financing live
Cash to close
- Down payment
- $169,750
- Closing costs
- $20,370
- Reserves months
- —
- Total cash needed
- —
Loan-product check · same deal, 3 products live
Conventional
25% down · 7.5% · 30yr
- Down + closing
- —
- Monthly P&I
- —
- Monthly cashflow
- —
- DSCR
- —
- Eligible?
- —
Personal DTI + credit; lowest rate.
DSCR
20% down · 8.5% · 30yr
- Down + closing
- —
- Monthly P&I
- —
- Monthly cashflow
- —
- DSCR
- —
- Eligible?
- —
No personal income docs; deal must DSCR.
Hard money
10% down · 12.0% · 12mo
- Down + closing
- —
- Monthly P&I
- —
- Monthly cashflow
- —
- DSCR
- —
- Eligible?
- —
Short-term bridge; refi at stabilization.
Listing history 17 events
-
2026-06-18days on market $679,000 Active 102 DOM
-
2026-06-17days on market $679,000 Active 101 DOM
-
2026-06-16days on market $679,000 Active 100 DOM
-
2026-06-15days on market $679,000 Active 99 DOM
-
2026-06-14days on market $679,000 Active 97 DOM
-
2026-06-10days on market $679,000 Active 94 DOM
-
2026-06-09days on market $679,000 Active 93 DOM
-
2026-06-08days on market $679,000 Active 92 DOM
-
2026-06-07days on market $679,000 Active 91 DOM
-
2026-06-05days on market $679,000 Active 88 DOM
-
2026-06-03days on market $679,000 Active 87 DOM
-
2026-06-02days on market $679,000 Active 86 DOM
-
2026-06-01days on market $679,000 Active 85 DOM
-
2026-05-31days on market $679,000 Active 84 DOM
-
2026-05-31days on market $679,000 Active 83 DOM
-
2026-04-22price $679,000
-
2026-03-08$699,000 Active
ⓘ Source: listings_history table (triggers on properties + properties_extension) + one-shot
backfill from property_details.listing_events for pre-trigger history.
Climate risk First Street
- Flood 1/10 Low FEMA zone X (unshaded) · 0% chance over 30 yrs
- Wildfire 4/10 Moderate
- Heat 4/10 Moderate 6 d/yr ≥93°F today · 15 d/yr by 30 yrs out
- Wind 1/10 Low
- Air quality 4/10 Moderate 4 unhealthy d/yr today · 5 by 30 yrs out
Nearby sold comps map
Loading sold comps map…
Walkable amenities ~0.75 mi
Loading nearby amenities…
Taxation est. · year 1
- Rental income
- $95,496
- − Mortgage interest
- −$38,035
- − Property taxes
- −$10,185
- − Insurance
- −$3,395
- − Repairs & maintenance
- −$7,640
- − Management
- −$7,640
- − Depreciation
- −$19,753
- Taxable income
- $8,849
- Est. tax owed @ 24.0%
- −$2,124
- After-tax cash flow
- $17,009/yr
For passive investors: Depreciation is non-cash, so a rental often shows a tax loss while cash-flowing — sheltering income. Rental losses are passive: they offset passive income freely, and up to $25,000/yr can offset ordinary (W-2) income if you actively participate and your MAGI is under $100k (phasing out to $0 by $150k); unused losses carry forward. On sale, claimed depreciation is recaptured at up to 25%, and gains may owe capital-gains tax (a 1031 exchange can defer both). Figures are a year-1 estimate at your 24.0% rate — not tax advice; consult a CPA.
Condition & rehab AI · 10 photos
The property is a fourplex with average condition, requiring moderate repairs and maintenance. Upgrading the interior and exterior can significantly increase its resale and rental value.
Repairs flagged
- Minor Kitchen cabinets — The cabinets are wooden and show some wear.
- Minor Bathroom fixtures — The fixtures in the bathrooms appear to be in good condition.
- Minor Exterior paint — The exterior paint appears to be in good condition.
Value-add opportunities
- Resale Paint interior walls — Fresh paint can make the interior look more modern and appealing to potential buyers.
- Resale Replace kitchen cabinets — New cabinets can significantly improve the kitchen's appearance and functionality.
- Resale Upgrade bathroom fixtures — Modern fixtures can enhance the bathroom's appeal and functionality.
- Both Landscaping and curb appeal — A well-maintained yard and curb appeal can attract more potential buyers and renters.
Renovation cost estimate screening
| Repair item | Severity | Est. cost |
|---|---|---|
| Kitchen cabinets · The cabinets are wooden and show some wear. | Minor | $500–3,000 |
| Bathroom fixtures · The fixtures in the bathrooms appear to be in good condition. | Minor | $500–3,000 |
| Exterior paint · The exterior paint appears to be in good condition. | Minor | $500–3,000 |
| Total estimated repair cost · 3 items | $1,500–9,000 |
Value-add ROI direction
- Resale Paint interior walls — Fresh paint can make the interior look more modern and appealing to potential buyers. ↑
- Resale Replace kitchen cabinets — New cabinets can significantly improve the kitchen's appearance and functionality. ↑
- Resale Upgrade bathroom fixtures — Modern fixtures can enhance the bathroom's appeal and functionality. ↑
- Both Landscaping and curb appeal — A well-maintained yard and curb appeal can attract more potential buyers and renters. ↑
ⓘ Cost ranges are severity-bucket heuristics (US national rule-of-thumb). Get contractor quotes + a written scope before underwriting a rehab budget.
Schools (NCES district)
- District
- Weber District
- NCES district ID
- 4901200
- Math proficiency
- 36% ▼ -4.00%
- Reading proficiency
- 35% ▼ -5.00%
- Median HH income
- $65,750
- Composite
- 32.28/100
- National rank
- #5757
- State rank
- #56 of 80 in UT
Livability — Roy
- Score
- 81/100
- State rank
- #32
- US rank
- #1449
Category grades
Schools grade is shown separately in the Schools card above.
Census & demographics
- Census place
- Roy, UT
- County
- Weber County · 260,557 people
- City population
- 38,794
- Metro
- Ogden-Clearfield, UT
- Population (ZIP)
- 38,794
- Household income
- $91,115
- Rent vs Own
- Severe rent burden
- 216.0
Population outlook (Weber County) Hauer SSP2
- Today (2025)
- 274,329 people
- By 2030
- 288,577 · +5.2%
- By 2040
- 314,848 · +14.8%
- By 2050
- 338,710 · +23.5%
- By 2075
- 384,412 · +40.1%
- By 2100
- 409,305 · +49.2%
Race, ethnicity, and origin ACS 2023
- Neighborhood character
- Predominantly White (73%)
- Race & ethnicity
- White 73% Hispanic / Latino 19% Two or more races 8% Asian 2%
- Hispanic origin (detail)
- Mexican 14%
- Common ancestry
- Slovak 4% Italian 4% Portuguese 3%
- Foreign-born
- 6% · Canada
- Languages at home
- 86% English-only · Spanish 11% Other Asian/Pacific 1% Tagalog/Filipino 1%
Political lean MEDSL · Weber
- 2024 margin
- Strong R (+23.5) · D 36.8% · R 60.3% · Other 2.9%
- 2008→2024 swing
- +4.1pp toward D · 2008: -27.6pp · 2024: -23.5pp
- All cycles
- 2024: R+23.5 2020: R+22.7 2016: R+20.0 2012: R+46.0 2008: R+27.6
Not yet ingested
- Civics
- —
Market trends
- HPI YoY
- ▼ -284.84%
- Current HPI
- 323.642
- Rent YoY
- ▼ -0.45%
- Metro
- Ogden-Clearfield, UT
- State GDP YoY
- ▲ 3.54%
- F500 in state
- 2
Industry mix (Fortune 500 HQ in UT)
| Industry | F500 HQs | Revenue |
|---|---|---|
| Financial Services | 1 | $3B |
|
||
Price history
-2.9% since first listed2 events — show timeline
- 2026-04-22 Price Changed $679,000 WFRMLS
- 2026-03-08 Listed $699,000 WFRMLS
Cash-flow waterfall
monthlySold comps — $/sqft
last 12 mo · ≤1 miLoading sold comps…