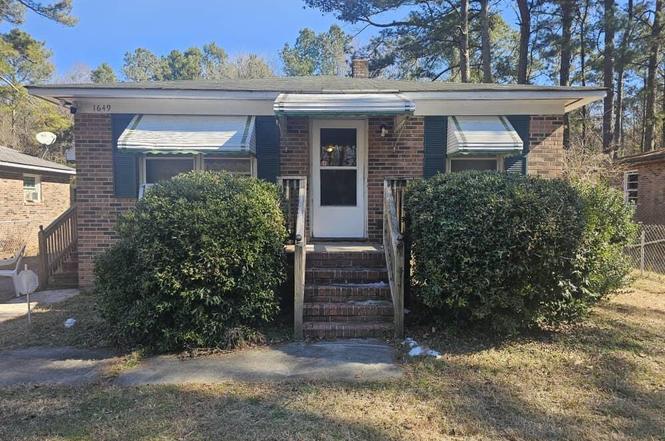
1649 Harper St · Rocky Mount, NC
Flood risk 1/10 · Minimal
- FEMA flood zone
- X (unshaded)
- Chance of flooding over 30 yrs
- 0.0%
- Est. flood insurance / yr
- $507 – $1,088
Fire risk 4/10 · Minor
- Est. fire insurance / yr
- $906 – $1,684
Heat risk 7/10 · Major
- Hot days now (above 109°F)
- 7 days/yr
- Hot days in 30 yrs
- 16 days/yr
Wind risk 6/10 · Moderate
- Chance of severe wind over 30 yrs
- 63.0%
Air-quality risk 2/10 · Minimal
- Unhealthy air days now
- 0 days/yr
- Unhealthy air days in 30 yrs
- 1 days/yr
Risk factors via First Street. Map © Google.
Why this score? — see what drove the C+ grade
The composite is a weighted blend of 9 inputs, each scored 0–100. Each bar is that input's sub-score; the figure is the points it added to the 100-point composite (weight × sub-score).
- Cash flow +30.0/30.0
- DSCR +10.0/10.0
- 1% rule +7.8/10.0
- ARV discount +5.2/15.0
- Livability +3.5/5.0
- Rent growth +2.5/5.0
- Condition / age +2.5/5.0
- Schools +2.0/10.0
- Appreciation +0.0/10.0
$110,000
🖨 Deal sheet 📄 Offer letter ✓ Due diligence
Listing remarks
Welcome to 1649 Harper Street, a beautifully maintained home offering comfort, style, and convenience in one of Rocky Mount's established neighborhoods. This residence features an inviting floor plan with abundant natural light, well-designed living spaces, and thoughtful updates throughout. Enjoy a spacious kitchen ideal for everyday living, comfortable bedrooms, and a relaxing outdoor area perfect for entertaining or quiet evenings at home. Conveniently located near shopping, dining, and major thoroughfares, this property provides both ease of access and a peaceful residential setting. This move-in-ready home is a must-see for buyers seeking quality and value in Rocky Mount.
Key facts
- 4,399 sq ft lot
- Built 1970
- Listed 154 days
Property features AI
Finance
- Other: Zoning: R6; Lot dimensions approximately 133 x 50; Lot approximately 0.1 acre
- HOA & community: No association
Exterior
- Parking: Driveway with on-site, off-street parking; Asphalt and concrete surfaces; Open/outside parking
- Utilities: Public water; Public sewer; Electricity available; Water connected
- Home design: Site-built house; One story; Central living area accessibility
- Construction: Brick construction; Asphalt shingle roof; Pillar/post/pier foundation; Built as a house (no common walls)
- Exterior features: Front porch; Side porch; Fenced yard; Chain link fencing; Partially wooded yard; City street frontage (publicly maintained, asphalt/paved road)
Interior
- Kitchen: Electric cooktop; Electric oven; Electric range; Range hood; Microwave; Oven; Refrigerator; Exhaust fan; Laminate counters
- Bedrooms: 3 bedrooms (all on the main level)
- Flooring: Hardwood; Vinyl; Wood
- Bathrooms: 1 full bathroom
- Heating & cooling: Central heating (electric, forced air, heat pump); Wall/window cooling units
- Interior features: Bathtub/shower combination; Ceiling fan(s); Dining L; Kitchen/dining room combination; Laminate countertops; Primary bedroom downstairs; Storage; Double pane windows; Window screens; Window coverings
- Laundry & utility: Washer and dryer included; Laundry inside (in kitchen, lower level)
Neighborhood map
What this means for you Summary
Snapshot
- This is a 3-bed/1.0-bath single-family listed at $110k.
Deal economics
- At list price, monthly cash flow is $439 ($5k/yr) — positive.
- The deal already cash-flows at list — no discount required.
- Meets the 1% rule at list price ($1k rent vs $110k).
- Recommended offer: $97k (12.0% below list) — sets the bar for market timing.
- Cap rate 11.1% vs local median 4.5% in Rocky Mount — top-decile yield for the area; either an underpriced asset or a hidden risk that comps aren't pricing in. Stress-test before assuming the spread holds.
Location & tenants
- Location reads 70/100 on livability (#134 in NC) — a middle-class / working-renter tenant base. Strengths: cost of living A+, housing A+, health & safety A+; Watch: schools F, crime F, amenities F.
- Edgecombe County Public Schools (rural): math 21% / reading 27% proficiency, ranked #163 of 178 in NC (top 92%) — low school quality limits family demand, transient renter base, plan for 1-2y turnover; 74% free/reduced lunch — lower-income household profile, screen leases tightly.
- Market conditions: 133 active listings in the ZIP; lower-income renter base — watch delinquency; 50 units permitted in Edgecombe County in 2024 (5 in 5+ unit buildings).
- This rent runs 38% of the median local income ($45k/yr) — at the standard rent-burdened threshold; future hikes will face affordability resistance.
Forward outlook
- Local home prices are declining (-3.0%/yr); year-one equity from $761 of loan paydown is wiped out by about $3k of value loss. Plan a longer hold.
- Edgecombe County population projected at -34% by 2050 — secular population decline; favor cash flow + early exit over multi-decade hold.
- At projected returns (-3.0% appreciation + 3.0% rent growth), your $31k cash investment doubles in ~8 years — after that, you're playing with house money.
Negotiation context
- It's been on market 154 days — a 12% lower offer ($97k) is reasonable based on typical stale-listing flexibility.
- 2 sale attempts; this cycle's ask has dropped $10k (8%) from the opening price — seller is motivated, your offer sets the floor, not the list.
Risks & watch-outs
- Climate carrying-cost: major wind risk, 63% chance of damaging wind over 30y; extreme-heat days projected 7→16/yr by 2055 (HVAC capex compounding) — expect insurance premiums to compound above CPI over the hold.
Questions for the listing agent
- It's been on market 154 days. Have you received any prior offers? Is the seller open to a 12% concession, seller financing, or rate buy-down credit?
- Built in 1970 — when were the roof, HVAC, electrical panel, plumbing, and water heater last replaced?
- Why hasn't it sold? Are there any deal-killer items the seller is aware of (foundation, flood, title, zoning, code violations)?
- Is there a deadline driving the sale (1031 exchange, divorce, estate, relocation)? That informs how much negotiation room exists.
- Schools are F-rated, which usually means shorter tenancies and higher turnover. Who's the typical renter profile here, and what's been the actual vacancy rate?
- Crime grade is F in this area — have there been break-ins, vandalism, or insurance claims at this property in the last 3 years? What carrier currently insures it and at what premium?
- What's the average days-on-market for RENTAL listings here right now (not sales)? A rising rental-DOM trend means longer vacancies and softer asking-rent achievability than the comps imply.
- What's the recent tenant-quality profile in this submarket — average credit score on applications, eviction rate, late-payment / NSF rate, and stable-employment percentage? A property-management company in the area should have these aggregated.
- How much new for-sale + rental construction is in the pipeline within 1–3 miles? Heavy new supply typically softens prices + rents 12–24 months out; constrained supply supports both.
Investment metrics
- 1% rule
- 1.28% ✓
- Cap rate
- 11.08%
- Cash-on-cash
- 17.11%
- DSCR
- 1.76
- GRM
- 6.5
CMA / ARV
- ARV (on-the-fly)
- $104,760
- Comps found
- 12
Show comp detail 12 sales within ~0.75 mi
| Address | Dist | Beds/Ba | Sqft | Sold | Price | $/sf | Match |
|---|---|---|---|---|---|---|---|
| 1558 Harper St | 0.12mi | 3/1.0 | 1,080 (0%) | 11mo | $95,000 | $88 | 85 |
| 817 Corbett Dr | 0.66mi | 3/1.0 | 1,075 (-0%) | 2mo | $90,000 | $84 | 67 |
| 129 Lucas Cir | 0.36mi | 3/1.5 | 1,050 (-3%) | 13mo | $101,500 | $97 | 65 |
| 1624 Fountain St | 0.28mi | 2/1.0 (-1) | 1,040 (-4%) | 20mo | $75,000 | $72 | 59 |
| 1721 Fountain St | 0.29mi | 3/1.0 | 1,209 (+12%) | 13mo | $143,000 | $118 | 56 |
| 1709 Whitfield Ave | 0.46mi | 3/1.5 | 1,178 (+9%) | 11mo | $115,000 | $98 | 52 |
| 1312 Beckman St | 0.39mi | 3/1.5 | 1,020 (-6%) | 23mo | $133,500 | $131 | 52 |
| 1004 Leggett Rd | 0.60mi | 3/2.0 | 1,060 (-2%) | 18mo | $150,000 | $142 | 50 |
| 1604 Robert Ave | 0.48mi | 3/1.0 | 962 (-11%) | 12mo | $149,900 | $156 | 50 |
| 1548 Fountain St | 0.35mi | 2/1.5 (-1) | 936 (-13%) | 9mo | $33,792 | $36 | 47 |
| 908 Shepard Dr | 0.68mi | 3/1.0 | 1,160 (+7%) | 20mo | $103,000 | $89 | 39 |
| 1548 Charter Dr | 0.44mi | 2/1.0 (-1) | 945 (-12%) | 24mo | $75,000 | $79 | 34 |
Match score weights: distance 35% · size 25% · config 20% · recency 20%. Top-matched comps best support the ARV.
Projected returns pro-forma
-3.0% appreciation · 3.0% rent growth · sell at horizon
- IRR
- 8.4%
- Equity multiple
- 1.33×
- Total profit
- $10,109
- Equity at exit
- $16,401
- IRR
- 17.6%
- Equity multiple
- 2.45×
- Total profit
- $44,688
- Equity at exit
- $9,511
Cash invested: $30,800 (down + closing). Projections, not guarantees.
Landlord ↔ Tenant lean methodology
- Overall (STATE)
- 85 Strongly Landlord-Friendly
- State North Carolina
- 85 Strongly Landlord-Friendly · R+3
- County
- — inherits STATE
- City
- — inherits STATE
ZIP-level market 27801
- Home prices YoY
- -5.6%
- Active inventory
- 133
- Price-to-rent
- 6.5×
Monthly cashflow live
- Estimated rent
- $1,412 medium interval (Pro) →
- Mortgage (P&I)
- −$577
- Tax from tax record
- −$53 /mo · $641/yr
- Insurance
- −$46
- HOA
- −$0
- Vacancy / Maint / Mgmt
- −$296
- Net cashflow
- $439
Break-even live
UW: 25.0% down · 7.5% · 30yr · 1.5% tax · 5.0% vac · 8.0% maint · 8.0% mgmt
Financing live
Cash to close
- Down payment
- $27,500
- Closing costs
- $3,300
- Reserves months
- —
- Total cash needed
- —
Loan-product check · same deal, 3 products live
Conventional
25% down · 7.5% · 30yr
- Down + closing
- —
- Monthly P&I
- —
- Monthly cashflow
- —
- DSCR
- —
- Eligible?
- —
Personal DTI + credit; lowest rate.
DSCR
20% down · 8.5% · 30yr
- Down + closing
- —
- Monthly P&I
- —
- Monthly cashflow
- —
- DSCR
- —
- Eligible?
- —
No personal income docs; deal must DSCR.
Hard money
10% down · 12.0% · 12mo
- Down + closing
- —
- Monthly P&I
- —
- Monthly cashflow
- —
- DSCR
- —
- Eligible?
- —
Short-term bridge; refi at stabilization.
Listing history 13 events
-
2026-06-09status $110,000 Pending 154 DOM
-
2026-06-08days on market $110,000 Active 154 DOM
-
2026-06-07days on market $110,000 Active 153 DOM
-
2026-06-05days on market $110,000 Active 150 DOM
-
2026-06-02days on market $110,000 Active 148 DOM
-
2026-06-01days on market $110,000 Active 147 DOM
-
2026-05-31days on market $110,000 Active 146 DOM
-
2026-05-30days on market $110,000 Active 145 DOM
-
2026-05-02price $110,000
-
2026-04-05status Active
-
2026-03-09status Pending
-
2026-02-12price $115,000
-
2025-12-09$120,000 Active
ⓘ Source: listings_history table (triggers on properties + properties_extension) + one-shot
backfill from property_details.listing_events for pre-trigger history.
Tax reassessment forecast NC · Resets to sale price
- Current annual tax
- $641 · $53/mo
- Projected year-2 tax
- $902 · $75/mo
- Expected delta
- +$261/yr (+$22/mo · 40.8%)
ⓘ Screening estimate from a state-policy table — verify with the county assessor before closing.
Climate risk First Street
- Flood 1/10 Low FEMA zone X (unshaded) · 0% chance over 30 yrs
- Wildfire 4/10 Moderate
- Heat 7/10 Severe 7 d/yr ≥109°F today · 16 d/yr by 30 yrs out
- Wind 6/10 Major 63% chance of damaging wind over 30 yrs
- Air quality 2/10 Low 0 unhealthy d/yr today · 1 by 30 yrs out
Nearby sold comps map
Loading sold comps map…
Walkable amenities ~0.75 mi
Loading nearby amenities…
Taxation est. · year 1
- Rental income
- $16,939
- − Mortgage interest
- −$6,162
- − Property taxes
- −$641
- − Insurance
- −$550
- − Repairs & maintenance
- −$1,355
- − Management
- −$1,355
- − Depreciation
- −$3,200
- Taxable income
- $3,676
- Est. tax owed @ 24.0%
- −$882
- After-tax cash flow
- $4,387/yr
For passive investors: Depreciation is non-cash, so a rental often shows a tax loss while cash-flowing — sheltering income. Rental losses are passive: they offset passive income freely, and up to $25,000/yr can offset ordinary (W-2) income if you actively participate and your MAGI is under $100k (phasing out to $0 by $150k); unused losses carry forward. On sale, claimed depreciation is recaptured at up to 25%, and gains may owe capital-gains tax (a 1031 exchange can defer both). Figures are a year-1 estimate at your 24.0% rate — not tax advice; consult a CPA.
Schools (NCES district)
- District
- Edgecombe County Public Schools
- NCES district ID
- 3701320
- Math proficiency
- 21% ▼ -2.00%
- Reading proficiency
- 27% ▲ 2.00%
- Median HH income
- $35,711
- Composite
- 19.85/100
- National rank
- #8696
- State rank
- #163 of 178 in NC
Livability — Rocky Mount
- Score
- 70/100
- State rank
- #134
- US rank
- #7692
Category grades
Schools grade is shown separately in the Schools card above.
Census & demographics
- Census place
- Rocky Mount, NC
- County
- Edgecombe County · 37,913 people
- City population
- 70,300
- Metro
- Rocky Mount, NC
- Population (ZIP)
- 19,532
- Household income
- $44,884
- Rent vs Own
- Severe rent burden
- 900.0
Population outlook (Edgecombe County) Hauer SSP2
- Today (2025)
- 47,800 people
- By 2030
- 44,396 · -7.1%
- By 2040
- 37,562 · -21.4%
- By 2050
- 31,495 · -34.1%
- By 2075
- 20,943 · -56.2%
- By 2100
- 13,674 · -71.4%
Race, ethnicity, and origin ACS 2023
- Neighborhood character
- Predominantly Black (70%)
- Race & ethnicity
- Black 70% White 24% Two or more races 3% Hispanic / Latino 1%
- Common ancestry
- Romanian 1%
- Foreign-born
- 1% · Canada
- Languages at home
- 97% English-only · Spanish 2%
Political lean MEDSL · Edgecombe
- 2024 margin
- Strong D (+22.7) · D 61.0% · R 38.3%
- 2008→2024 swing
- -11.8pp toward R · 2008: 34.5pp · 2024: 22.7pp
- All cycles
- 2024: D+22.7 2020: D+27.0 2016: D+32.2 2012: D+36.4 2008: D+34.5
Not yet ingested
- Civics
- —
Market trends
- HPI YoY
- ▼ -17.65%
- Current HPI
- 296.3428
- Rent YoY
- —
- Metro
- Rocky Mount, NC
- State GDP YoY
- ▲ 3.28%
- F500 in state
- 26
Industry mix (Fortune 500 HQ in NC)
| Industry | F500 HQs | Revenue |
|---|---|---|
| Financial Services | 2 | $213B |
|
||
| Retail | 2 | $95B |
|
||
| Industrial Conglomerate | 1 | $38B |
|
||
| Metals / Steel | 1 | $35B |
|
||
| Utilities | 1 | $30B |
|
||
| Industrial Machinery | 1 | $19B |
|
||
Price history
-8.3% since first listed5 events — show timeline
- 2026-05-02 Price Changed $110,000 TMLS
- 2026-04-05 Relisted — TMLS
- 2026-03-09 Pending — TMLS
- 2026-02-12 Price Changed $115,000 TMLS
- 2025-12-09 Listed $120,000 TMLS
Property tax history
+2.0%/yrLatest (2025): $641 · +0.0% YoY. Source: county tax records.
Cash-flow waterfall
monthlySold comps — $/sqft
last 12 mo · ≤1 miLoading sold comps…