26 Ponderosa Rd · Salt Flat, TX
Flood risk No data
- FEMA flood zone
- —
- Chance of flooding over 30 yrs
- —
- Est. flood insurance / yr
- —
Fire risk No data
- Est. fire insurance / yr
- —
Heat risk No data
- Hot days now (above threshold)
- —
- Hot days in 30 yrs
- —
Wind risk No data
- Chance of severe wind over 30 yrs
- —
Air-quality risk No data
- Unhealthy air days now
- —
- Unhealthy air days in 30 yrs
- —
Risk factors via First Street. Map © Google.
Why this score? — see what drove the C- grade
The composite is a weighted blend of 9 inputs, each scored 0–100. Each bar is that input's sub-score; the figure is the points it added to the 100-point composite (weight × sub-score).
- Cash flow +20.1/30.0
- ARV discount +7.5/15.0
- DSCR +6.4/10.0
- 1% rule +5.3/10.0
- Appreciation +5.0/10.0
- Rent growth +2.5/5.0
- Livability +2.5/5.0
- Condition / age +2.5/5.0
- Schools +1.8/10.0
$80,000
🖨 Deal sheet 📄 Offer letter ✓ Due diligence
Listing remarks
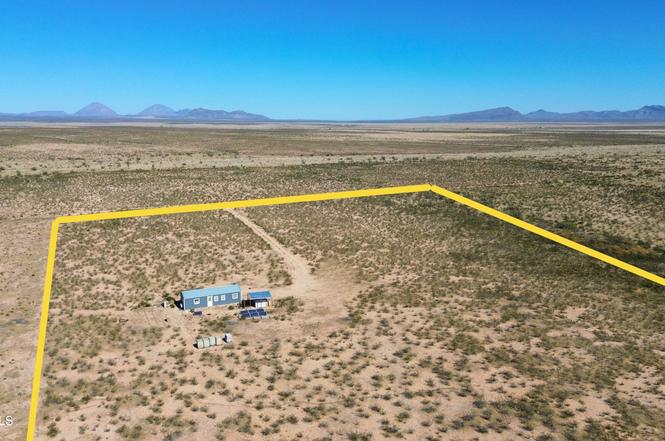
Welcome to this serene desert getaway - this home is set on 20 acres and was built with extreme care & attention to details. All you need to live off the grid away from the hustle & bustle - Solar panels with wifi controlled battery & inverter, Propane gas, Water Tanks & more. Home has metal roof. A mini split heats and cools the space efficiently. 1 bedroom & 3/4 bathroom plus a spacious & open dining/living room and kitchen. It's a quick 2 mile drive to Highway 62/180 & close to Cornudas Cafe - It's only a 1 hour from El Paso. Cell service also works in this area! No zoning or restrictions - enjoy the freedom in West Texas on this beautiful proper
Key facts
- Metal roof
- Water tanks
- No zoning
Tags
Property features AI
Finance
- Other: Special listing conditions: see remarks
- HOA & community: No HOA fees
Exterior
- Utilities: Sewer: see remarks; Lot size approximately 20.0 acres
- Home design: Modular home
- Construction: Metal roof; Construction materials: see remarks; Building area approximately 640 total
- Exterior features: Exterior details: see remarks; Covered patio/porch
Interior
- Flooring: Tile
- Bathrooms: One 3/4 bathroom
- Heating & cooling: Central air; Heating: see remarks
- Interior features: Tile flooring; Fixed windows; Appliances: see remarks
Neighborhood map
What this means for you Summary
Snapshot
- This is a 1-bed/1.0-bath manufactured listed at $80k.
Deal economics
- At list price, monthly cash flow is $100 ($1k/yr) — positive.
- The deal already cash-flows at list — no discount required.
- Meets the 1% rule at list price ($826 rent vs $80k).
- Recommended offer: $70k (12.0% below list) — sets the bar for market timing.
Location & tenants
- Location reads: area grade C — affects rentability + tenant quality, not the cash-flow math above.
- Ft Hancock ISD (rural): math 16% / reading 31% proficiency, ranked #764 of 826 in TX (top 92%) — low school quality limits family demand, transient renter base, plan for 1-2y turnover; 87% free/reduced lunch — lower-income household profile, screen leases tightly.
- Market conditions: 10 active listings in the ZIP.
Forward outlook
- In year one you build about $3k of equity ($553 loan paydown + $2k appreciation (3.0% local appreciation)).
- Hudspeth County population projected at -11% by 2050 — secular population decline; favor cash flow + early exit over multi-decade hold.
- At projected returns (3.0% appreciation + 3.0% rent growth), your $22k cash investment doubles in ~5 years — after that, you're playing with house money.
Negotiation context
- It's been on market 214 days — a 12% lower offer ($70k) is reasonable based on typical stale-listing flexibility.
Questions for the listing agent
- It's been on market 214 days. Have you received any prior offers? Is the seller open to a 12% concession, seller financing, or rate buy-down credit?
- Why hasn't it sold? Are there any deal-killer items the seller is aware of (foundation, flood, title, zoning, code violations)?
- Is there a deadline driving the sale (1031 exchange, divorce, estate, relocation)? That informs how much negotiation room exists.
- What's the average days-on-market for RENTAL listings here right now (not sales)? A rising rental-DOM trend means longer vacancies and softer asking-rent achievability than the comps imply.
- What's the recent tenant-quality profile in this submarket — average credit score on applications, eviction rate, late-payment / NSF rate, and stable-employment percentage? A property-management company in the area should have these aggregated.
- How much new for-sale + rental construction is in the pipeline within 1–3 miles? Heavy new supply typically softens prices + rents 12–24 months out; constrained supply supports both.
Investment metrics
- 1% rule
- 1.03% ✓
- Cap rate
- 7.79%
- Cash-on-cash
- 5.35%
- DSCR
- 1.24
- GRM
- 8.1
CMA / ARV
No comps found within radius.
Projected returns pro-forma
3.0% appreciation · 3.0% rent growth · sell at horizon
- IRR
- 12.5%
- Equity multiple
- 1.71×
- Total profit
- $16,006
- Equity at exit
- $35,971
- IRR
- 14.5%
- Equity multiple
- 3.15×
- Total profit
- $48,102
- Equity at exit
- $55,436
Cash invested: $22,400 (down + closing). Projections, not guarantees.
Landlord ↔ Tenant lean methodology
- Overall (STATE)
- 87 Strongly Landlord-Friendly
- State Texas
- 87 Strongly Landlord-Friendly · R+5
- County
- — inherits STATE
- City
- — inherits STATE
ZIP-level market 79847
- Active inventory
- 10
- Price-to-rent
- 8.1×
Monthly cashflow live
- Estimated rent
- $826 medium interval (Pro) →
- Mortgage (P&I)
- −$420
- Tax est. 1.5%
- −$100 /mo · $1,200/yr
- Insurance
- −$33
- HOA
- −$0
- Vacancy / Maint / Mgmt
- −$173
- Net cashflow
- $100
Break-even live
UW: 25.0% down · 7.5% · 30yr · 1.5% tax · 5.0% vac · 8.0% maint · 8.0% mgmt
Financing live
Cash to close
- Down payment
- $20,000
- Closing costs
- $2,400
- Reserves months
- —
- Total cash needed
- —
Loan-product check · same deal, 3 products live
Conventional
25% down · 7.5% · 30yr
- Down + closing
- —
- Monthly P&I
- —
- Monthly cashflow
- —
- DSCR
- —
- Eligible?
- —
Personal DTI + credit; lowest rate.
DSCR
20% down · 8.5% · 30yr
- Down + closing
- —
- Monthly P&I
- —
- Monthly cashflow
- —
- DSCR
- —
- Eligible?
- —
No personal income docs; deal must DSCR.
Hard money
10% down · 12.0% · 12mo
- Down + closing
- —
- Monthly P&I
- —
- Monthly cashflow
- —
- DSCR
- —
- Eligible?
- —
Short-term bridge; refi at stabilization.
Listing history 17 events
-
2026-06-18days on market $80,000 Active 214 DOM
-
2026-06-17days on market $80,000 Active 213 DOM
-
2026-06-16days on market $80,000 Active 212 DOM
-
2026-06-15days on market $80,000 Active 211 DOM
-
2026-06-13days on market $80,000 Active 209 DOM
-
2026-06-13days on market $80,000 Active 208 DOM
-
2026-06-10days on market $80,000 Active 206 DOM
-
2026-06-09days on market $80,000 Active 205 DOM
-
2026-06-08days on market $80,000 Active 204 DOM
-
2026-06-07days on market $80,000 Active 203 DOM
-
2026-06-03days on market $80,000 Active 199 DOM
-
2026-06-03days on market $80,000 Active 198 DOM
-
2026-06-01days on market $80,000 Active 197 DOM
-
2026-05-31days on market $80,000 Active 196 DOM
-
2026-04-29price $80,000
-
2026-01-30price $88,000
-
2025-11-15$90,000 Active
ⓘ Source: listings_history table (triggers on properties + properties_extension) + one-shot
backfill from property_details.listing_events for pre-trigger history.
Nearby sold comps map
Loading sold comps map…
Walkable amenities ~0.75 mi
Loading nearby amenities…
Taxation est. · year 1
- Rental income
- $9,914
- − Mortgage interest
- −$4,481
- − Property taxes
- −$1,200
- − Insurance
- −$400
- − Repairs & maintenance
- −$793
- − Management
- −$793
- − Depreciation
- −$2,327
- Taxable loss
- −$81
- Est. tax savings @ 24.0%
- +$19
- After-tax cash flow
- $1,217/yr
For passive investors: Depreciation is non-cash, so a rental often shows a tax loss while cash-flowing — sheltering income. Rental losses are passive: they offset passive income freely, and up to $25,000/yr can offset ordinary (W-2) income if you actively participate and your MAGI is under $100k (phasing out to $0 by $150k); unused losses carry forward. On sale, claimed depreciation is recaptured at up to 25%, and gains may owe capital-gains tax (a 1031 exchange can defer both). Figures are a year-1 estimate at your 24.0% rate — not tax advice; consult a CPA.
Schools (NCES district)
- District
- Ft Hancock ISD
- NCES district ID
- 4820130
- Math proficiency
- 16% ▼ -20.00%
- Reading proficiency
- 31% ▼ -8.00%
- Median HH income
- $25,664
- Composite
- 18.43/100
- National rank
- #8932
- State rank
- #764 of 826 in TX
Livability — Salt Flat
No livability data for this city. (Only ~50 U.S. cities are tracked.)
Census & demographics
- Population (ZIP)
- 181
Population outlook (Hudspeth County) Hauer SSP2
- Today (2025)
- 3,511 people
- By 2030
- 3,497 · -0.4%
- By 2040
- 3,383 · -3.6%
- By 2050
- 3,133 · -10.8%
- By 2075
- 2,561 · -27.1%
- By 2100
- 1,903 · -45.8%
Race, ethnicity, and origin ACS 2023
- Neighborhood character
- Predominantly White (74%)
- Race & ethnicity
- White 74% Two or more races 26% Hispanic / Latino 14%
- Hispanic origin (detail)
- Mexican 2%
- Common ancestry
- German 2% Serbian 1%
- Foreign-born
- 9% · Canada
- Languages at home
- 65% English-only · Spanish 22% German/W. Germanic 13%
Political lean MEDSL · Hudspeth
- 2024 margin
- Solid R (+46.6) · D 26.5% · R 73.1%
- 2008→2024 swing
- -43.5pp toward R · 2008: -3.1pp · 2024: -46.6pp
- All cycles
- 2024: R+46.6 2020: R+35.0 2016: R+20.6 2012: R+10.7 2008: R+3.1
Not yet ingested
- Civics
- —
Market trends
- HPI YoY
- —
- Current HPI
- —
- Rent YoY
- —
- Metro
- —
- State GDP YoY
- ▲ 3.95%
- F500 in state
- 110
Industry mix (Fortune 500 HQ in TX)
| Industry | F500 HQs | Revenue |
|---|---|---|
| Energy | 16 | $1,198B |
|
||
| Technology | 5 | $198B |
|
||
| Engineering / Construction | 4 | $72B |
|
||
| Energy Services | 3 | $60B |
|
||
| Utilities | 3 | $41B |
|
||
| Healthcare | 2 | $330B |
|
||
Price history
-11.1% since first listed3 events — show timeline
- 2026-04-29 Price Changed $80,000 GEPARMLS
- 2026-01-30 Price Changed $88,000 GEPARMLS
- 2025-11-15 Listed $90,000 GEPARMLS
Cash-flow waterfall
monthlySold comps — $/sqft
last 12 mo · ≤1 miLoading sold comps…