4101 NW 26th St #260 · Lauderhill, FL
Flood risk 1/10 · Minimal
- FEMA flood zone
- X (shaded)
- Chance of flooding over 30 yrs
- 0.0%
- Est. flood insurance / yr
- $507 – $1,088
Fire risk 1/10 · Minimal
- Est. fire insurance / yr
- $947 – $1,759
Heat risk 10/10 · Severe
- Hot days now (above 105°F)
- 7 days/yr
- Hot days in 30 yrs
- 26 days/yr
Wind risk 10/10 · Severe
- Chance of severe wind over 30 yrs
- 99.0%
Air-quality risk 3/10 · Minor
- Unhealthy air days now
- 3 days/yr
- Unhealthy air days in 30 yrs
- 3 days/yr
Risk factors via First Street. Map © Google.
Why this score? — see what drove the D- grade
The composite is a weighted blend of 9 inputs, each scored 0–100. Each bar is that input's sub-score; the figure is the points it added to the 100-point composite (weight × sub-score).
- Cash flow +7.9/30.0
- 1% rule +7.6/10.0
- ARV discount +7.5/15.0
- Schools +4.1/10.0
- Livability +4.0/5.0
- Rent growth +2.6/5.0
- Condition / age +2.5/5.0
- DSCR +1.9/10.0
- Appreciation +0.0/10.0
$120,000
🖨 Deal sheet 📄 Offer letter ✓ Due diligence
Listing remarks
Investor Alert, Discover this charming 1 Bd 1 Ba unit. already rented with reliable tenants in place start earning from day 1. Marking this a perfect addition to your investment portfolio. Enjoy hassle free cash flow in a growing area. Easy access to busy roads, shopping and more. Tamarac, sunrise and Lauderhill area
Key facts
- $0 HOA
- Parking
- Built 1973
Property features AI
Finance
- Other: Pets allowed with number limit
- HOA & community: Has association; Quarterly HOA fee; Association amenities include elevator(s); HOA covers grounds maintenance, trash, and elevator
Exterior
- Parking: 1 parking space (see remarks for details)
- Utilities: Public water; Public sewer; Other utilities
- Home design: Condominium; 2-story building; North-facing
- Construction: Concrete block with stucco and pre-cast concrete construction
- Exterior features: Waterfront property; Roof: Other
Interior
- Kitchen: Electric range; Microwave; Refrigerator
- Bedrooms: 1 bedroom on the main level
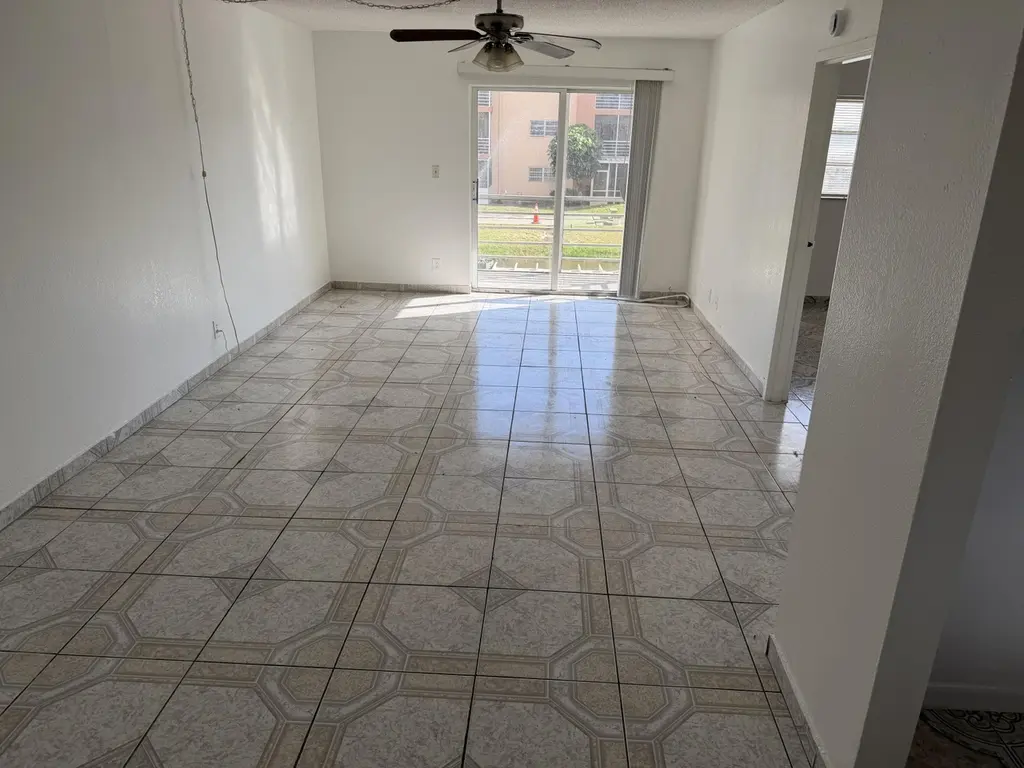
- Flooring: Ceramic tile
- Bathrooms: 1 full bathroom
- Heating & cooling: Central heating; Central air conditioning
- Interior features: Walk-in closet
Neighborhood map
What this means for you Summary
Snapshot
- This is a 1-bed/1.0-bath condo listed at $120k.
Deal economics
- At list price, monthly cash flow is $-130 ($-2k/yr) — negative.
- The deal already cash-flows at list — no discount required.
- Meets the 1% rule at list price ($2k rent vs $120k).
- Recommended offer: $113k (6.0% below list) — sets the bar for market timing.
Location & tenants
- Location reads 79/100 on livability (#139 in FL, #2,059 nationally) — a middle-class / working-renter tenant base. Strengths: commute A+, cost of living A+, housing A+; Watch: schools D, employment D, amenities F.
- Broward (suburban): math 42% / reading 53% proficiency, ranked #46 of 73 in FL (top 63%) — families likely to look elsewhere, expect single-tenant / working-renter base with shorter leases.
- Market conditions: Rents flat; 656 active listings in the ZIP; 40 comparable units currently listed for rent nearby; rentals at typical pace (median 22d on market — plan ~3-4 weeks tenant-placement turnaround); 2,111 units permitted in Broward County in 2024 (1,265 in 5+ unit buildings).
- This rent runs 39% of the median local income ($46k/yr) — at the standard rent-burdened threshold; future hikes will face affordability resistance.
Forward outlook
- Local home prices are declining (-3.0%/yr); year-one equity from $830 of loan paydown is wiped out by about $4k of value loss. Plan a longer hold.
- Broward County population projected at +34% by 2050 — long-run rental-demand tailwind backs the buy-and-hold thesis.
Negotiation context
- It's been on market 87 days — a 6% lower offer ($113k) is reasonable based on typical stale-listing flexibility.
- Current owner paid $26k; list at $120k implies a 358% gain — meaningful room to come down on a strong offer.
Risks & watch-outs
- Watch-outs: HOA is 30% of rent.
- Climate carrying-cost: severe wind risk, 99% chance of damaging wind over 30y; extreme-heat days projected 7→26/yr by 2055 (HVAC capex compounding) — expect insurance premiums to compound above CPI over the hold.
Questions for the listing agent
- What do current leases actually rent for vs. the listed asking? Can we see a recent rent roll and the last 12 months of T-12 income?
- It's been on market 87 days. Have you received any prior offers? Is the seller open to a 6% concession, seller financing, or rate buy-down credit?
- Built in 1973 — when were the roof, HVAC, electrical panel, plumbing, and water heater last replaced?
- What does the HOA fee cover, when was the last increase, and are there any pending special assessments or reserve-fund shortfalls?
- Any open or pending special assessments — roof, HVAC, plumbing, elevator, façade? What's the per-unit balance and payoff schedule, and is the seller paying it off at close or rolling it to the buyer?
- Why hasn't it sold? Are there any deal-killer items the seller is aware of (foundation, flood, title, zoning, code violations)?
- Is there a deadline driving the sale (1031 exchange, divorce, estate, relocation)? That informs how much negotiation room exists.
- Schools are D-rated, which usually means shorter tenancies and higher turnover. Who's the typical renter profile here, and what's been the actual vacancy rate?
- The area grade is low — what's the realistic commute time and amenity access for the typical tenant pool here? Any planned neighborhood developments (good or bad) we should know about?
- What's the average days-on-market for RENTAL listings here right now (not sales)? A rising rental-DOM trend means longer vacancies and softer asking-rent achievability than the comps imply.
- What's the recent tenant-quality profile in this submarket — average credit score on applications, eviction rate, late-payment / NSF rate, and stable-employment percentage? A property-management company in the area should have these aggregated.
- How much new apartment / multifamily construction is in the pipeline within 1–3 miles? Heavy new supply (>2% of stock underway) typically softens rents 12–24 months out; light construction supports rent growth.
Investment metrics
- 1% rule
- 1.26% ✓
- Cap rate
- 4.99%
- Cash-on-cash
- -4.65%
- DSCR
- 0.79
- GRM
- 6.6
CMA / ARV
No comps found within radius.
Projected returns pro-forma
-3.0% appreciation · 0.26% rent growth · sell at horizon
- IRR
- -29.2%
- Equity multiple
- 0.06×
- Total profit
- $-31,464
- Equity at exit
- $17,892
- IRR
- -62.5%
- Equity multiple
- -0.56×
- Total profit
- $-52,483
- Equity at exit
- $10,375
Cash invested: $33,600 (down + closing). Projections, not guarantees.
Landlord ↔ Tenant lean methodology
- Overall (STATE)
- 87 Strongly Landlord-Friendly
- State Florida
- 87 Strongly Landlord-Friendly · R+3
- County
- — inherits STATE
- City
- — inherits STATE
ZIP-level market 33313
- Rents YoY
- 0.3%
- Active inventory
- 656
- Price-to-rent
- 6.6×
Monthly cashflow live
- Estimated rent
- $1,508 high interval (Pro) →
- Mortgage (P&I)
- −$629
- Tax from tax record
- −$194 /mo · $2,322/yr
- Insurance
- −$50
- HOA est. from 2 same-building comps
- −$449
- Vacancy / Maint / Mgmt
- −$317
- Net cashflow
- $-130
Break-even live
UW: 25.0% down · 7.5% · 30yr · 1.5% tax · 5.0% vac · 8.0% maint · 8.0% mgmt
Financing live
Cash to close
- Down payment
- $30,000
- Closing costs
- $3,600
- Reserves months
- —
- Total cash needed
- —
Loan-product check · same deal, 3 products live
Conventional
25% down · 7.5% · 30yr
- Down + closing
- —
- Monthly P&I
- —
- Monthly cashflow
- —
- DSCR
- —
- Eligible?
- —
Personal DTI + credit; lowest rate.
DSCR
20% down · 8.5% · 30yr
- Down + closing
- —
- Monthly P&I
- —
- Monthly cashflow
- —
- DSCR
- —
- Eligible?
- —
No personal income docs; deal must DSCR.
Hard money
10% down · 12.0% · 12mo
- Down + closing
- —
- Monthly P&I
- —
- Monthly cashflow
- —
- DSCR
- —
- Eligible?
- —
Short-term bridge; refi at stabilization.
Rent comps 40 comps
| Address | Beds | Baths | Sqft | Rent | $/sqft | DOM | Units | Dist |
|---|---|---|---|---|---|---|---|---|
| 4121 NW 26th St Unit T16 Lauderhill, FL | 1.0 | 1.5 | 750 | $1,500 | $2.00 | 24d | 1 | 0.02mi |
| 4141 NW 26th St #316 Lauderhill, FL | 1.0 | 1.0 | 624 | $1,450 | $2.32 | 24d | 1 | 0.05mi |
| 3033 NW 43rd Ave #108 Lauderdale Lakes, FL | 1.0 | 1.0 | 650 | $1,590 | $2.45 | 14d | 1 | 0.27mi |
| 3030 NW 43rd Ter Lauderdale Lakes, FL | 1.0 | 1.0 | 592 | $1,400 | $2.36 | 2d | 2 | 0.27mi |
| 3030 NW 43rd Ter #102 Lauderdale Lakes, FL | 1.0 | 1.0 | 710 | $1,450 | $2.04 | 24d | 1 | 0.28mi |
| 2070 NW 43rd Ter #6 Lauderhill, FL | 1.0 | 1.0 | 600 | $1,600 | $2.67 | 22d | 1 | 0.48mi |
| 3061 NW 47th Ter Unit 327B Lauderdale Lakes, FL | 1.0 | 1.5 | 662 | $1,600 | $2.42 | 8d | 1 | 0.52mi |
| 3061 NW 47th Ter Unit 132C Lauderdale Lakes, FL | 1.0 | 1.0 | 610 | $1,500 | $2.46 | 24d | 1 | 0.52mi |
| 3061 NW 47th Ter #327 Lauderdale Lakes, FL | 1.0 | 1.5 | 662 | $1,500 | $2.27 | 24d | 1 | 0.52mi |
| 2901 NW 47th Ter Unit 348B Lauderdale Lakes, FL | 1.0 | 1.5 | 662 | $1,350 | $2.04 | 24d | 1 | 0.53mi |
| 2901 NW 47th Ter Unit 247B Lauderdale Lakes, FL | 1.0 | 1.5 | 662 | $1,450 | $2.19 | 24d | 1 | 0.53mi |
| 4160 NW 21st St Lauderhill, FL | 1.0–2.0 | 1.0 | 810 | $1,675 | $2.07 | 24d | 3 | 0.54mi |
| 4160 NW 21st St Lauderhill, FL | 1.0–2.0 | 1.0 | 810 | $1,599 | $1.97 | 8d | 2 | 0.54mi |
| 3001 NW 48th Ave #440 Lauderdale Lakes, FL | 1.0 | 1.5 | 705 | $1,300 | $1.84 | 24d | 1 | 0.57mi |
| 3541 NW 30th Pl Lauderdale Lakes, FL | 1.0–3.0 | 1.0–2.0 | 865 | $1,739 | $2.01 | 2d | 14 | 0.65mi |
| 4851 NW 26th Ct #338 Lauderdale Lakes, FL | 1.0 | 1.0 | 705 | $1,650 | $2.34 | 17d | 1 | 0.66mi |
| 3301 NW 47th Ter #308 Lauderdale Lakes, FL | 1.0 | 2.0 | 750 | $2,200 | $2.93 | 12d | 1 | 0.71mi |
| 3161 NW 47th Ter #110 Lauderdale Lakes, FL | 1.0 | 1.5 | 721 | $1,500 | $2.08 | 5d | 1 | 0.75mi |
| 3161 NW 47th Ter #111 Lauderdale Lakes, FL | 1.0 | 1.5 | 721 | $1,500 | $2.08 | 24d | 1 | 0.75mi |
| 3141 NW 47th Ter Lauderdale Lakes, FL | 1.0–2.0 | 1.5–2.0 | 861 | $1,440 | $1.67 | 24d | 2 | 0.75mi |
| 4047 NW 16th St #109 Lauderhill, FL | 1.0 | 1.0 | 725 | $1,300 | $1.79 | 24d | 1 | 0.80mi |
| 5021 W Oakland Park Blvd Lauderdale Lakes, FL | 1.0 | 1.0 | 684 | $1,550 | $2.27 | 18d | 2 | 0.82mi |
| 2851 Somerset Dr Lauderdale Lakes, FL | 1.0–2.0 | 1.0–2.0 | 827 | $1,300 | $1.57 | 3d | 2 | 0.83mi |
| 1861 NW 46th Ave Lauderhill, FL | 2.0 | 1.0–2.0 | 730 | $1,490 | $2.04 | 2d | 13 | 0.83mi |
| 2841 Somerset Dr Lauderdale Lakes, FL | 1.0 | 1.0 | 696 | $1,598 | $2.30 | 11d | 3 | 0.84mi |
| 2871 Somerset Dr #207 Lauderdale Lakes, FL | 1.0 | 1.0 | 644 | $1,400 | $2.17 | 24d | 1 | 0.85mi |
| 5031 W Oakland Park Blvd Lauderdale Lakes, FL | 1.0 | 1.0 | 683 | $1,400 | $2.05 | 10d | 2 | 0.88mi |
| 3460 NW 50th Ave Lauderdale Lakes, FL | 1.0–2.0 | 1.0–2.0 | 750 | $1,499 | $2.00 | 17d | 3 | 0.91mi |
| 2821 Somerset Dr #217 Lauderdale Lakes, FL | 1.0 | 1.0 | 748 | $1,400 | $1.87 | 3d | 1 | 0.93mi |
| 4299 NW 16th St #103 Lauderhill, FL | 1.0 | 1.0 | 700 | $1,400 | $2.00 | 24d | 1 | 0.94mi |
| 4299 NW 16th St #103 Lauderhill, FL | 1.0 | 1.0 | 700 | $1,400 | $2.00 | 8d | 1 | 0.94mi |
| 3531 NW 50th Ave #609 Lauderdale Lakes, FL | 1.0 | 1.0 | 684 | $1,350 | $1.97 | 24d | 1 | 1.00mi |
| 1599 NW 43rd Ave #106 Lauderhill, FL | 1.0 | 1.0 | 730 | $1,499 | $2.05 | 18d | 1 | 1.02mi |
| 1621 NW 46th Ave #101 Lauderhill, FL | 1.0 | 1.0 | 576 | $1,600 | $2.78 | 24d | 1 | 1.04mi |
| 5321 NW 21st Ct Lauderhill, FL | 2.0 | 1.0 | 750 | $1,900 | $2.53 | 24d | 1 | 1.11mi |
| 1196 NW 40th Ave Lauderhill, FL | 1.0–2.0 | 1.0 | 825 | $1,540 | $1.87 | 1d | 10 | 1.24mi |
| 4310 NW 12th Ct #205 Lauderhill, FL | 1.0 | 1.0 | 730 | $1,500 | $2.05 | 17d | 1 | 1.29mi |
| 4310 NW 12th Ct #205 Lauderhill, FL | 1.0 | 1.0 | 730 | $1,500 | $2.05 | 5d | 1 | 1.29mi |
| 2800 NW 56th Ave Lauderhill, FL | 1.0–2.0 | 1.0–2.0 | 847 | $1,250 | $1.48 | 22d | 7 | 1.30mi |
| 2800 NW 56th Ave Lauderhill, FL | 1.0–2.0 | 1.0–2.0 | 847 | $1,175 | $1.39 | 24d | 8 | 1.30mi |
HOA detail condo
- Monthly dues
- $0 · $0/yr
- Assessments
- None detected in remarks — confirm with the listing agent.
Listing history 17 events
-
2026-06-18days on market $120,000 Active 87 DOM
-
2026-06-17days on market $120,000 Active 86 DOM
-
2026-06-16days on market $120,000 Active 85 DOM
-
2026-06-15days on market $120,000 Active 84 DOM
-
2026-06-13days on market $120,000 Active 82 DOM
-
2026-06-09days on market $120,000 Active 78 DOM
-
2026-06-08days on market $120,000 Active 77 DOM
-
2026-06-07days on market $120,000 Active 76 DOM
-
2026-06-04days on market $120,000 Active 73 DOM
-
2026-06-03days on market $120,000 Active 72 DOM
-
2026-06-02days on market $120,000 Active 71 DOM
-
2026-06-01days on market $120,000 Active 70 DOM
-
2026-05-31days on market $120,000 Active 69 DOM
-
2026-03-23$120,000 Active
-
2003-05-01soldstatus $26,200
-
1992-08-06soldstatus $13,000
-
1979-10-01soldstatus $28,000
ⓘ Source: listings_history table (triggers on properties + properties_extension) + one-shot
backfill from property_details.listing_events for pre-trigger history.
Tax reassessment forecast FL · Resets to sale price
- Current annual tax
- $2,322 · $194/mo
- Projected year-2 tax
- $2,322 · $194/mo
- Expected delta
- $0/yr ($0/mo · 0.0%)
ⓘ Screening estimate from a state-policy table — verify with the county assessor before closing.
Climate risk First Street
- Flood 1/10 Low FEMA zone X (shaded) · 0% chance over 30 yrs
- Wildfire 1/10 Low
- Heat 10/10 Extreme 7 d/yr ≥105°F today · 26 d/yr by 30 yrs out
- Wind 10/10 Extreme 99% chance of damaging wind over 30 yrs
- Air quality 3/10 Moderate 3 unhealthy d/yr today · 3 by 30 yrs out
Nearby sold comps map
Loading sold comps map…
Walkable amenities ~0.75 mi
Loading nearby amenities…
Taxation est. · year 1
- Rental income
- $18,099
- − Mortgage interest
- −$6,722
- − Property taxes
- −$2,322
- − Insurance
- −$600
- − Repairs & maintenance
- −$1,448
- − Management
- −$1,448
- − HOA
- −$5,388
- − Depreciation
- −$3,491
- Taxable loss
- −$3,320
- Est. tax savings @ 24.0%
- +$797
- After-tax cash flow
- $-767/yr
For passive investors: Depreciation is non-cash, so a rental often shows a tax loss while cash-flowing — sheltering income. Rental losses are passive: they offset passive income freely, and up to $25,000/yr can offset ordinary (W-2) income if you actively participate and your MAGI is under $100k (phasing out to $0 by $150k); unused losses carry forward. On sale, claimed depreciation is recaptured at up to 25%, and gains may owe capital-gains tax (a 1031 exchange can defer both). Figures are a year-1 estimate at your 24.0% rate — not tax advice; consult a CPA.
Schools (NCES district)
- District
- Broward
- NCES district ID
- 1200180
- Math proficiency
- 42% ▼ -18.00%
- Reading proficiency
- 53% ▼ -5.00%
- Median HH income
- $52,139
- Composite
- 40.88/100
- National rank
- #3621
- State rank
- #46 of 73 in FL
Livability — Lauderhill
- Score
- 79/100
- State rank
- #139
- US rank
- #2059
Category grades
Schools grade is shown separately in the Schools card above.
Census & demographics
- Census place
- Lauderhill, FL
- County
- Broward County · 1,963,430 people
- City population
- 62,807
- Metro
- Miami-Fort Lauderdale-Pompano Beach, FL
- Population (ZIP)
- 62,807
- Household income
- $46,305
- Rent vs Own
- Severe rent burden
- 5692.0
Population outlook (Broward County) Hauer SSP2
- Today (2025)
- 2,207,033 people
- By 2030
- 2,360,704 · +7.0%
- By 2040
- 2,661,208 · +20.6%
- By 2050
- 2,946,698 · +33.5%
- By 2075
- 3,602,273 · +63.2%
- By 2100
- 3,970,984 · +79.9%
Race, ethnicity, and origin ACS 2023
- Neighborhood character
- Predominantly Black (77%)
- Race & ethnicity
- Black 77% Hispanic / Latino 12% Two or more races 8% White 7% Asian 2%
- Hispanic origin (detail)
- Puerto Rican 2% Cuban 3% Dominican 1%
- Common ancestry
- Hispanic 20%
- Foreign-born
- 39% · Canada, Jamaica, Dominican Republic
- Languages at home
- 66% English-only · French/Haitian/Cajun 22% Spanish 10%
Political lean MEDSL · Broward
- 2024 margin
- D (+17.0) · D 58.0% · R 41.0%
- 2008→2024 swing
- -17.8pp toward R · 2008: 34.7pp · 2024: 17.0pp
- All cycles
- 2024: D+17.0 2020: D+29.8 2016: D+35.0 2012: D+34.9 2008: D+34.7
Not yet ingested
- Civics
- —
Market trends
- HPI YoY
- ▼ -338.15%
- Current HPI
- 288.9345
- Rent YoY
- ▲ 0.26%
- Metro
- Miami-Fort Lauderdale-Pompano Beach, FL
- State GDP YoY
- ▲ 3.28%
- F500 in state
- 36
Industry mix (Fortune 500 HQ in FL)
| Industry | F500 HQs | Revenue |
|---|---|---|
| Industrial Technology | 2 | $29B |
|
||
| Insurance | 2 | $17B |
|
||
| Retail | 1 | $60B |
|
||
| Technology Distribution | 1 | $58B |
|
||
| Homebuilding | 1 | $35B |
|
||
| Technology Manufacturing | 1 | $35B |
|
||
Price history
+328.6% since first listed4 events — show timeline
- 2026-03-23 Listed $120,000 Beaches MLS
- 2003-05-01 Sold (Public Records) $26,200 Public Records
- 1992-08-06 Sold (Public Records) $13,000 Public Records
- 1979-10-01 Sold (Public Records) $28,000 Public Records
Property tax history
+8.5%/yrLatest (2025): $2,322 · +6.0% YoY. Source: county tax records.
Cash-flow waterfall
monthlySold comps — $/sqft
last 12 mo · ≤1 miLoading sold comps…