 🏗️ New Construction
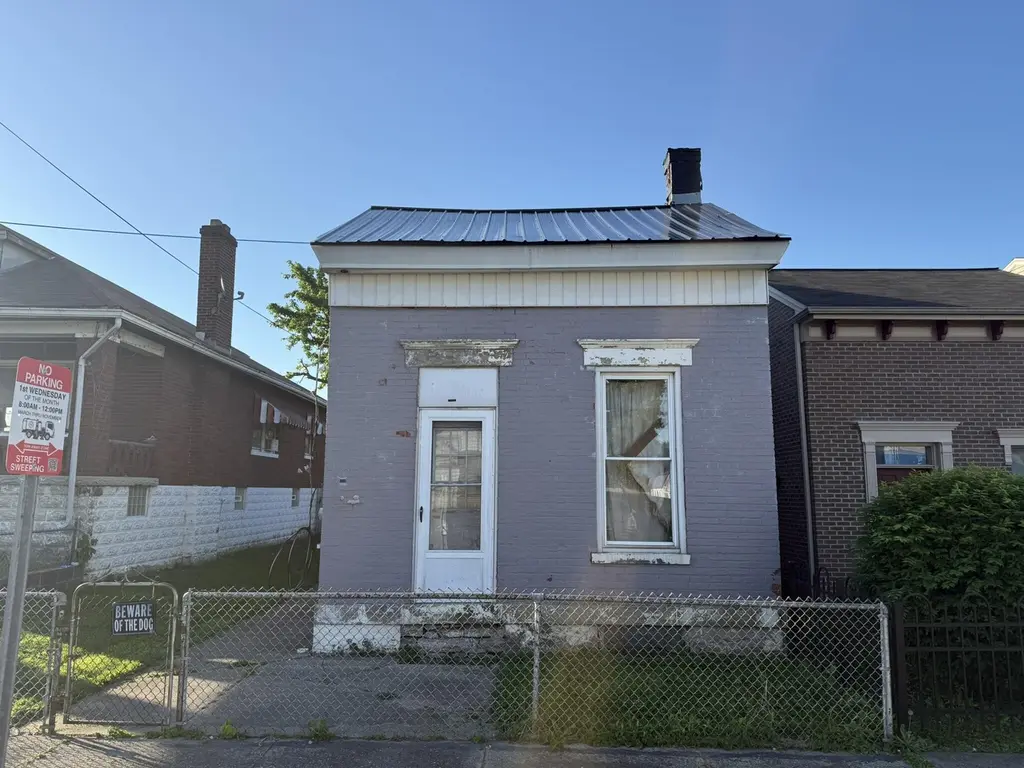
418 W 8th St · Newport, KY
Flood risk 3/10 · Minor
- FEMA flood zone
- X
- Chance of flooding over 30 yrs
- 0.2%
- Est. flood insurance / yr
- $473 – $860
Fire risk 1/10 · Minimal
- Est. fire insurance / yr
- $839 – $1,559
Heat risk 5/10 · Moderate
- Hot days now (above 103°F)
- 7 days/yr
- Hot days in 30 yrs
- 20 days/yr
Wind risk 2/10 · Minimal
- Chance of severe wind over 30 yrs
- 1.0%
Air-quality risk 3/10 · Minor
- Unhealthy air days now
- 2 days/yr
- Unhealthy air days in 30 yrs
- 3 days/yr
Risk factors via First Street. Map © Google.
Why this score? — see what drove the C grade
The composite is a weighted blend of 9 inputs, each scored 0–100. Each bar is that input's sub-score; the figure is the points it added to the 100-point composite (weight × sub-score).
- Cash flow +24.9/30.0
- DSCR +8.1/10.0
- ARV discount +7.5/15.0
- 1% rule +5.2/10.0
- Livability +4.1/5.0
- Rent growth +3.7/5.0
- Condition / age +2.5/5.0
- Schools +1.7/10.0
- Appreciation +0.0/10.0
$60,000
🖨 Deal sheet 📄 Offer letter ✓ Due diligence
Listing remarks
HISTORIC NEWPORT WITH A DRIVEWAY?! This charming brick home has already been demoed and is ready for someone's vision to come to life. Fully fenced yard, private driveway, open floor plan, brand new roof, and already plumbed for a 2 bed / 2 full bath layout. This part of Newport is expected to be redesignated as a historic district, with some amazing comparable sales nearby. The current owner simply took on too many projects at once, which creates a seriously exciting opportunity for the next buyer. Historic charm, outdoor space, private parking, and the hard demo work already done, this is ready for you! Sold ''As-Is''
Key facts
- Open floor plan
- Private driveway
- Brand new roof
Tags
Property features AI
Exterior
- Parking: Driveway; On-street parking
- Utilities: Public water; Public sewer; Natural gas available
- Home design: Single family residence; One level
- Construction: Built in 1883; Brick construction; Metal roof; Stone foundation
- Exterior features: Private yard; Chain link fencing; Vinyl frame windows; Paved road frontage on a city street
Interior
- Bedrooms: Primary Bedroom, approximately 10 x 12; Bedroom 2, approximately 12 x 12
- Bathrooms: Primary Bath, approximately 5 x 7; Bathroom 2, approximately 5 x 7
- Heating & cooling: Hot water heating; Forced air heating; Electric heating; Has heating
- Interior features: Home is a shell (buyer to verify measurements); Under construction condition
Neighborhood map
What this means for you Summary
Snapshot
- This is a 2-bed/1.0-bath single-family listed at $60k.
Deal economics
- At list price, monthly cash flow is $367 ($4k/yr) — positive.
- The deal already cash-flows at list — no discount required.
- Meets the 1% rule at list price ($2k rent vs $60k).
- Recommended offer: $59k (1.5% below list) — sets the bar for market timing.
- Cap rate 8.9% vs local median 4.9% in Newport — top-decile yield for the area; either an underpriced asset or a hidden risk that comps aren't pricing in. Stress-test before assuming the spread holds.
Location & tenants
- Location reads 82/100 on livability (#58 in KY, #1,070 nationally) — a professional / high-income tenant draw. Strengths: amenities A+, commute A+, cost of living A+; Watch: crime F, employment D-.
- Newport Independent (suburban): math 14% / reading 26% proficiency, ranked #160 of 165 in KY (top 97%) — low school quality limits family demand, transient renter base, plan for 1-2y turnover; 79% free/reduced lunch — lower-income household profile, screen leases tightly.
- Zoned schools: Newport High School (math 16% / reading 28%, grade F, #202 of 254 statewide, top 82%, 579 students, 84% FRL).
- Market conditions: Rents rising fast (+4.6%/yr); 236 active listings in the ZIP; 40 comparable units currently listed for rent nearby; rentals at typical pace (median 15d on market — plan ~3-4 weeks tenant-placement turnaround); 247 units permitted in Campbell County in 2024 (77 in 5+ unit buildings).
- This rent runs 35% of the median local income ($60k/yr) — at the standard rent-burdened threshold; future hikes will face affordability resistance.
Forward outlook
- Local home prices are declining (-3.0%/yr); year-one equity from $1k of loan paydown is wiped out by about $5k of value loss. Plan a longer hold.
- At projected returns (-3.0% appreciation + 4.6% rent growth), your $48k cash investment doubles in ~10 years — after that, you're playing with house money.
Negotiation context
- It's been on market 15 days — a 2% lower offer ($59k) is reasonable based on typical stale-listing flexibility.
Risks & watch-outs
- Watch-outs: built in 1883 — expect roof / HVAC / electrical / plumbing capex.
- Climate carrying-cost: extreme-heat days projected 7→20/yr by 2055 (HVAC capex compounding) — expect insurance premiums to compound above CPI over the hold.
Questions for the listing agent
- Built in 1883 — when were the roof, HVAC, electrical panel, plumbing, and water heater last replaced?
- Is there a deadline driving the sale (1031 exchange, divorce, estate, relocation)? That informs how much negotiation room exists.
- Schools are D-rated, which usually means shorter tenancies and higher turnover. Who's the typical renter profile here, and what's been the actual vacancy rate?
- Crime grade is F in this area — have there been break-ins, vandalism, or insurance claims at this property in the last 3 years? What carrier currently insures it and at what premium?
- What's the average days-on-market for RENTAL listings here right now (not sales)? A rising rental-DOM trend means longer vacancies and softer asking-rent achievability than the comps imply.
- What's the recent tenant-quality profile in this submarket — average credit score on applications, eviction rate, late-payment / NSF rate, and stable-employment percentage? A property-management company in the area should have these aggregated.
- How much new for-sale + rental construction is in the pipeline within 1–3 miles? Heavy new supply typically softens prices + rents 12–24 months out; constrained supply supports both.
Investment metrics
- 1% rule
- 1.02% ✓
- Cap rate
- 8.87%
- Cash-on-cash
- 9.21%
- DSCR
- 1.41
- GRM
- 8.2
CMA / ARV
- ARV (on-the-fly)
- $170,892
- Comps found
- 12
Show comp detail 12 sales within ~0.75 mi
| Address | Dist | Beds/Ba | Sqft | Sold | Price | $/sf | Match |
|---|---|---|---|---|---|---|---|
| 319 Elm St | 0.11mi | 2/1.5 | 850 (-6%) | 0mo | $160,000 | $188 | 82 |
| 729 Isabella St | 0.14mi | 2/1.0 | 980 (+8%) | 9mo | $96,000 | $98 | 73 |
| 1006 Liberty St | 0.28mi | 1/1.0 (-1) | 868 (-4%) | 3mo | $86,900 | $100 | 72 |
| 926 Putnam St | 0.37mi | 2/1.0 | 857 (-6%) | 6mo | $155,000 | $181 | 68 |
| 1130 Ann St | 0.45mi | 2/1.0 | 939 (+3%) | 10mo | $55,000 | $59 | 65 |
| 1302 John St | 0.67mi | 2/1.0 | 867 (-5%) | 0mo | $225,000 | $260 | 61 |
| 434 Lindsey St | 0.18mi | 2/1.0 | 1,044 (+15%) | 11mo | $127,900 | $123 | 58 |
| 531 Lindsey St | 0.18mi | 1/1.0 (-1) | 777 (-14%) | 6mo | $174,900 | $225 | 57 |
| 55 Biehl St | 0.65mi | 2/1.0 | 962 (+6%) | 7mo | $282,500 | $294 | 54 |
| 930 York St | 0.42mi | 2/2.0 | 1,005 (+11%) | 10mo | $250,000 | $249 | 51 |
| 311 E 13th St | 0.61mi | 2/1.0 | 825 (-9%) | 7mo | $158,500 | $192 | 50 |
| 729 Weingartner Pl | 0.69mi | 2/1.0 | 995 (+10%) | 11mo | $165,000 | $166 | 42 |
Match score weights: distance 35% · size 25% · config 20% · recency 20%. Top-matched comps best support the ARV.
Projected returns pro-forma
-3.0% appreciation · 4.64% rent growth · sell at horizon
- IRR
- -0.8%
- Equity multiple
- 0.97×
- Total profit
- $-1,463
- Equity at exit
- $25,481
- IRR
- 10.3%
- Equity multiple
- 1.86×
- Total profit
- $40,929
- Equity at exit
- $14,776
Cash invested: $47,850 (down + closing). Projections, not guarantees.
Landlord ↔ Tenant lean methodology
- Overall (STATE)
- 83 Strongly Landlord-Friendly
- State Kentucky
- 83 Strongly Landlord-Friendly · R+16
- County
- — inherits STATE
- City
- — inherits STATE
ZIP-level market 41071
- Rents YoY
- 4.6%
- Active inventory
- 236
- Price-to-rent
- 2.9×
Monthly cashflow live
- Estimated rent
- $1,744 high interval (Pro) →
- Mortgage (P&I)
- −$896
- Tax from tax record
- −$44 /mo · $522/yr
- Insurance
- −$71
- HOA
- −$0
- Vacancy / Maint / Mgmt
- −$366
- Net cashflow
- $367
Break-even live
UW: 25.0% down · 7.5% · 30yr · 1.5% tax · 5.0% vac · 8.0% maint · 8.0% mgmt
Financing live
Cash to close
- Down payment
- $42,723
- Closing costs
- $5,127
- Reserves months
- —
- Total cash needed
- —
Loan-product check · same deal, 3 products live
Conventional
25% down · 7.5% · 30yr
- Down + closing
- —
- Monthly P&I
- —
- Monthly cashflow
- —
- DSCR
- —
- Eligible?
- —
Personal DTI + credit; lowest rate.
DSCR
20% down · 8.5% · 30yr
- Down + closing
- —
- Monthly P&I
- —
- Monthly cashflow
- —
- DSCR
- —
- Eligible?
- —
No personal income docs; deal must DSCR.
Hard money
10% down · 12.0% · 12mo
- Down + closing
- —
- Monthly P&I
- —
- Monthly cashflow
- —
- DSCR
- —
- Eligible?
- —
Short-term bridge; refi at stabilization.
Rent comps 40 comps
| Address | Beds | Baths | Sqft | Rent | $/sqft | DOM | Units | Dist |
|---|---|---|---|---|---|---|---|---|
| 128 W 9th St Newport, KY | 2.0 | 1.0 | 1012 | $1,650 | $1.63 | 2d | 1 | 0.29mi |
| 210 W 5th St Newport, KY | 1.0–2.0 | 1.0–2.0 | 845 | $1,800 | $2.13 | 3d | 15 | 0.33mi |
| 521 Garrard St Apt 3 Covington, KY | 1.0 | 1.0 | 875 | $1,996 | $2.28 | 14d | 1 | 0.38mi |
| 521 Garrard St Apt 4 Covington, KY | 1.0 | 1.0 | 725 | $1,695 | $2.34 | 17d | 1 | 0.38mi |
| 521 Garrard St Apt 1 Covington, KY | 1.0 | 1.5 | 825 | $1,895 | $2.30 | 17d | 1 | 0.38mi |
| 521 Garrard St Apt 6 Covington, KY | 1.0 | 1.0 | 775 | $1,995 | $2.57 | 16d | 1 | 0.38mi |
| 521 Garrard St Apt 2 Covington, KY | 1.0 | 1.0 | 725 | $1,595 | $2.20 | 17d | 1 | 0.38mi |
| 911 Putnam St #2 Newport, KY | 2.0 | 1.0 | 1000 | $1,600 | $1.60 | 21d | 1 | 0.40mi |
| 634 Greenup St Covington, KY | 1.0 | 1.5 | 1050 | $1,595 | $1.52 | 7d | 1 | 0.42mi |
| 835 York St Unit 2 Newport, KY | 1.0 | 1.0 | 1000 | $1,295 | $1.29 | 17d | 1 | 0.43mi |
| 1114 Columbia St Unit 2 Newport, KY | 1.0 | 1.0 | 925 | $1,550 | $1.68 | 43d | 1 | 0.45mi |
| 344 E 13th St Unit 1 Covington, KY | 2.0 | 1.0 | 1000 | $1,275 | $1.27 | 23d | 1 | 0.52mi |
| 303 Greenup St Covington, KY | 1.0 | 1.0 | 678 | $1,445 | $2.13 | 23d | 1 | 0.56mi |
| 1025 Scott St Unit 2 Covington, KY | 2.0 | 2.0 | 1100 | $1,800 | $1.64 | 3d | 1 | 0.58mi |
| 415 Monmouth St Newport, KY | 1.0 | 1.0 | 775 | $1,660 | $2.14 | 2d | 5 | 0.59mi |
| 920 Washington Ave Unit 10 Newport, KY | 1.0 | 1.0 | 600 | $955 | $1.59 | 23d | 1 | 0.68mi |
| 229 E 5th St Unit 1 Newport, KY | 1.0 | 1.0 | 950 | $1,225 | $1.29 | 43d | 1 | 0.71mi |
| 100 Aqua Way Newport, KY | 1.0–3.0 | 1.0–2.0 | 1092 | $2,834 | $2.60 | 1d | 4 | 0.79mi |
| 50 W Rivercenter Blvd Covington, KY | 1.0–2.0 | 1.0–2.5 | 1273 | $3,640 | $2.86 | 1d | 9 | 0.80mi |
| 218 W 5th St Covington, KY | 1.0 | 1.0 | 800 | $1,595 | $1.99 | 14d | 1 | 0.85mi |
| 518 E 2nd St Unit 2 Newport, KY | 1.0 | 1.0 | 900 | $1,450 | $1.61 | 43d | 1 | 0.97mi |
| 121 E Freedom Way Cincinnati, OH | 2.0 | 1.0–2.0 | 988 | $2,999 | $3.03 | 1d | 27 | 1.01mi |
| 621 E Mehring Way Cincinnati, OH | 1.0–2.0 | 1.0–2.0 | 938 | $2,249 | $2.40 | 1d | 12 | 1.01mi |
| 515 Main St Covington, KY | 1.0–2.0 | 1.0–2.0 | 934 | $2,215 | $2.37 | 1d | 8 | 1.02mi |
| 1205 Lee St Unit 2 Covington, KY | 1.0 | 1.0 | 800 | $1,500 | $1.88 | 23d | 1 | 1.06mi |
| 1205 Lee St Unit 1 Covington, KY | 1.0 | 1.0 | 675 | $1,350 | $2.00 | 23d | 1 | 1.06mi |
| 601 E Pete Rose Way Cincinnati, OH | 3.0 | 1.0–2.5 | 1039 | $2,448 | $2.36 | 1d | 22 | 1.06mi |
| 309 Sycamore St #201 Cincinnati, OH | 2.0 | 2.0 | 850 | $1,600 | $1.88 | 23d | 1 | 1.11mi |
| 44 W Freedom Way Cincinnati, OH | 2.0 | 1.0–2.0 | 943 | $2,859 | $3.03 | 1d | 28 | 1.12mi |
| 1914 Eastern Ave Apt 1 Covington, KY | 2.0 | 1.0 | 750 | $1,200 | $1.60 | 23d | 1 | 1.12mi |
| 1914 Eastern Ave Apt 3 Covington, KY | 1.0 | 1.0 | 900 | $995 | $1.11 | 14d | 1 | 1.12mi |
| 309 Vine St Cincinnati, OH | 1.0–3.0 | 1.0–2.0 | 955 | $2,467 | $2.58 | 1d | 15 | 1.22mi |
| 414 Walnut St Cincinnati, OH | 1.0 | 1.0 | 752 | $2,510 | $3.34 | 1d | 23 | 1.26mi |
| 1 W 4th St Cincinnati, OH | 3.0 | 1.0–3.5 | 1675 | $6,550 | $3.91 | 3d | 96 | 1.26mi |
| 151 W 4th St Cincinnati, OH | 2.0 | 1.0 | 726 | $2,399 | $3.30 | 1d | 102 | 1.33mi |
| 512 Wallace Ave Unit 512/18 Covington, KY | 2.0 | 2.0 | 900 | $1,299 | $1.44 | 7d | 1 | 1.34mi |
| 512 Wallace Ave Unit 512/09 Covington, KY | 1.0 | 1.0 | 550 | $899 | $1.63 | 7d | 1 | 1.34mi |
| 512 Wallace Ave Unit 512/16 Covington, KY | 1.0 | 1.0 | 550 | $939 | $1.71 | 7d | 1 | 1.34mi |
| 512 Wallace Ave Unit 512/08 Covington, KY | 1.0 | 1.0 | 550 | $899 | $1.63 | 17d | 1 | 1.34mi |
| 205 W 4th St Cincinnati, OH | 2.0 | 1.0–2.0 | 648 | $2,162 | $3.33 | 1d | 44 | 1.35mi |
Listing history 9 events
-
2026-06-07statusdays on market $60,000 Pending 15 DOM
-
2026-06-05days on market $60,000 Active 14 DOM
-
2026-06-03days on market $60,000 Active 13 DOM
-
2026-06-02days on market $60,000 Active 12 DOM
-
2026-06-01days on market $60,000 Active 11 DOM
-
2026-05-31days on market $60,000 Active 10 DOM
-
2026-05-21$69,900 Active
-
2025-06-27soldstatus $60,000
-
1996-09-30soldstatus $25,000
ⓘ Source: listings_history table (triggers on properties + properties_extension) + one-shot
backfill from property_details.listing_events for pre-trigger history.
Tax reassessment forecast KY · Resets to sale price
- Current annual tax
- $522 · $44/mo
- Projected year-2 tax
- $522 · $44/mo
- Expected delta
- $0/yr ($0/mo · 0.0%)
ⓘ Screening estimate from a state-policy table — verify with the county assessor before closing.
Climate risk First Street
- Flood 3/10 Moderate FEMA zone X · 20% chance over 30 yrs
- Wildfire 1/10 Low
- Heat 5/10 Major 7 d/yr ≥103°F today · 20 d/yr by 30 yrs out
- Wind 2/10 Low 100% chance of damaging wind over 30 yrs
- Air quality 3/10 Moderate 2 unhealthy d/yr today · 3 by 30 yrs out
Nearby sold comps map
Loading sold comps map…
Walkable amenities ~0.75 mi
Loading nearby amenities…
Taxation est. · year 1
- Rental income
- $20,932
- − Mortgage interest
- −$9,573
- − Property taxes
- −$522
- − Insurance
- −$854
- − Repairs & maintenance
- −$1,675
- − Management
- −$1,675
- − Depreciation
- −$4,971
- Taxable income
- $1,662
- Est. tax owed @ 24.0%
- −$399
- After-tax cash flow
- $4,007/yr
For passive investors: Depreciation is non-cash, so a rental often shows a tax loss while cash-flowing — sheltering income. Rental losses are passive: they offset passive income freely, and up to $25,000/yr can offset ordinary (W-2) income if you actively participate and your MAGI is under $100k (phasing out to $0 by $150k); unused losses carry forward. On sale, claimed depreciation is recaptured at up to 25%, and gains may owe capital-gains tax (a 1031 exchange can defer both). Figures are a year-1 estimate at your 24.0% rate — not tax advice; consult a CPA.
Schools (NCES district)
- District
- Newport Independent
- NCES district ID
- 2104440
- Math proficiency
- 14% ▼ -11.00%
- Reading proficiency
- 26% ▼ -6.00%
- Median HH income
- $35,783
- Composite
- 16.51/100
- National rank
- #9182
- State rank
- #160 of 165 in KY
Livability — Newport
- Score
- 82/100
- State rank
- #58
- US rank
- #1070
Category grades
Schools grade is shown separately in the Schools card above.
Census & demographics
- Census place
- Newport, KY
- County
- Campbell County · 84,793 people
- City population
- 19,680
- Metro
- Cincinnati, OH-KY-IN
- Population (ZIP)
- 19,680
- Household income
- $59,976
- Rent vs Own
- Severe rent burden
- 1136.0
Population outlook (Campbell County) Hauer SSP2
- Today (2025)
- 95,668 people
- By 2030
- 96,886 · +1.3%
- By 2040
- 97,734 · +2.2%
- By 2050
- 96,413 · +0.8%
- By 2075
- 90,211 · -5.7%
- By 2100
- 79,434 · -17.0%
Race, ethnicity, and origin ACS 2023
- Neighborhood character
- Predominantly White (84%)
- Race & ethnicity
- White 84% Black 7% Two or more races 6% Hispanic / Latino 5%
- Common ancestry
- Slovak 3% Lithuanian 2% Italian 2%
- Foreign-born
- 4% · Canada
- Languages at home
- 95% English-only · Spanish 3% Other Indo-European 1%
Political lean MEDSL · Campbell
- 2024 margin
- R (+19.7) · D 39.2% · R 58.9% · Other 1.9%
- 2008→2024 swing
- +1.2pp toward D · 2008: -20.9pp · 2024: -19.7pp
- All cycles
- 2024: R+19.7 2020: R+18.6 2016: R+24.5 2012: R+22.8 2008: R+20.9
Not yet ingested
- Civics
- —
Market trends
- HPI YoY
- ▼ -193.38%
- Current HPI
- 244.9069
- Rent YoY
- ▲ 4.64%
- Metro
- Cincinnati, OH-KY-IN
- State GDP YoY
- ▲ 1.81%
- F500 in state
- 4
Industry mix (Fortune 500 HQ in KY)
| Industry | F500 HQs | Revenue |
|---|---|---|
| Healthcare | 1 | $118B |
|
||
| Food / Beverage | 1 | $7B |
|
||
Price history
+179.6% since first listed3 events — show timeline
- 2026-05-21 Listed $69,900 NKMLS
- 2025-06-27 Sold (Public Records) $60,000 Public Records
- 1996-09-30 Sold (Public Records) $25,000 Public Records
Property tax history
+11.0%/yrLatest (2025): $522 · -3.6% YoY. Source: county tax records.
Cash-flow waterfall
monthlySold comps — $/sqft
last 12 mo · ≤1 miLoading sold comps…