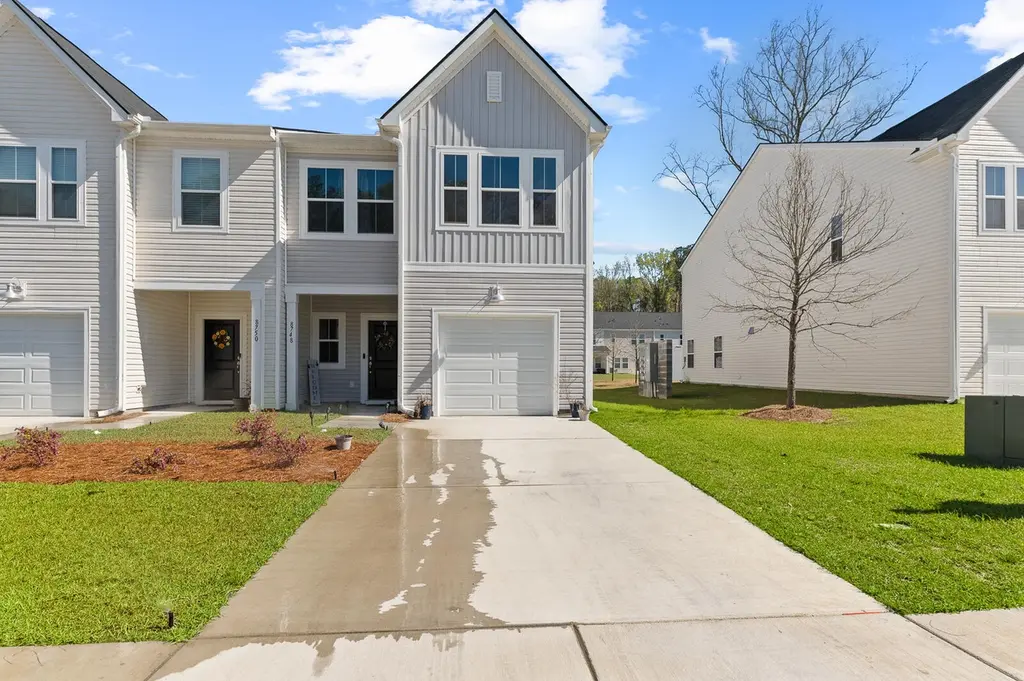
8748 Silver Perch Ln · North Charleston, SC
Flood risk No data
- FEMA flood zone
- —
- Chance of flooding over 30 yrs
- —
- Est. flood insurance / yr
- —
Fire risk No data
- Est. fire insurance / yr
- —
Heat risk No data
- Hot days now (above threshold)
- —
- Hot days in 30 yrs
- —
Wind risk No data
- Chance of severe wind over 30 yrs
- —
Air-quality risk No data
- Unhealthy air days now
- —
- Unhealthy air days in 30 yrs
- —
Risk factors via First Street. Map © Google.
Why this score? — see what drove the D+ grade
The composite is a weighted blend of 9 inputs, each scored 0–100. Each bar is that input's sub-score; the figure is the points it added to the 100-point composite (weight × sub-score).
- ARV discount +15.0/15.0
- Cash flow +13.4/30.0
- Schools +4.1/10.0
- DSCR +4.0/10.0
- Livability +3.3/5.0
- Rent growth +3.0/5.0
- 1% rule +2.6/10.0
- Condition / age +2.5/5.0
- Appreciation +0.0/10.0
$293,300
🖨 Deal sheet (PDF) 📄 Offer letter ✓ Due diligence
Listing remarks
PRE-APPROVED SHORT SALE!!! Welcome to this beautifully maintained home, built less than 2 years ago and still showing like new! This spacious property offers modern finishes, an open-concept layout, and plenty of natural light throughout. The main living area flows seamlessly from the stylish dining space into a comfortable living room--perfect for entertaining or relaxing at home. The kitchen and living areas overlook a large backyard, offering privacy and plenty of room to enjoy outdoor living. Upstairs, you'll find generously sized bedrooms, including a spacious primary suite with ample closet space. This home has been well cared for and is in great condition--giving you the benefits of
Key facts
- Garage
- Built 2024
- Listed 80 days
Property features AI
Finance
- HOA & community: Association fees paid monthly
Exterior
- Parking: Detached 1-car garage; 1 parking space total
- Utilities: Public sewer
- Home design: Single-family attached residential; Two-story; Located in the Patriot Park subdivision
- Construction: Townhouse construction
- Exterior features: Architectural roof
Interior
- Bedrooms: 3 bedrooms
- Bathrooms: 3 bathrooms (2.5 total)
- Interior features: Two levels; Townhouse structure
Neighborhood map
What this means for you Summary
Snapshot
- This is a 3-bed/2.5-bath single-family listed at $293k.
Deal economics
- At list price, monthly cash flow is $3 ($36/yr) — positive.
- The deal already cash-flows at list — no discount required.
- To meet the 1% rule (rent ≥ 1% of price), the offer needs to be $224k (23.5% below list).
- Recommended offer: $224k (23.5% below list) — sets the bar for 1% rule.
- Cap rate 6.3% vs local median 4.0% in North Charleston — top-decile yield for the area; either an underpriced asset or a hidden risk that comps aren't pricing in. Stress-test before assuming the spread holds.
Location & tenants
- Location reads 66/100 on livability (#122 in SC) — a middle-class / working-renter tenant base. Strengths: housing A+, health & safety A+, cost of living A; Watch: employment C-, crime F, amenities F.
- Dorchester 02 (suburban): math 40% / reading 55% proficiency, ranked #12 of 80 in SC (top 15%) — families likely to look elsewhere, expect single-tenant / working-renter base with shorter leases.
- Zoned schools: Eagle Nest Elementary (math 36% / reading 37%, grade F, #328 of 597 statewide, top 55%, 680 students, 82% FRL); River Oaks Middle (math 14% / reading 32%, grade F, #171 of 229 statewide, top 76%, 849 students, 84% FRL); Fort Dorchester High (math 58% / reading 88%, grade B+, #44 of 196 statewide, top 23%, 2,312 students, 62% FRL) — zoned schools average 76% FRL vs 36% district-wide (40 pts higher); higher-poverty schools than district average — tighter screening recommended.
- Market conditions: Rents rising (+1.8%/yr); 128 active listings in the ZIP; 17 comparable units currently listed for rent nearby; rentals at typical pace (median 16d on market — plan ~3-4 weeks tenant-placement turnaround); 1,199 units permitted in Dorchester County in 2024 (0 in 5+ unit buildings).
- This rent runs 37% of the median local income ($73k/yr) — at the standard rent-burdened threshold; future hikes will face affordability resistance.
Forward outlook
- Local home prices are declining (-3.0%/yr); year-one equity from $2k of loan paydown is wiped out by about $9k of value loss. Plan a longer hold.
- Dorchester County population projected at +43% by 2050 — long-run rental-demand tailwind backs the buy-and-hold thesis.
Negotiation context
- It's been on market 80 days — a 6% lower offer ($276k) is reasonable based on typical stale-listing flexibility.
Questions for the listing agent
- It's been on market 80 days. Have you received any prior offers? Is the seller open to a 24% concession, seller financing, or rate buy-down credit?
- Why hasn't it sold? Are there any deal-killer items the seller is aware of (foundation, flood, title, zoning, code violations)?
- Is there a deadline driving the sale (1031 exchange, divorce, estate, relocation)? That informs how much negotiation room exists.
- Crime grade is F in this area — have there been break-ins, vandalism, or insurance claims at this property in the last 3 years? What carrier currently insures it and at what premium?
- The area grade is low — what's the realistic commute time and amenity access for the typical tenant pool here? Any planned neighborhood developments (good or bad) we should know about?
- What's the average days-on-market for RENTAL listings here right now (not sales)? A rising rental-DOM trend means longer vacancies and softer asking-rent achievability than the comps imply.
- What's the recent tenant-quality profile in this submarket — average credit score on applications, eviction rate, late-payment / NSF rate, and stable-employment percentage? A property-management company in the area should have these aggregated.
- How much new for-sale + rental construction is in the pipeline within 1–3 miles? Heavy new supply typically softens prices + rents 12–24 months out; constrained supply supports both.
Investment metrics
- 1% rule
- 0.76% ✗
- Cap rate
- 6.31%
- Cash-on-cash
- 0.04%
- DSCR
- 1.00
- GRM
- 10.9
CMA / ARV
- ARV (on-the-fly)
- $375,440
- Comps found
- 12
Show comp detail 12 sales within ~0.75 mi
| Address | Dist | Beds/Ba | Sqft | Sold | Price | $/sf | Match |
|---|---|---|---|---|---|---|---|
| 8896 Arbor Glen Dr | 0.57mi | 3/2.5 | 1,890 (+5%) | 1mo | $320,000 | $169 | 65 |
| 5406 E Crosland Ct | 0.58mi | 3/2.0 | 1,768 (-2%) | 10mo | $390,000 | $221 | 59 |
| 8506 Kennestone Ln | 0.70mi | 3/2.0 | 1,718 (-5%) | 0mo | $400,000 | $233 | 57 |
| 8849 Kellum Dr | 0.72mi | 3/2.5 | 1,879 (+4%) | 3mo | $344,000 | $183 | 57 |
| 8782 Shadowglen Dr | 0.51mi | 4/2.5 (+1) | 1,900 (+5%) | 7mo | $280,000 | $147 | 57 |
| 4801 E Red Maple Cir | 0.70mi | 3/2.5 | 1,970 (+9%) | 2mo | $409,000 | $208 | 50 |
| 5402 Woodbreeze Dr | 0.71mi | 4/2.5 (+1) | 1,882 (+4%) | 6mo | $387,900 | $206 | 50 |
| 5401 Turgis Ct | 0.61mi | 3/2.0 | 1,627 (-10%) | 4mo | $369,250 | $227 | 50 |
| 8942 N Red Maple Cir | 0.75mi | 4/2.5 (+1) | 1,711 (-5%) | 6mo | $360,000 | $210 | 46 |
| 8926 Cat Tail Pond Rd | 0.65mi | 3/2.5 | 1,552 (-14%) | 4mo | $335,000 | $216 | 44 |
| 8752 Evangeline Dr | 0.66mi | 4/2.5 (+1) | 2,041 (+13%) | 1mo | $409,000 | $200 | 42 |
| 5406 Woodbreeze Dr | 0.73mi | 4/2.5 (+1) | 2,035 (+13%) | 9mo | $381,000 | $187 | 32 |
Match score weights: distance 35% · size 25% · config 20% · recency 20%. Top-matched comps best support the ARV.
Projected returns pro-forma
-3.0% appreciation · 1.83% rent growth · sell at horizon
- IRR
- -17.4%
- Equity multiple
- 0.39×
- Total profit
- $-50,068
- Equity at exit
- $43,732
- IRR
- -11.6%
- Equity multiple
- 0.34×
- Total profit
- $-54,316
- Equity at exit
- $25,359
Cash invested: $82,124 (down + closing). Projections, not guarantees.
Landlord ↔ Tenant lean methodology
- Overall (STATE)
- 90 Strongly Landlord-Friendly
- State South Carolina
- 90 Strongly Landlord-Friendly · R+6
- County
- — inherits STATE
- City
- — inherits STATE
ZIP-level market 29420
- Home prices YoY
- -14.6%
- Rents YoY
- 1.8%
- Active inventory
- 128
- Price-to-rent
- 10.9×
Monthly cashflow live
- Estimated rent
- $2,242 high interval (Pro) →
- Mortgage (P&I)
- −$1,538
- Tax from tax record
- −$108 /mo · $1,299/yr
- Insurance
- −$122
- HOA
- −$0
- Vacancy / Maint / Mgmt
- −$471
- Net cashflow
- $3
Break-even live
Sensitivity live
| Price | -10% $169 | -5% $86 | +0% $3 | +5% $-80 | +10% $-163 |
|---|---|---|---|---|---|
| Rent | -10% $-174 | -5% $-86 | +0% $3 | +5% $92 | +10% $180 |
| Rate | -1.0pp $151 | -0.5pp $78 | base $3 | +0.5pp $-73 | +1.0pp $-150 |
UW: 25.0% down · 7.5% · 30yr · 1.5% tax · 5.0% vac · 8.0% maint · 8.0% mgmt
Financing live
Cash to close
- Down payment
- $73,325
- Closing costs
- $8,799
- Reserves months
- —
- Total cash needed
- —
Loan-product check · same deal, 3 products live
Conventional
25% down · 7.5% · 30yr
- Down + closing
- —
- Monthly P&I
- —
- Monthly cashflow
- —
- DSCR
- —
- Eligible?
- —
Personal DTI + credit; lowest rate.
DSCR
20% down · 8.5% · 30yr
- Down + closing
- —
- Monthly P&I
- —
- Monthly cashflow
- —
- DSCR
- —
- Eligible?
- —
No personal income docs; deal must DSCR.
Hard money
10% down · 12.0% · 12mo
- Down + closing
- —
- Monthly P&I
- —
- Monthly cashflow
- —
- DSCR
- —
- Eligible?
- —
Short-term bridge; refi at stabilization.
Rent comps 17 comps
| Address | Beds | Baths | Sqft | Rent | $/sqft | DOM | Units | Dist |
|---|---|---|---|---|---|---|---|---|
| 8010 Triggerfish Way North Charleston, SC | 3.0 | 2.5 | 1805 | $2,250 | $1.25 | 13d | 1 | 0.04mi |
| 8670 Grassy Oak Trl North Charleston, SC | 3.0 | 2.5 | 1522 | $1,925 | $1.26 | 25d | 1 | 0.22mi |
| 8800 Dorchester Rd #603 North Charleston, SC | 3.0 | 2.0 | 1644 | $2,700 | $1.64 | 13d | 1 | 0.28mi |
| 8712 Grassy Oak Trl North Charleston, SC | 3.0 | 2.5 | 1600 | $2,250 | $1.41 | 16d | 1 | 0.35mi |
| 8800 Dorchester Rd North Charleston, SC | 3.0 | 2.0–2.5 | 1735 | $2,474 | $1.43 | 25d | 2 | 0.37mi |
| 8850 Dorchester Rd North Charleston, SC | 1.0–3.0 | 1.0–2.0 | 1287 | $2,143 | $1.67 | 12d | 15 | 0.45mi |
| 8988 Cat Tail Pond Rd Summerville, SC | 3.0 | 2.5 | 1790 | $2,300 | $1.28 | 25d | 1 | 0.50mi |
| 8968 Cat Tail Pond Rd Summerville, SC | 3.0 | 2.5 | 1677 | $2,450 | $1.46 | 16d | 1 | 0.50mi |
| 5402 Netherby Ln North Charleston, SC | 1.0–2.0 | 1.0–2.0 | 1032 | $3,414 | $3.31 | 4d | 1 | 0.51mi |
| 5410 Barnsley Dr North Charleston, SC | 4.0 | 2.5 | 2302 | $2,899 | $1.26 | 4d | 1 | 0.84mi |
| 9162 Maple Grove Dr Summerville, SC | 4.0 | 3.0 | 1708 | $2,325 | $1.36 | 20d | 1 | 1.03mi |
| 9162 Maple Grove Dr Unit 1 Summerville, SC | 4.0 | 2.5 | 1708 | $2,325 | $1.36 | 25d | 1 | 1.03mi |
| 4821 Oak Leaf Rd Summerville, SC | 4.0 | 2.0 | 1752 | $2,199 | $1.26 | 16d | 1 | 1.14mi |
| 9580 Old Glory Ln Summerville, SC | 2.0–3.0 | 1.0–2.0 | 1280 | $1,800 | $1.41 | 4d | 9 | 1.29mi |
| 8486 William Moultrie Dr North Charleston, SC | 3.0 | 2.0 | 1454 | $2,300 | $1.58 | 4d | 1 | 1.38mi |
| 4834 Habersham Ln Summerville, SC | 3.0 | 2.0 | 1319 | $1,900 | $1.44 | 25d | 1 | 1.44mi |
| 4841 Habersham Ln Summerville, SC | 3.0 | 2.0 | 1319 | $1,965 | $1.49 | 16d | 1 | 1.47mi |
Listing history 18 events
-
2026-06-22days on market $293,300 Active 80 DOM
-
2026-06-18days on market $293,300 Active 77 DOM
-
2026-06-17days on market $293,300 Active 76 DOM
-
2026-06-16days on market $293,300 Active 75 DOM
-
2026-06-15days on market $293,300 Active 74 DOM
-
2026-06-13days on market $293,300 Active 72 DOM
-
2026-06-13days on market $293,300 Active 71 DOM
-
2026-06-10days on market $293,300 Active 69 DOM
-
2026-06-09days on market $293,300 Active 68 DOM
-
2026-06-08days on market $293,300 Active 67 DOM
-
2026-06-07days on market $293,300 Active 66 DOM
-
2026-06-03days on market $293,300 Active 62 DOM
-
2026-06-01days on market $293,300 Active 60 DOM
-
2026-05-31days on market $293,300 Active 59 DOM
-
2026-05-22price $303,999
-
2026-05-14price $309,990
-
2026-04-02$315,000 Active
-
2024-09-23soldstatus $1,024,976
ⓘ Source: listings_history table (triggers on properties + properties_extension) + one-shot
backfill from property_details.listing_events for pre-trigger history.
Tax reassessment forecast SC · Resets to sale price
- Current annual tax
- $1,299 · $108/mo
- Projected year-2 tax
- $1,672 · $139/mo
- Expected delta
- +$373/yr (+$31/mo · 28.7%)
ⓘ Screening estimate from a state-policy table — verify with the county assessor before closing.
Nearby sold comps map
Loading sold comps map…
Walkable amenities ~0.75 mi
Loading nearby amenities…
Taxation est. · year 1
- Rental income
- $26,910
- − Mortgage interest
- −$16,429
- − Property taxes
- −$1,299
- − Insurance
- −$1,466
- − Repairs & maintenance
- −$2,153
- − Management
- −$2,153
- − Depreciation
- −$8,532
- Taxable loss
- −$5,123
- Est. tax savings @ 24.0%
- +$1,229
- After-tax cash flow
- $1,266/yr
For passive investors: Depreciation is non-cash, so a rental often shows a tax loss while cash-flowing — sheltering income. Rental losses are passive: they offset passive income freely, and up to $25,000/yr can offset ordinary (W-2) income if you actively participate and your MAGI is under $100k (phasing out to $0 by $150k); unused losses carry forward. On sale, claimed depreciation is recaptured at up to 25%, and gains may owe capital-gains tax (a 1031 exchange can defer both). Figures are a year-1 estimate at your 24.0% rate — not tax advice; consult a CPA.
Schools (NCES district)
- District
- Dorchester 02
- NCES district ID
- 4502010
- Math proficiency
- 40% ▼ -13.00%
- Reading proficiency
- 55% ▼ -4.00%
- Median HH income
- $57,937
- Composite
- 41.41/100
- National rank
- #3475
- State rank
- #12 of 80 in SC
Livability — North Charleston
- Score
- 66/100
- State rank
- #122
- US rank
- #12222
Category grades
Schools grade is shown separately in the Schools card above.
Census & demographics
- Census place
- North Charleston, SC
- County
- Dorchester County · 182,866 people
- City population
- 108,266
- Metro
- Charleston-North Charleston, SC
- Population (ZIP)
- 23,959
- Household income
- $72,661
- Rent vs Own
- Severe rent burden
- 738.0
Population outlook (Dorchester County) Hauer SSP2
- Today (2025)
- 186,982 people
- By 2030
- 203,967 · +9.1%
- By 2040
- 237,160 · +26.8%
- By 2050
- 267,479 · +43.1%
- By 2075
- 333,025 · +78.1%
- By 2100
- 366,560 · +96.0%
Race, ethnicity, and origin ACS 2023
- Neighborhood character
- Diverse neighborhood (Simpson 0.66)
- Race & ethnicity
- White 41% Black 39% Hispanic / Latino 11% Asian 5% Two or more races 3%
- Hispanic origin (detail)
- Mexican 6% Puerto Rican 1%
- Common ancestry
- Slovak 2% Italian 2% Lithuanian 1%
- Foreign-born
- 10% · Canada, China, Vietnam
- Languages at home
- 86% English-only · Spanish 10% Chinese 1% Other Asian/Pacific 1%
Political lean MEDSL · Dorchester
- 2024 margin
- R (+14.6) · D 41.8% · R 56.4% · Other 1.9%
- 2008→2024 swing
- +0.9pp no change · 2008: -15.5pp · 2024: -14.6pp
- All cycles
- 2024: R+14.6 2020: R+10.5 2016: R+17.5 2012: R+16.0 2008: R+15.5
Not yet ingested
- Civics
- —
Market trends
- HPI YoY
- ▼ -46.51%
- Current HPI
- 271.2116
- Rent YoY
- ▲ 1.83%
- Metro
- Charleston-North Charleston, SC
- State GDP YoY
- ▲ 4.51%
- F500 in state
- 2
Industry mix (Fortune 500 HQ in SC)
| Industry | F500 HQs | Revenue |
|---|---|---|
| Packaging | 1 | $7B |
|
||
Price history
-70.3% since first listed4 events — show timeline
- 2026-05-22 Price Changed $303,999 Charleston Trident MLS
- 2026-05-14 Price Changed $309,990 Charleston Trident MLS
- 2026-04-02 Listed $315,000 Charleston Trident MLS
- 2024-09-23 Sold (Public Records) $1,024,976 Public Records
Cash-flow waterfall
monthlySold comps — $/sqft
last 12 mo · ≤1 miLoading sold comps…