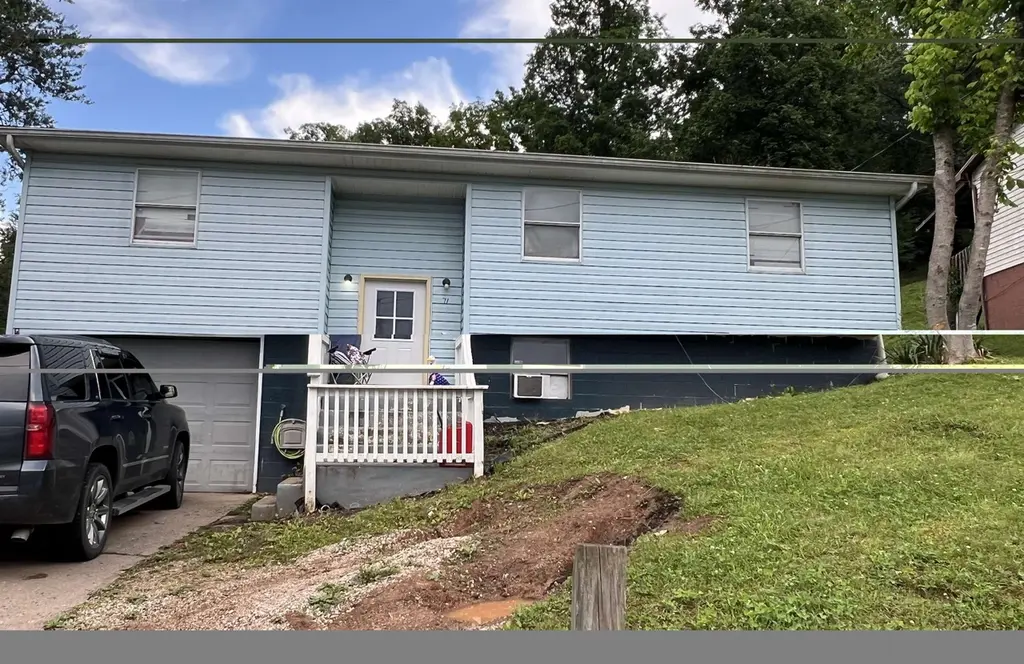
71 Ridge Rd · Wayne, WV
Flood risk 1/10 · Minimal
- FEMA flood zone
- X (unshaded)
- Chance of flooding over 30 yrs
- 0.0%
- Est. flood insurance / yr
- $473 – $860
Fire risk 5/10 · Moderate
- Est. fire insurance / yr
- $787 – $1,461
Heat risk 4/10 · Minor
- Hot days now (above 101°F)
- 7 days/yr
- Hot days in 30 yrs
- 19 days/yr
Wind risk 2/10 · Minimal
- Chance of severe wind over 30 yrs
- 1.0%
Air-quality risk 1/10 · Minimal
- Unhealthy air days now
- 0 days/yr
- Unhealthy air days in 30 yrs
- 0 days/yr
Risk factors via First Street. Map © Google.
Why this score? — see what drove the C grade
The composite is a weighted blend of 9 inputs, each scored 0–100. Each bar is that input's sub-score; the figure is the points it added to the 100-point composite (weight × sub-score).
- Cash flow +19.0/30.0
- Appreciation +8.7/10.0
- ARV discount +7.5/15.0
- DSCR +6.0/10.0
- 1% rule +5.1/10.0
- Livability +3.0/5.0
- Schools +2.6/10.0
- Rent growth +2.5/5.0
- Condition / age +2.2/5.0
$102,400
🖨 Deal sheet 📄 Offer letter ✓ Due diligence
Listing remarks
This home features 3 bedrooms and a full bath on the main upper level, along with a semi-open floor plan that creates a seamless flow from the living room to the dining area. Downstairs, the finished basement provides even more living space and flexibility. Whether you need a large family room, game room, home office, or a 4th bedroom, this space can easily fit your needs. The basement also includes a second full bathroom, laundry area, and convenient access to the attached garage. Conveniently located in the heart of Wayne, this home would be great as a primary residence or investment property.
Key facts
- Garage
- Built 1990
- Listed 17 days
Property features AI
Finance
- Financial info: Property is currently rented month-to-month for $650/month (tenant may be present for showings)
Exterior
- Parking: Attached garage (1 car); Off-street parking
- Utilities: Public water; Public sewer
- Home design: Single family residence; 2 stories
- Construction: Vinyl siding; Shingle roof
- Exterior features: Deck; Above-ground pool does not convey
Interior
- Kitchen: Range; Oven; Refrigerator
- Flooring: Laminate; Wood
- Bathrooms: 2 full bathrooms
- Heating & cooling: Baseboard heating; Window unit cooling
- Interior features: Full finished basement; Range, Oven, Refrigerator
Neighborhood map
What this means for you Summary
Snapshot
- This is a 3-bed/2.0-bath single-family listed at $102k. Condition is rated fair.
Deal economics
- At list price, monthly cash flow is $106 ($1k/yr) — positive.
- The deal already cash-flows at list — no discount required.
- Meets the 1% rule at list price ($1k rent vs $102k).
- Recommended offer: $101k (1.5% below list) — sets the bar for market timing.
Location & tenants
- Location reads 59/100 on livability (#226 in WV) — a working-class tenant base; expect higher turnover. Strengths: crime A+, cost of living A+, housing A-; Watch: amenities F, commute F, employment F.
- Wayne County Schools (rural): math 25% / reading 38% proficiency, ranked #25 of 55 in WV (top 46%) — families likely to look elsewhere, expect single-tenant / working-renter base with shorter leases.
- Zoned schools: Wayne Elementary School (math 25% / reading 25%, grade F, #286 of 377 statewide, top 76%, 467 students, 0% FRL); Wayne Middle School (math 15% / reading 34%, grade F, #84 of 109 statewide, top 81%, 371 students, 0% FRL); Wayne High School (math 12% / reading 47%, grade F, #69 of 110 statewide, top 71%, 611 students, 0% FRL) — zoned schools average 0% FRL vs 46% district-wide (46 pts lower); this property's tenant base skews higher-income than the district average.
- Market conditions: 10 active listings in the ZIP; 67 units permitted in Wayne County in 2024 (0 in 5+ unit buildings).
Forward outlook
- In year one you build about $8k of equity ($708 loan paydown + $8k appreciation (7.3% local appreciation)).
- Wayne County population projected at -22% by 2050 — secular population decline; favor cash flow + early exit over multi-decade hold.
- At projected returns (7.3% appreciation + 3.0% rent growth), your $29k cash investment doubles in ~3 years — after that, you're playing with house money.
- By year 5, paydown + projected appreciation supports a ~$37k cash-out refi (75% LTV) — recoverable capital for the next deal without selling this one.
Negotiation context
- It's been on market 18 days — a 2% lower offer ($101k) is reasonable based on typical stale-listing flexibility.
Risks & watch-outs
- Climate carrying-cost: moderate wildfire risk — expect insurance premiums to compound above CPI over the hold.
Questions for the listing agent
- Have any recent inspections been done? Can we get a copy of the seller's disclosures and any deferred-maintenance estimates?
- Is there a deadline driving the sale (1031 exchange, divorce, estate, relocation)? That informs how much negotiation room exists.
- Schools are F-rated, which usually means shorter tenancies and higher turnover. Who's the typical renter profile here, and what's been the actual vacancy rate?
- What's the average days-on-market for RENTAL listings here right now (not sales)? A rising rental-DOM trend means longer vacancies and softer asking-rent achievability than the comps imply.
- What's the recent tenant-quality profile in this submarket — average credit score on applications, eviction rate, late-payment / NSF rate, and stable-employment percentage? A property-management company in the area should have these aggregated.
- How much new for-sale + rental construction is in the pipeline within 1–3 miles? Heavy new supply typically softens prices + rents 12–24 months out; constrained supply supports both.
Investment metrics
- 1% rule
- 1.01% ✓
- Cap rate
- 7.54%
- Cash-on-cash
- 4.44%
- DSCR
- 1.20
- GRM
- 8.3
CMA / ARV
- ARV (on-the-fly)
- $38,912
- Comps found
- 1
Show comp detail 1 sale within ~0.75 mi
| Address | Dist | Beds/Ba | Sqft | Sold | Price | $/sf | Match |
|---|---|---|---|---|---|---|---|
| 59 Lower Terrace Dr | 0.51mi | 3/1.0 | 1,040 (+2%) | 4mo | $40,000 | $38 | 66 |
Match score weights: distance 35% · size 25% · config 20% · recency 20%. Top-matched comps best support the ARV.
Projected returns pro-forma
7.35% appreciation · 3.0% rent growth · sell at horizon
- IRR
- 22.0%
- Equity multiple
- 2.56×
- Total profit
- $44,762
- Equity at exit
- $73,341
- IRR
- 20.4%
- Equity multiple
- 5.36×
- Total profit
- $124,911
- Equity at exit
- $141,525
Cash invested: $28,672 (down + closing). Projections, not guarantees.
Landlord ↔ Tenant lean methodology
- Overall (STATE)
- 83 Strongly Landlord-Friendly
- State West Virginia
- 83 Strongly Landlord-Friendly · R+22
- County
- — inherits STATE
- City
- — inherits STATE
ZIP-level market 25570
- Home prices YoY
- 3.9%
- Active inventory
- 10
- Price-to-rent
- 8.3×
Monthly cashflow live
- Estimated rent
- $1,030 medium interval (Pro) →
- Mortgage (P&I)
- −$537
- Tax est. 1.5%
- −$128 /mo · $1,536/yr
- Insurance
- −$43
- HOA
- −$0
- Vacancy / Maint / Mgmt
- −$216
- Net cashflow
- $106
Break-even live
UW: 25.0% down · 7.5% · 30yr · 1.5% tax · 5.0% vac · 8.0% maint · 8.0% mgmt
Financing live
Cash to close
- Down payment
- $25,600
- Closing costs
- $3,072
- Reserves months
- —
- Total cash needed
- —
Loan-product check · same deal, 3 products live
Conventional
25% down · 7.5% · 30yr
- Down + closing
- —
- Monthly P&I
- —
- Monthly cashflow
- —
- DSCR
- —
- Eligible?
- —
Personal DTI + credit; lowest rate.
DSCR
20% down · 8.5% · 30yr
- Down + closing
- —
- Monthly P&I
- —
- Monthly cashflow
- —
- DSCR
- —
- Eligible?
- —
No personal income docs; deal must DSCR.
Hard money
10% down · 12.0% · 12mo
- Down + closing
- —
- Monthly P&I
- —
- Monthly cashflow
- —
- DSCR
- —
- Eligible?
- —
Short-term bridge; refi at stabilization.
Listing history 14 events
-
2026-06-19days on market $102,400 Active 18 DOM
-
2026-06-18days on market $102,400 Active 17 DOM
-
2026-06-17days on market $102,400 Active 16 DOM
-
2026-06-16days on market $102,400 Active 15 DOM
-
2026-06-15days on market $102,400 Active 14 DOM
-
2026-06-14days on market $102,400 Active 12 DOM
-
2026-06-12days on market $102,400 Active 11 DOM
-
2026-06-09days on market $102,400 Active 8 DOM
-
2026-06-08days on market $102,400 Active 7 DOM
-
2026-06-07days on market $102,400 Active 6 DOM
-
2026-06-05days on market $102,400 Active 3 DOM
-
2026-06-03days on market $102,400 Active 2 DOM
-
2026-06-02remarks 602-char remark
-
2026-06-02$102,400 Active 1 DOM
ⓘ Source: listings_history table (triggers on properties + properties_extension) + one-shot
backfill from property_details.listing_events for pre-trigger history.
Climate risk First Street
- Flood 1/10 Low FEMA zone X (unshaded) · 0% chance over 30 yrs
- Wildfire 5/10 Major
- Heat 4/10 Moderate 7 d/yr ≥101°F today · 19 d/yr by 30 yrs out
- Wind 2/10 Low 100% chance of damaging wind over 30 yrs
- Air quality 1/10 Low 0 unhealthy d/yr today · 0 by 30 yrs out
Nearby sold comps map
Loading sold comps map…
Walkable amenities ~0.75 mi
Loading nearby amenities…
Taxation est. · year 1
- Rental income
- $12,360
- − Mortgage interest
- −$5,736
- − Property taxes
- −$1,536
- − Insurance
- −$512
- − Repairs & maintenance
- −$989
- − Management
- −$989
- − Depreciation
- −$2,979
- Taxable loss
- −$381
- Est. tax savings @ 24.0%
- +$91
- After-tax cash flow
- $1,363/yr
For passive investors: Depreciation is non-cash, so a rental often shows a tax loss while cash-flowing — sheltering income. Rental losses are passive: they offset passive income freely, and up to $25,000/yr can offset ordinary (W-2) income if you actively participate and your MAGI is under $100k (phasing out to $0 by $150k); unused losses carry forward. On sale, claimed depreciation is recaptured at up to 25%, and gains may owe capital-gains tax (a 1031 exchange can defer both). Figures are a year-1 estimate at your 24.0% rate — not tax advice; consult a CPA.
Condition & rehab AI · 8 photos
This home requires moderate updates to the kitchen and bathroom, and a fresh coat of paint on the exterior to improve its curb appeal and resale value.
Repairs flagged
- Moderate kitchen cabinets — dated and in need of updating
- Moderate kitchen appliances — outdated and in need of replacement
- Moderate bathroom fixtures — dated and in need of replacement
Value-add opportunities
- Both paint exterior — enhances curb appeal and resale value
- Both update kitchen — modernizes the space and increases appeal
- Both update bathroom — modernizes the space and increases appeal
Renovation cost estimate screening
| Repair item | Severity | Est. cost |
|---|---|---|
| kitchen cabinets · dated and in need of updating | Moderate | $3,000–15,000 |
| kitchen appliances · outdated and in need of replacement | Moderate | $3,000–15,000 |
| bathroom fixtures · dated and in need of replacement | Moderate | $3,000–15,000 |
| Total estimated repair cost · 3 items | $9,000–45,000 |
Value-add ROI direction
- Both paint exterior — enhances curb appeal and resale value ↑
- Both update kitchen — modernizes the space and increases appeal ↑
- Both update bathroom — modernizes the space and increases appeal ↑
ⓘ Cost ranges are severity-bucket heuristics (US national rule-of-thumb). Get contractor quotes + a written scope before underwriting a rehab budget.
Schools (NCES district)
- District
- Wayne County Schools
- NCES district ID
- 5401500
- Math proficiency
- 25% ▼ -15.00%
- Reading proficiency
- 38% ▼ -10.00%
- Median HH income
- $36,283
- Composite
- 26.08/100
- National rank
- #7297
- State rank
- #25 of 55 in WV
Livability — Wayne
- Score
- 59/100
- State rank
- #226
- US rank
- #19755
Category grades
Schools grade is shown separately in the Schools card above.
Census & demographics
- Population (ZIP)
- 6,075
Population outlook (Wayne County) Hauer SSP2
- Today (2025)
- 38,267 people
- By 2030
- 36,578 · -4.4%
- By 2040
- 33,034 · -13.7%
- By 2050
- 29,671 · -22.5%
- By 2075
- 22,901 · -40.2%
- By 2100
- 17,421 · -54.5%
Race, ethnicity, and origin ACS 2023
- Neighborhood character
- Predominantly White (98%)
- Race & ethnicity
- White 98% Two or more races 2%
- Common ancestry
- Italian 5% Serbian 2% Slovak 1%
- Foreign-born
- 0%
Political lean MEDSL · Wayne
- 2024 margin
- Solid R (+53.4) · D 22.4% · R 75.8% · Other 1.8%
- 2008→2024 swing
- -35.1pp toward R · 2008: -18.2pp · 2024: -53.4pp
- All cycles
- 2024: R+53.4 2020: R+50.1 2016: R+51.3 2012: R+27.0 2008: R+18.2
Not yet ingested
- Civics
- —
Market trends
- HPI YoY
- ▲ 7.35%
- Current HPI
- 194.3706
- Rent YoY
- —
- Metro
- —
- State GDP YoY
- —
- F500 in state
- 0
Price history
1 event — show timeline
- 2026-06-01 Listed $102,400 HBRMLS
Cash-flow waterfall
monthlySold comps — $/sqft
last 12 mo · ≤1 miLoading sold comps…