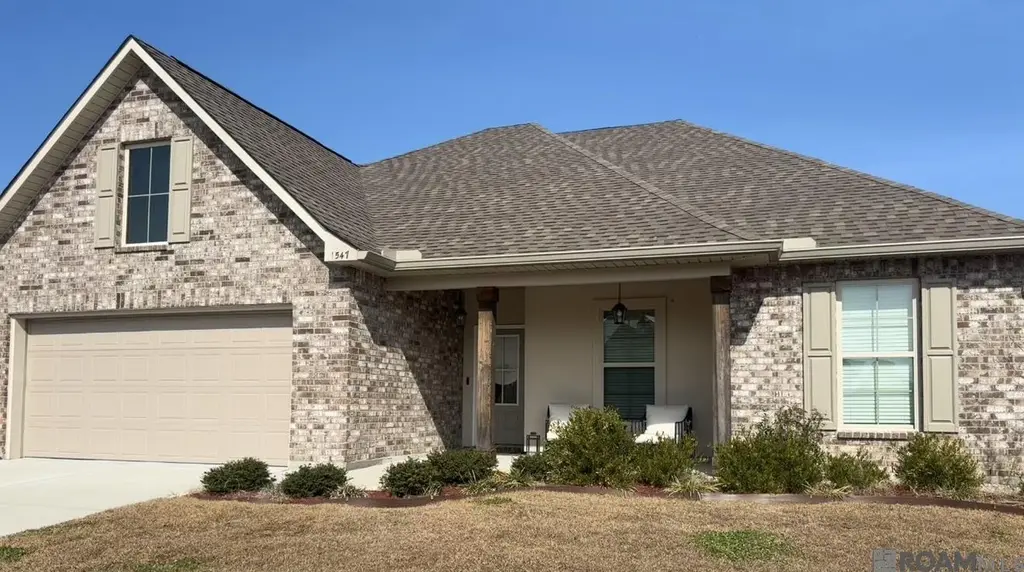
1547 Rangeland Ave · Zachary, LA
Flood risk 1/10 · Minimal
- FEMA flood zone
- X (unshaded)
- Chance of flooding over 30 yrs
- 0.0%
- Est. flood insurance / yr
- $507 – $1,088
Fire risk 1/10 · Minimal
- Est. fire insurance / yr
- $1,269 – $2,357
Heat risk 8/10 · Major
- Hot days now (above 108°F)
- 7 days/yr
- Hot days in 30 yrs
- 20 days/yr
Wind risk 9/10 · Severe
- Chance of severe wind over 30 yrs
- 99.0%
Air-quality risk 2/10 · Minimal
- Unhealthy air days now
- 1 days/yr
- Unhealthy air days in 30 yrs
- 2 days/yr
Risk factors via First Street. Map © Google.
Why this score? — see what drove the D- grade
The composite is a weighted blend of 9 inputs, each scored 0–100. Each bar is that input's sub-score; the figure is the points it added to the 100-point composite (weight × sub-score).
- ARV discount +10.2/15.0
- Cash flow +9.4/30.0
- Schools +4.7/10.0
- Rent growth +3.5/5.0
- Livability +3.5/5.0
- DSCR +2.7/10.0
- 1% rule +2.6/10.0
- Condition / age +2.5/5.0
- Appreciation +0.0/10.0
$265,000
🖨 Deal sheet 📄 Offer letter ✓ Due diligence
Listing remarks MLS
Welcome to this beautifully maintained residence that perfectly combines spacious living with modern comfort. Designed with an inviting open floor plan, this home features four bedrooms and two bathrooms providing ample space for family, guests, or a home office which is thoughtfully designed to meet the needs of daily life with style and convenience. Every corner of this property reflects excellent upkeep and attention to detail, making it move-in ready for its new owners. The open layout enhances natural light throughout the main living spaces, contributing to a warm and airy atmosphere. Whether you're hosting gatherings or enjoying quiet evenings at home, the blend of functionality and comfort in this residence ensures a superb living experience. Don't miss the opportunity to own a home that balances space, style, and excellent condition in a sought-after neighborhood.
Key facts
- 9,147 sq ft lot
- 2 parking spots
- Built 2022
Neighborhood map
What this means for you Summary
Snapshot
- This is a 4-bed/2.0-bath single-family listed at $265k.
Deal economics
- At list price, monthly cash flow is $-187 ($-2k/yr) — negative.
- To cash-flow at today's rent, offer at most $232k (12.5% below list).
- To meet the 1% rule (rent ≥ 1% of price), the offer needs to be $202k (23.9% below list).
- Recommended offer: $202k (23.9% below list) — sets the bar for 1% rule.
- Cap rate 5.4% vs local median 4.5% in Zachary — meaningfully above typical; check what's discounted (condition, days-on-market, listing class) to confirm the premium yield is real.
Location & tenants
- Location reads 69/100 on livability (#64 in LA) — a middle-class / working-renter tenant base. Strengths: schools A+, employment A+, housing A+; Watch: crime C-, amenities F, commute F.
- Zachary Community School District (suburban): math 46% / reading 60% proficiency, ranked #8 of 98 in LA (top 8%) — acceptable for families but not a draw, mixed tenant base, ~2y average lease.
- Market conditions: Rents rising fast (+4.2%/yr); 584 active listings in the ZIP; 5 comparable units currently listed for rent nearby; rentals at typical pace (median 14d on market — plan ~3-4 weeks tenant-placement turnaround); solid renter incomes; 2,252 units permitted in East Baton Rouge Parish in 2024 (440 in 5+ unit buildings).
- This rent runs 31% of the median local income ($78k/yr) — at the standard rent-burdened threshold; future hikes will face affordability resistance.
Forward outlook
- Local home prices are declining (-3.0%/yr); year-one equity from $2k of loan paydown is wiped out by about $8k of value loss. Plan a longer hold.
- East Baton Rouge County population projected at +4% by 2050 — modest demand growth; plan on rents tracking national, not racing it.
Negotiation context
- It's been on market 30 days — a 2% lower offer ($261k) is reasonable based on typical stale-listing flexibility.
- 6 sale attempts since 4y ago with the ask held roughly flat each time — persistent listings suggest the price (not the market) is what's stuck; bring a comps-based counter.
Risks & watch-outs
- Climate carrying-cost: severe wind risk, 99% chance of damaging wind over 30y; extreme-heat days projected 7→20/yr by 2055 (HVAC capex compounding) — expect insurance premiums to compound above CPI over the hold.
Questions for the listing agent
- What do current leases actually rent for vs. the listed asking? Can we see a recent rent roll and the last 12 months of T-12 income?
- What does the HOA fee cover, when was the last increase, and are there any pending special assessments or reserve-fund shortfalls?
- Is there a deadline driving the sale (1031 exchange, divorce, estate, relocation)? That informs how much negotiation room exists.
- Schools are A-rated — typically a magnet for longer-tenancy family renters. What's the average tenant stay here, and is there a school-zone premium baked into asking?
- The area grade is low — what's the realistic commute time and amenity access for the typical tenant pool here? Any planned neighborhood developments (good or bad) we should know about?
- What's the average days-on-market for RENTAL listings here right now (not sales)? A rising rental-DOM trend means longer vacancies and softer asking-rent achievability than the comps imply.
- What's the recent tenant-quality profile in this submarket — average credit score on applications, eviction rate, late-payment / NSF rate, and stable-employment percentage? A property-management company in the area should have these aggregated.
- How much new for-sale + rental construction is in the pipeline within 1–3 miles? Heavy new supply typically softens prices + rents 12–24 months out; constrained supply supports both.
Investment metrics
- 1% rule
- 0.76% ✗
- Cap rate
- 5.45%
- Cash-on-cash
- -3.02%
- DSCR
- 0.87
- GRM
- 10.9
CMA / ARV
- ARV (median comp)
- $281,692
- List price
- $265,000
- Delta
- -5.93%
- Verdict
- FAIR
- Comps
- 20 within 1.0 mi
Show comp detail 12 sales within ~0.75 mi
| Address | Dist | Beds/Ba | Sqft | Sold | Price | $/sf | Match |
|---|---|---|---|---|---|---|---|
| 1553 Old Tucson Ave | 0.11mi | 4/2.0 | 1,865 (+0%) | 1mo | $280,935 | $151 | 93 |
| 1526 Cavalry Ave | 0.11mi | 4/2.0 | 1,865 (+0%) | 5mo | $281,700 | $151 | 90 |
| 1630 S Plains Ave | 0.19mi | 4/2.5 | 1,833 (-1%) | 6mo | $280,815 | $153 | 82 |
| 1587 Old Tucson Ave | 0.15mi | 3/2.0 (-1) | 1,825 (-2%) | 6mo | $280,310 | $154 | 80 |
| 1636 S Plains Ave | 0.21mi | 3/2.0 (-1) | 1,887 (+2%) | 5mo | $287,110 | $152 | 78 |
| 1613 S Plains Ave | 0.21mi | 3/2.0 (-1) | 1,825 (-2%) | 5mo | $285,215 | $156 | 78 |
| 1647 Rangeland Ave | 0.13mi | 4/3.0 | 2,072 (+12%) | 1mo | $294,900 | $142 | 70 |
| 1606 Old Tucson Ave | 0.20mi | 3/2.0 (-1) | 1,689 (-9%) | 4mo | $267,195 | $158 | 67 |
| 20736 Great Plains Ave | 0.17mi | 3/2.0 (-1) | 1,629 (-12%) | 4mo | $257,108 | $158 | 63 |
| 2104 Clark Ave | 0.75mi | 4/2.0 | 1,697 (-9%) | 1mo | $276,900 | $163 | 50 |
| 21455 Field Glen Dr | 0.68mi | 4/2.0 | 2,079 (+12%) | 6mo | $249,000 | $120 | 44 |
| 2020 Clark Ave | 0.74mi | 5/3.0 (+1) | 2,068 (+11%) | 6mo | $299,900 | $145 | 33 |
Match score weights: distance 35% · size 25% · config 20% · recency 20%. Top-matched comps best support the ARV.
Projected returns pro-forma
-3.0% appreciation · 4.18% rent growth · sell at horizon
- IRR
- -20.1%
- Equity multiple
- 0.29×
- Total profit
- $-52,430
- Equity at exit
- $39,512
- IRR
- -10.8%
- Equity multiple
- 0.32×
- Total profit
- $-50,813
- Equity at exit
- $22,912
Cash invested: $74,200 (down + closing). Projections, not guarantees.
Landlord ↔ Tenant lean methodology
- Overall (STATE)
- 90 Strongly Landlord-Friendly
- State Louisiana
- 90 Strongly Landlord-Friendly · R+12
- County
- — inherits STATE
- City
- — inherits STATE
ZIP-level market 70791
- Home prices YoY
- -21.6%
- Rents YoY
- 4.2%
- Active inventory
- 584
- Price-to-rent
- 10.9×
Monthly cashflow live
- Estimated rent
- $2,017 high interval (Pro) →
- Mortgage (P&I)
- −$1,390
- Tax from tax record
- −$255 /mo · $3,063/yr
- Insurance
- −$110
- HOA
- −$25
- Vacancy / Maint / Mgmt
- −$424
- Net cashflow
- $-187
Break-even live
UW: 25.0% down · 7.5% · 30yr · 1.5% tax · 5.0% vac · 8.0% maint · 8.0% mgmt
Financing live
Cash to close
- Down payment
- $66,250
- Closing costs
- $7,950
- Reserves months
- —
- Total cash needed
- —
Loan-product check · same deal, 3 products live
Conventional
25% down · 7.5% · 30yr
- Down + closing
- —
- Monthly P&I
- —
- Monthly cashflow
- —
- DSCR
- —
- Eligible?
- —
Personal DTI + credit; lowest rate.
DSCR
20% down · 8.5% · 30yr
- Down + closing
- —
- Monthly P&I
- —
- Monthly cashflow
- —
- DSCR
- —
- Eligible?
- —
No personal income docs; deal must DSCR.
Hard money
10% down · 12.0% · 12mo
- Down + closing
- —
- Monthly P&I
- —
- Monthly cashflow
- —
- DSCR
- —
- Eligible?
- —
Short-term bridge; refi at stabilization.
Rent comps 5 comps
| Address | Beds | Baths | Sqft | Rent | $/sqft | DOM | Units | Dist |
|---|---|---|---|---|---|---|---|---|
| 1233 Mount Pleasant Zachary Rd Zachary, LA | 1.0–3.0 | 1.0–2.0 | 1043 | $1,722 | $1.65 | 14d | 7 | 0.61mi |
| 2195 Ridgefield Ave Zachary, LA | 4.0 | 2.0 | 1900 | $1,900 | $1.00 | 43d | 1 | 0.66mi |
| 2123 Westfield Ave Zachary, LA | 4.0 | 2.0 | 2093 | $2,295 | $1.10 | 14d | 1 | 0.71mi |
| 20051 Old Scenic Hwy Zachary, LA | 1.0–3.0 | 1.0–2.0 | 1174 | $1,625 | $1.38 | 14d | 15 | 0.74mi |
| 1126 Willow Creek Dr Unit 1128 Zachary, LA | 3.0 | 2.0 | 1275 | $1,345 | $1.05 | 14d | 1 | 0.99mi |
HOA detail
- Monthly dues
- $25 · $300/yr
Listing history 24 events
-
2026-06-18days on market $265,000 Active 30 DOM
-
2026-06-17days on market $265,000 Active 29 DOM
-
2026-06-16days on market $265,000 Active 28 DOM
-
2026-06-15days on market $265,000 Active 27 DOM
-
2026-06-14days on market $265,000 Active 25 DOM
-
2026-06-13days on market $265,000 Active 24 DOM
-
2026-06-10days on market $265,000 Active 22 DOM
-
2026-06-09days on market $265,000 Active 21 DOM
-
2026-06-08days on market $265,000 Active 20 DOM
-
2026-06-07days on market $265,000 Active 19 DOM
-
2026-06-03days on market $265,000 Active 15 DOM
-
2026-06-02days on market $265,000 Active 14 DOM
-
2026-06-01days on market $265,000 Active 13 DOM
-
2026-05-31days on market $265,000 Active 12 DOM
-
2026-05-31days on market $265,000 Active 11 DOM
-
2026-05-19$265,000 Active 884-char remark
Show marketing remark (884 chars)
Welcome to this beautifully maintained residence that perfectly combines spacious living with modern comfort. Designed with an inviting open floor plan, this home features four bedrooms and two bathrooms providing ample space for family, guests, or a home office which is thoughtfully designed to meet the needs of daily life with style and convenience. Every corner of this property reflects excellent upkeep and attention to detail, making it move-in ready for its new owners. The open layout enhances natural light throughout the main living spaces, contributing to a warm and airy atmosphere. Whether you're hosting gatherings or enjoying quiet evenings at home, the blend of functionality and comfort in this residence ensures a superb living experience. Don't miss the opportunity to own a home that balances space, style, and excellent condition in a sought-after neighborhood.
-
2026-05-19$265,000 Active
Show marketing remark (884 chars)
Welcome to this beautifully maintained residence that perfectly combines spacious living with modern comfort. Designed with an inviting open floor plan, this home features four bedrooms and two bathrooms providing ample space for family, guests, or a home office which is thoughtfully designed to meet the needs of daily life with style and convenience. Every corner of this property reflects excellent upkeep and attention to detail, making it move-in ready for its new owners. The open layout enhances natural light throughout the main living spaces, contributing to a warm and airy atmosphere. Whether you're hosting gatherings or enjoying quiet evenings at home, the blend of functionality and comfort in this residence ensures a superb living experience. Don't miss the opportunity to own a home that balances space, style, and excellent condition in a sought-after neighborhood.
-
2026-04-12price $265,000
-
2026-04-12price $265,000
-
2026-02-04$267,000 Active
-
2026-02-04$267,000 Active
-
2022-06-03soldstatus Sold
-
2022-03-31$262,460
-
2022-03-31$262,460
ⓘ Source: listings_history table (triggers on properties + properties_extension) + one-shot
backfill from property_details.listing_events for pre-trigger history.
Tax reassessment forecast LA · Resets to sale price
- Current annual tax
- $3,063 · $255/mo
- Projected year-2 tax
- $3,063 · $255/mo
- Expected delta
- $0/yr ($0/mo · 0.0%)
ⓘ Screening estimate from a state-policy table — verify with the county assessor before closing.
Climate risk First Street
- Flood 1/10 Low FEMA zone X (unshaded) · 0% chance over 30 yrs
- Wildfire 1/10 Low
- Heat 8/10 Severe 7 d/yr ≥108°F today · 20 d/yr by 30 yrs out
- Wind 9/10 Extreme 99% chance of damaging wind over 30 yrs
- Air quality 2/10 Low 1 unhealthy d/yr today · 2 by 30 yrs out
Nearby sold comps map
Loading sold comps map…
Walkable amenities ~0.75 mi
Loading nearby amenities…
Taxation est. · year 1
- Rental income
- $24,203
- − Mortgage interest
- −$14,844
- − Property taxes
- −$3,063
- − Insurance
- −$1,325
- − Repairs & maintenance
- −$1,936
- − Management
- −$1,936
- − HOA
- −$300
- − Depreciation
- −$7,709
- Taxable loss
- −$6,911
- Est. tax savings @ 24.0%
- +$1,659
- After-tax cash flow
- $-586/yr
For passive investors: Depreciation is non-cash, so a rental often shows a tax loss while cash-flowing — sheltering income. Rental losses are passive: they offset passive income freely, and up to $25,000/yr can offset ordinary (W-2) income if you actively participate and your MAGI is under $100k (phasing out to $0 by $150k); unused losses carry forward. On sale, claimed depreciation is recaptured at up to 25%, and gains may owe capital-gains tax (a 1031 exchange can defer both). Figures are a year-1 estimate at your 24.0% rate — not tax advice; consult a CPA.
Schools (NCES district)
- District
- Zachary Community School District
- NCES district ID
- 2200039
- Math proficiency
- 46% ▼ -38.00%
- Reading proficiency
- 60% ▼ -28.00%
- Median HH income
- $68,531
- Composite
- 46.99/100
- National rank
- #2349
- State rank
- #8 of 98 in LA
Livability — Zachary
- Score
- 69/100
- State rank
- #64
- US rank
- #8274
Category grades
Schools grade is shown separately in the Schools card above.
Census & demographics
- Census place
- Zachary, LA
- County
- East Baton Rouge Parish · 399,686 people
- City population
- 30,385
- Metro
- Baton Rouge, LA
- Population (ZIP)
- 30,385
- Household income
- $78,263
- Rent vs Own
- Severe rent burden
- 718.0
Population outlook (East Baton Rouge County) Hauer SSP2
- Today (2025)
- 464,810 people
- By 2030
- 472,137 · +1.6%
- By 2040
- 480,243 · +3.3%
- By 2050
- 484,422 · +4.2%
- By 2075
- 492,069 · +5.9%
- By 2100
- 476,347 · +2.5%
Race, ethnicity, and origin ACS 2023
- Neighborhood character
- Diverse neighborhood (Simpson 0.55)
- Race & ethnicity
- White 53% Black 41% Two or more races 4% Hispanic / Latino 2% Asian 2%
- Common ancestry
- Lithuanian 6% Italian 2% Slovak 1%
- Foreign-born
- 2% · Canada
- Languages at home
- 96% English-only · Spanish 1% German/W. Germanic 1% French/Haitian/Cajun 1%
Political lean MEDSL · East Baton Rouge
- 2024 margin
- D (+11.1) · D 54.5% · R 43.4% · Other 2.1%
- 2008→2024 swing
- +8.9pp toward D · 2008: 2.2pp · 2024: 11.1pp
- All cycles
- 2024: D+11.1 2020: D+13.1 2016: D+9.2 2012: D+5.2 2008: D+2.2
Not yet ingested
- Civics
- —
Market trends
- HPI YoY
- ▼ -47.01%
- Current HPI
- 170.2143
- Rent YoY
- ▲ 4.18%
- Metro
- Baton Rouge, LA
- State GDP YoY
- ▲ 3.29%
- F500 in state
- 10
Industry mix (Fortune 500 HQ in LA)
| Industry | F500 HQs | Revenue |
|---|---|---|
| Telecommunications | 2 | $23B |
|
||
| Utilities | 1 | $12B |
|
||
| Wholesale / Distribution | 1 | $5B |
|
||
| Advertising | 1 | $2B |
|
||
Price history
+1.0% since first listed9 events — show timeline
- 2026-05-19 Listed $265,000 GBRMLS
- 2026-05-19 Listed $265,000 AcadianaMLS
- 2026-04-12 Price Changed $265,000 AcadianaMLS
- 2026-04-12 Price Changed $265,000 GBRMLS
- 2026-02-04 Listed $267,000 AcadianaMLS
- 2026-02-04 Listed $267,000 GBRMLS
- 2022-06-03 Sold (MLS) — GBRMLS
- 2022-03-31 Listed $262,460 AcadianaMLS
- 2022-03-31 Listed $262,460 GBRMLS
Property tax history
+49.0%/yrLatest (2025): $3,063 · -2.8% YoY. Source: county tax records.
Cash-flow waterfall
monthlySold comps — $/sqft
last 12 mo · ≤1 miLoading sold comps…