606 Niagara St · Holden, MO
Flood risk 1/10 · Minimal
- FEMA flood zone
- X (unshaded)
- Chance of flooding over 30 yrs
- 0.0%
- Est. flood insurance / yr
- $507 – $1,088
Fire risk 3/10 · Minor
- Est. fire insurance / yr
- $1,054 – $1,958
Heat risk 4/10 · Minor
- Hot days now (above 107°F)
- 7 days/yr
- Hot days in 30 yrs
- 17 days/yr
Wind risk 2/10 · Minimal
- Chance of severe wind over 30 yrs
- 1.0%
Air-quality risk 1/10 · Minimal
- Unhealthy air days now
- 0 days/yr
- Unhealthy air days in 30 yrs
- 0 days/yr
Risk factors via First Street. Map © Google.
Why this score? — see what drove the D grade
The composite is a weighted blend of 9 inputs, each scored 0–100. Each bar is that input's sub-score; the figure is the points it added to the 100-point composite (weight × sub-score).
- Appreciation +10.0/10.0
- Cash flow +8.6/30.0
- ARV discount +7.5/15.0
- Livability +3.5/5.0
- Schools +3.2/10.0
- Rent growth +2.5/5.0
- Condition / age +2.5/5.0
- DSCR +2.4/10.0
- 1% rule +1.3/10.0
$139,900
🖨 Deal sheet 📄 Offer letter ✓ Due diligence
Listing remarks MLS
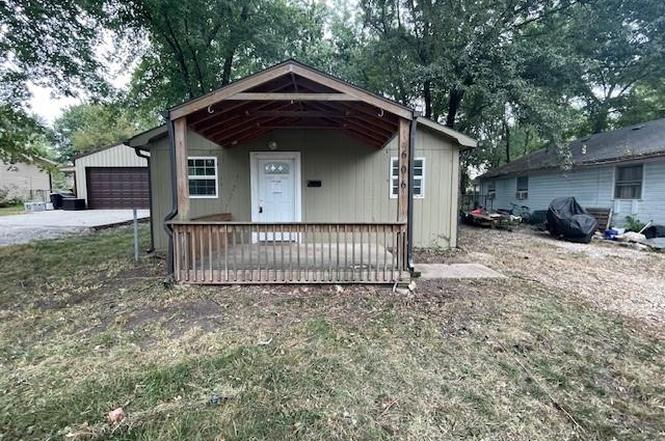
Welcome to 606 Niagara Street - a hidden gem with tons of potential in the heart of Holden. This 2-bedroom, 1-bathroom bungalow sits on a generously sized lot in a quiet, established neighborhood. Whether you're an investor looking for your next project, a first-time buyer ready to build equity, or a seasoned homeowner looking for a home you can truly make your own, this property offers a fantastic opportunity at an affordable price. Step inside to discover a functional floor plan with classic charm. The living space is filled with natural light, and the two bedrooms offer comfortable layouts. The kitchen and bathroom are ready for updates, giving you a blank canvas to create a space that suits your style and needs. Outside, the large yard provides ample space for gardening, outdoor entertaining, or even future expansion. There's plenty of room to add a garage, shed, or create a peaceful backyard retreat. While the home does need work, it offers solid bones, making it the ideal candidate for a renovation project. Whether you're planning to update and resell, rent, or live in it yourself, the possibilities are endless. Property Highlights: 2 bedrooms / 1 full bathroom Classic bungalow layout with original charm Spacious lot with mature trees Quiet residential street Affordable price point with room to add value Sold AS-IS - bring your ideas and your toolbox Located just minutes from local schools, parks, and downtown Holden amenities, this home is perfectly positioned for convenience and quiet living. Don't miss your chance to transform this property into something special. Schedule your showing today and imagine the possibilities!
Key facts
- Updated bungalow
- Inviting front porch
- New flooring
Tags
Property features AI
Exterior
- Parking: Off-street parking
- Utilities: Public water
- Home design: Single-family residence; Residential property; Bungalow style
- Construction: Board & batten siding; Composition roof; Property age: 51–75 years
- Exterior features: Lot approximately 4,200 square feet; Not in a flood plain
Interior
- Bedrooms: 2 bedrooms
- Bathrooms: 1 full bathroom
- Heating & cooling: Electric heating; Electric cooling (has cooling)
- Interior features: Bungalow floor plan; Crawl space basement
Neighborhood map
What this means for you Summary
Snapshot
- This is a 2-bed/1.0-bath other listed at $140k.
Deal economics
- At list price, monthly cash flow is $-121 ($-1k/yr) — negative.
- To cash-flow at today's rent, offer at most $119k (15.2% below list).
- To meet the 1% rule (rent ≥ 1% of price), the offer needs to be $88k (36.8% below list).
- Recommended offer: $88k (36.8% below list) — sets the bar for 1% rule.
- Cap rate 5.3% vs local median 2.6% in Holden — top-decile yield for the area; either an underpriced asset or a hidden risk that comps aren't pricing in. Stress-test before assuming the spread holds.
Location & tenants
- Location reads 69/100 on livability (#167 in MO) — a middle-class / working-renter tenant base. Strengths: cost of living A+, housing A+, crime A-; Watch: employment D+, schools F, amenities F.
- Holden R-III (rural): math 33% / reading 41% proficiency, ranked #176 of 324 in MO (top 54%) — families likely to look elsewhere, expect single-tenant / working-renter base with shorter leases.
- Market conditions: 75 active listings in the ZIP; 80 units permitted in Johnson County in 2024 (27 in 5+ unit buildings).
Forward outlook
- In year one you build about $15k of equity ($967 loan paydown + $14k appreciation (10.0% local appreciation)).
- Johnson County population projected at +6% by 2050 — modest demand growth; plan on rents tracking national, not racing it.
- By year 3, paydown + projected appreciation supports a ~$38k cash-out refi (75% LTV) — recoverable capital for the next deal without selling this one.
Negotiation context
- Only 1 days on market — expect competitive offers; lowballing is unlikely to land.
- 5 sale attempts since 9y ago; this cycle's ask is 75% above the opening price — seller raised mid-cycle; expect resistance to lowballs.
Questions for the listing agent
- What do current leases actually rent for vs. the listed asking? Can we see a recent rent roll and the last 12 months of T-12 income?
- Built in 1971 — when were the roof, HVAC, electrical panel, plumbing, and water heater last replaced?
- Is there a deadline driving the sale (1031 exchange, divorce, estate, relocation)? That informs how much negotiation room exists.
- Schools are F-rated, which usually means shorter tenancies and higher turnover. Who's the typical renter profile here, and what's been the actual vacancy rate?
- The area grade is low — what's the realistic commute time and amenity access for the typical tenant pool here? Any planned neighborhood developments (good or bad) we should know about?
- What's the average days-on-market for RENTAL listings here right now (not sales)? A rising rental-DOM trend means longer vacancies and softer asking-rent achievability than the comps imply.
- What's the recent tenant-quality profile in this submarket — average credit score on applications, eviction rate, late-payment / NSF rate, and stable-employment percentage? A property-management company in the area should have these aggregated.
- How much new for-sale + rental construction is in the pipeline within 1–3 miles? Heavy new supply typically softens prices + rents 12–24 months out; constrained supply supports both.
Investment metrics
- 1% rule
- 0.63% ✗
- Cap rate
- 5.26%
- Cash-on-cash
- -3.70%
- DSCR
- 0.84
- GRM
- 13.2
CMA / ARV
No comps found within radius.
Projected returns pro-forma
10.0% appreciation · 3.0% rent growth · sell at horizon
- IRR
- 21.6%
- Equity multiple
- 2.75×
- Total profit
- $68,433
- Equity at exit
- $126,033
- IRR
- 19.5%
- Equity multiple
- 6.29×
- Total profit
- $207,411
- Equity at exit
- $271,795
Cash invested: $39,172 (down + closing). Projections, not guarantees.
Landlord ↔ Tenant lean methodology
- Overall (STATE)
- 81 Strongly Landlord-Friendly
- State Missouri
- 81 Strongly Landlord-Friendly · R+10
- County
- — inherits STATE
- City
- — inherits STATE
ZIP-level market 64040
- Home prices YoY
- 6.2%
- Active inventory
- 75
- Price-to-rent
- 13.2×
Monthly cashflow live
- Estimated rent
- $884 medium interval (Pro) →
- Mortgage (P&I)
- −$734
- Tax from tax record
- −$27 /mo · $323/yr
- Insurance
- −$58
- HOA
- −$0
- Vacancy / Maint / Mgmt
- −$186
- Net cashflow
- $-121
Break-even live
UW: 25.0% down · 7.5% · 30yr · 1.5% tax · 5.0% vac · 8.0% maint · 8.0% mgmt
Financing live
Cash to close
- Down payment
- $34,975
- Closing costs
- $4,197
- Reserves months
- —
- Total cash needed
- —
Loan-product check · same deal, 3 products live
Conventional
25% down · 7.5% · 30yr
- Down + closing
- —
- Monthly P&I
- —
- Monthly cashflow
- —
- DSCR
- —
- Eligible?
- —
Personal DTI + credit; lowest rate.
DSCR
20% down · 8.5% · 30yr
- Down + closing
- —
- Monthly P&I
- —
- Monthly cashflow
- —
- DSCR
- —
- Eligible?
- —
No personal income docs; deal must DSCR.
Hard money
10% down · 12.0% · 12mo
- Down + closing
- —
- Monthly P&I
- —
- Monthly cashflow
- —
- DSCR
- —
- Eligible?
- —
Short-term bridge; refi at stabilization.
Listing history 3 events
-
2026-06-18status $139,900 Active 1 DOM
-
2026-06-18remarks 572-char remark
-
2026-06-18$139,900 Coming Soon 1 DOM
ⓘ Source: listings_history table (triggers on properties + properties_extension) + one-shot
backfill from property_details.listing_events for pre-trigger history.
Tax reassessment forecast MO · Resets to sale price
- Current annual tax
- $323 · $27/mo
- Projected year-2 tax
- $1,357 · $113/mo
- Expected delta
- +$1,034/yr (+$86/mo · 319.5%)
ⓘ Screening estimate from a state-policy table — verify with the county assessor before closing.
Climate risk First Street
- Flood 1/10 Low FEMA zone X (unshaded) · 0% chance over 30 yrs
- Wildfire 3/10 Moderate
- Heat 4/10 Moderate 7 d/yr ≥107°F today · 17 d/yr by 30 yrs out
- Wind 2/10 Low 100% chance of damaging wind over 30 yrs
- Air quality 1/10 Low 0 unhealthy d/yr today · 0 by 30 yrs out
Nearby sold comps map
Loading sold comps map…
Walkable amenities ~0.75 mi
Loading nearby amenities…
Taxation est. · year 1
- Rental income
- $10,607
- − Mortgage interest
- −$7,837
- − Property taxes
- −$323
- − Insurance
- −$700
- − Repairs & maintenance
- −$849
- − Management
- −$849
- − Depreciation
- −$4,070
- Taxable loss
- −$4,020
- Est. tax savings @ 24.0%
- +$965
- After-tax cash flow
- $-483/yr
For passive investors: Depreciation is non-cash, so a rental often shows a tax loss while cash-flowing — sheltering income. Rental losses are passive: they offset passive income freely, and up to $25,000/yr can offset ordinary (W-2) income if you actively participate and your MAGI is under $100k (phasing out to $0 by $150k); unused losses carry forward. On sale, claimed depreciation is recaptured at up to 25%, and gains may owe capital-gains tax (a 1031 exchange can defer both). Figures are a year-1 estimate at your 24.0% rate — not tax advice; consult a CPA.
Schools (NCES district)
- District
- Holden R-III
- NCES district ID
- 2914490
- Math proficiency
- 33% ▲ 2.00%
- Reading proficiency
- 41% ▲ 1.00%
- Median HH income
- $53,033
- Composite
- 32.27/100
- National rank
- #5759
- State rank
- #176 of 324 in MO
Livability — Holden
- Score
- 69/100
- State rank
- #167
- US rank
- #8986
Category grades
Schools grade is shown separately in the Schools card above.
Census & demographics
- Census place
- Holden, MO
- City population
- 5,968
- Population (ZIP)
- 5,968
Population outlook (Johnson County) Hauer SSP2
- Today (2025)
- 55,794 people
- By 2030
- 56,861 · +1.9%
- By 2040
- 58,239 · +4.4%
- By 2050
- 59,168 · +6.0%
- By 2075
- 62,222 · +11.5%
- By 2100
- 60,118 · +7.7%
Race, ethnicity, and origin ACS 2023
- Neighborhood character
- Predominantly White (92%)
- Race & ethnicity
- White 92% Two or more races 6% Hispanic / Latino 4%
- Common ancestry
- Iranian 6% Italian 2% Portuguese 2%
- Foreign-born
- 2% · Canada
- Languages at home
- 96% English-only · Spanish 3%
Political lean MEDSL · Johnson
- 2024 margin
- Solid R (+39.6) · D 29.5% · R 69.1% · Other 1.4%
- 2008→2024 swing
- -27.3pp toward R · 2008: -12.2pp · 2024: -39.6pp
- All cycles
- 2024: R+39.6 2020: R+36.8 2016: R+36.9 2012: R+24.2 2008: R+12.2
Not yet ingested
- Civics
- —
Market trends
- HPI YoY
- ▲ 19.92%
- Current HPI
- 342.75
- Rent YoY
- —
- Metro
- —
- State GDP YoY
- ▲ 1.84%
- F500 in state
- 20
Industry mix (Fortune 500 HQ in MO)
| Industry | F500 HQs | Revenue |
|---|---|---|
| Healthcare | 1 | $163B |
|
||
| Insurance | 1 | $21B |
|
||
| Industrial Technology | 1 | $17B |
|
||
| Retail | 1 | $16B |
|
||
| Industrial Distribution | 1 | $10B |
|
||
| Utilities | 1 | $9B |
|
||
Price history
+838.9% since first listed24 events — show timeline
- 2026-06-18 Coming Soon $139,900 Heartland MLS as Distributed by MLS Grid
- 2026-05-14 Sold (MLS) — Heartland MLS as Distributed by MLS Grid
- 2026-04-28 Pending — Heartland MLS as Distributed by MLS Grid
- 2026-04-24 Listing Removed — Heartland MLS as Distributed by MLS Grid
- 2026-03-30 Pending — Heartland MLS as Distributed by MLS Grid
- 2026-03-07 Price Changed $59,900 Heartland MLS as Distributed by MLS Grid
- 2026-01-07 Price Changed $69,900 Heartland MLS as Distributed by MLS Grid
- 2025-10-17 Price Changed $74,900 Heartland MLS as Distributed by MLS Grid
- 2025-09-18 Listed $79,900 Heartland MLS as Distributed by MLS Grid
- 2022-03-30 Sold (Public Records) — Public Records
- 2022-03-29 Sold (MLS) — Heartland MLS as Distributed by MLS Grid
- 2022-02-10 Pending — Heartland MLS as Distributed by MLS Grid
- 2022-02-04 Listed $110,000 Heartland MLS as Distributed by MLS Grid
- 2019-07-29 Sold (Public Records) — Public Records
- 2019-07-09 Sold (MLS) — Heartland MLS as Distributed by MLS Grid
- 2019-06-05 Pending — Heartland MLS as Distributed by MLS Grid
- 2019-06-05 Relisted — Heartland MLS as Distributed by MLS Grid
- 2018-02-13 Pending — Heartland MLS as Distributed by MLS Grid
- 2018-01-03 Contingent — Heartland MLS as Distributed by MLS Grid
- 2018-01-03 Pending — Heartland MLS as Distributed by MLS Grid
- 2017-12-12 Listed $69,000 Heartland MLS as Distributed by MLS Grid
- 2017-02-01 Sold (MLS) — Heartland MLS as Distributed by MLS Grid
- 2017-01-24 Pending — Heartland MLS as Distributed by MLS Grid
- 2017-01-18 Listed $14,900 Heartland MLS as Distributed by MLS Grid
Property tax history
+1.5%/yrLatest (2025): $323 · +8.2% YoY. Source: county tax records.
Cash-flow waterfall
monthlySold comps — $/sqft
last 12 mo · ≤1 miLoading sold comps…