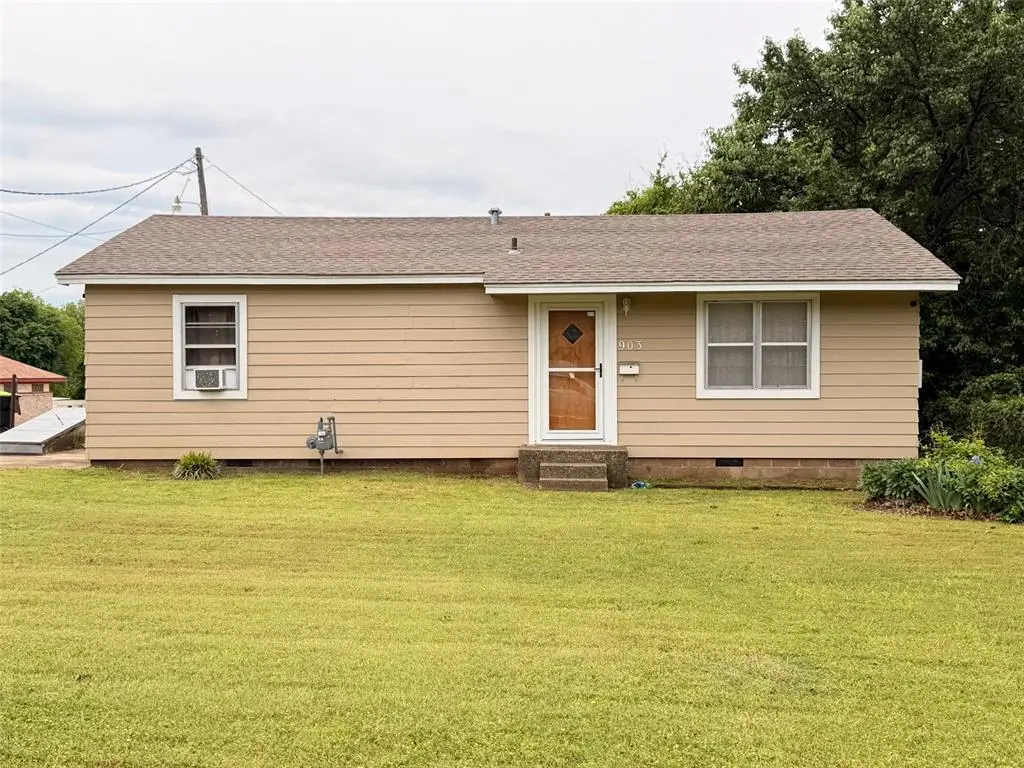
903 E Seminole St · Wynnewood, OK
Flood risk 1/10 · Minimal
- FEMA flood zone
- X (unshaded)
- Chance of flooding over 30 yrs
- 0.0%
- Est. flood insurance / yr
- $507 – $1,088
Fire risk 6/10 · Moderate
- Est. fire insurance / yr
- $2,463 – $4,575
Heat risk 6/10 · Moderate
- Hot days now (above 109°F)
- 7 days/yr
- Hot days in 30 yrs
- 19 days/yr
Wind risk 4/10 · Minor
- Chance of severe wind over 30 yrs
- 9.0%
Air-quality risk 2/10 · Minimal
- Unhealthy air days now
- 0 days/yr
- Unhealthy air days in 30 yrs
- 1 days/yr
Risk factors via First Street. Map © Google.
Why this score? — see what drove the B+ grade
The composite is a weighted blend of 9 inputs, each scored 0–100. Each bar is that input's sub-score; the figure is the points it added to the 100-point composite (weight × sub-score).
- Cash flow +29.1/30.0
- ARV discount +15.0/15.0
- DSCR +10.0/10.0
- Appreciation +8.9/10.0
- 1% rule +6.8/10.0
- Livability +3.1/5.0
- Rent growth +2.5/5.0
- Condition / age +2.5/5.0
- Schools +1.5/10.0
$80,000
🖨 Deal sheet 📄 Offer letter ✓ Due diligence
Listing remarks
Welcome to this adorable 2 bed, 1 bath home in the heart of Wynnewood! This little gem blends comfort, affordability, and convivence. Step inside with us and you will find large open spaces; flooring consists of laminate and beautiful original wood, and a primary bath that has been completely updated with a step-in shower and space for the washer and dryer. Enjoy the large open living room paired with a roomy kitchen and plenty of space for dining and gathering. Two spacious bedrooms with hard wood flooring make this home feel warm and cozy. If you love to sit outside on a warm summer evening and watch the world go by, you won't want to miss the adorable little back deck overlooking the spa
Key facts
- Spacious backyard
- Updated primary bath
- Back deck
Tags
Property features AI
Finance
- Other: Property listed active and vacant; Living area reported as 1,040 (assessor)
- Financial info: Listing offered as-is; financing accepted: cash and conventional; Loan qualification: Yes
- HOA & community: No mandatory association dues
Exterior
- Parking: Parking details not provided
- Security: Security details not provided
- Utilities: Utilities details not provided
- Home design: Single-family residence; One story; Existing property; Homestead exempt
- Construction: Frame construction; Composition roof; Conventional foundation; Below-ground storm shelter; Built status: Existing
- Exterior features: Covered porch; Outbuildings; Combination fencing; Interior lot
Interior
- Kitchen: Free-standing electric range and oven
- Bedrooms: 2 bedrooms
- Flooring: Laminate flooring; Wood flooring
- Bathrooms: 1 full bathroom
- Heating & cooling: Heating: Other; Cooling: Window unit(s)
- Interior features: Water heater; No fireplace; One living area; One dining area
- Laundry & utility: Laundry/utility details not provided
Neighborhood map
What this means for you Summary
Snapshot
- This is a 2-bed/1.0-bath single-family listed at $80k.
Deal economics
- At list price, monthly cash flow is $276 ($3k/yr) — positive.
- The deal already cash-flows at list — no discount required.
- Meets the 1% rule at list price ($948 rent vs $80k).
- Recommended offer: $79k (1.5% below list) — sets the bar for market timing.
- Cap rate 10.4% vs local median 5.9% in Wynnewood — top-decile yield for the area; either an underpriced asset or a hidden risk that comps aren't pricing in. Stress-test before assuming the spread holds.
Location & tenants
- Location reads 62/100 on livability (#253 in OK) — a middle-class / working-renter tenant base. Strengths: cost of living A+, housing A+; Watch: employment D, amenities F, commute F.
- Wynnewood (rural): math 13% / reading 22% proficiency, ranked #198 of 270 in OK (top 73%) — low school quality limits family demand, transient renter base, plan for 1-2y turnover.
- Zoned schools: Central Es (math 17% / reading 27%, grade F, #413 of 845 statewide, top 54%, 277 students, 0% FRL); Wynnewood Hs (math 5% / reading 24%, grade F, #332 of 447 statewide, top 78%, 210 students, 0% FRL) — zoned schools average 0% FRL vs 51% district-wide (51 pts lower); this property's tenant base skews higher-income than the district average.
- Market conditions: 55 active listings in the ZIP; 1 units permitted in Garvin County in 2024 (0 in 5+ unit buildings).
Forward outlook
- In year one you build about $7k of equity ($553 loan paydown + $6k appreciation (7.9% local appreciation)).
- Garvin County population projected at +8% by 2050 — modest demand growth; plan on rents tracking national, not racing it.
- At projected returns (7.9% appreciation + 3.0% rent growth), your $22k cash investment doubles in ~3 years — after that, you're playing with house money.
- By year 5, paydown + projected appreciation supports a ~$31k cash-out refi (75% LTV) — recoverable capital for the next deal without selling this one.
Negotiation context
- It's been on market 22 days — a 2% lower offer ($79k) is reasonable based on typical stale-listing flexibility.
- Current owner paid $30k; list at $80k implies a 167% gain — meaningful room to come down on a strong offer.
Risks & watch-outs
- Climate carrying-cost: major wildfire risk; extreme-heat days projected 7→19/yr by 2055 (HVAC capex compounding) — expect insurance premiums to compound above CPI over the hold.
Questions for the listing agent
- Built in 1960 — when were the roof, HVAC, electrical panel, plumbing, and water heater last replaced?
- Is there a deadline driving the sale (1031 exchange, divorce, estate, relocation)? That informs how much negotiation room exists.
- Schools are F-rated, which usually means shorter tenancies and higher turnover. Who's the typical renter profile here, and what's been the actual vacancy rate?
- What's the average days-on-market for RENTAL listings here right now (not sales)? A rising rental-DOM trend means longer vacancies and softer asking-rent achievability than the comps imply.
- What's the recent tenant-quality profile in this submarket — average credit score on applications, eviction rate, late-payment / NSF rate, and stable-employment percentage? A property-management company in the area should have these aggregated.
- How much new for-sale + rental construction is in the pipeline within 1–3 miles? Heavy new supply typically softens prices + rents 12–24 months out; constrained supply supports both.
Investment metrics
- 1% rule
- 1.18% ✓
- Cap rate
- 10.43%
- Cash-on-cash
- 14.79%
- DSCR
- 1.66
- GRM
- 7.0
CMA / ARV
- ARV (on-the-fly)
- $99,840
- Comps found
- 6
Show comp detail 6 sales within ~0.75 mi
| Address | Dist | Beds/Ba | Sqft | Sold | Price | $/sf | Match |
|---|---|---|---|---|---|---|---|
| 1006 E Chickasaw | 0.18mi | 2/1.0 | 981 (-6%) | 8mo | $43,000 | $44 | 76 |
| 607 E Allen St | 0.48mi | 2/1.0 | 1,176 (+13%) | 7mo | $25,000 | $21 | 50 |
| 403 S Howell Ave | 0.27mi | 3/2.0 (+1) | 1,120 (+8%) | 22mo | $108,000 | $96 | 47 |
| 607 E Colbert Dr | 0.25mi | 2/2.0 | 912 (-12%) | 22mo | $130,000 | $143 | 46 |
| 1403 E Jennings St | 0.38mi | 3/1.0 (+1) | 1,146 (+10%) | 22mo | $147,000 | $128 | 42 |
| 201 E Lawrence St | 0.59mi | 1/1.0 (-1) | 984 (-5%) | 24mo | $45,000 | $46 | 39 |
Match score weights: distance 35% · size 25% · config 20% · recency 20%. Top-matched comps best support the ARV.
Projected returns pro-forma
7.9% appreciation · 3.0% rent growth · sell at horizon
- IRR
- 31.3%
- Equity multiple
- 3.23×
- Total profit
- $49,985
- Equity at exit
- $60,229
- IRR
- 28.0%
- Equity multiple
- 6.89×
- Total profit
- $131,875
- Equity at exit
- $119,035
Cash invested: $22,400 (down + closing). Projections, not guarantees.
Landlord ↔ Tenant lean methodology
- Overall (STATE)
- 83 Strongly Landlord-Friendly
- State Oklahoma
- 83 Strongly Landlord-Friendly · R+20
- County
- — inherits STATE
- City
- — inherits STATE
ZIP-level market 73098
- Home prices YoY
- 2.9%
- Active inventory
- 55
- Price-to-rent
- 7.0×
Monthly cashflow live
- Estimated rent
- $948 medium interval (Pro) →
- Mortgage (P&I)
- −$420
- Tax from tax record
- −$20 /mo · $237/yr
- Insurance
- −$33
- HOA
- −$0
- Vacancy / Maint / Mgmt
- −$199
- Net cashflow
- $276
Break-even live
UW: 25.0% down · 7.5% · 30yr · 1.5% tax · 5.0% vac · 8.0% maint · 8.0% mgmt
Financing live
Cash to close
- Down payment
- $20,000
- Closing costs
- $2,400
- Reserves months
- —
- Total cash needed
- —
Loan-product check · same deal, 3 products live
Conventional
25% down · 7.5% · 30yr
- Down + closing
- —
- Monthly P&I
- —
- Monthly cashflow
- —
- DSCR
- —
- Eligible?
- —
Personal DTI + credit; lowest rate.
DSCR
20% down · 8.5% · 30yr
- Down + closing
- —
- Monthly P&I
- —
- Monthly cashflow
- —
- DSCR
- —
- Eligible?
- —
No personal income docs; deal must DSCR.
Hard money
10% down · 12.0% · 12mo
- Down + closing
- —
- Monthly P&I
- —
- Monthly cashflow
- —
- DSCR
- —
- Eligible?
- —
Short-term bridge; refi at stabilization.
Listing history 3 events
-
2026-05-19price $80,000
-
2026-05-02$85,000 Active
-
2020-10-29soldstatus $30,000
ⓘ Source: listings_history table (triggers on properties + properties_extension) + one-shot
backfill from property_details.listing_events for pre-trigger history.
Tax reassessment forecast OK · Resets to sale price
- Current annual tax
- $237 · $20/mo
- Projected year-2 tax
- $720 · $60/mo
- Expected delta
- +$483/yr (+$40/mo · 203.8%)
ⓘ Screening estimate from a state-policy table — verify with the county assessor before closing.
Climate risk First Street
- Flood 1/10 Low FEMA zone X (unshaded) · 0% chance over 30 yrs
- Wildfire 6/10 Major
- Heat 6/10 Major 7 d/yr ≥109°F today · 19 d/yr by 30 yrs out
- Wind 4/10 Moderate 9% chance of damaging wind over 30 yrs
- Air quality 2/10 Low 0 unhealthy d/yr today · 1 by 30 yrs out
Nearby sold comps map
Loading sold comps map…
Walkable amenities ~0.75 mi
Loading nearby amenities…
Taxation est. · year 1
- Rental income
- $11,372
- − Mortgage interest
- −$4,481
- − Property taxes
- −$237
- − Insurance
- −$400
- − Repairs & maintenance
- −$910
- − Management
- −$910
- − Depreciation
- −$2,327
- Taxable income
- $2,107
- Est. tax owed @ 24.0%
- −$506
- After-tax cash flow
- $2,807/yr
For passive investors: Depreciation is non-cash, so a rental often shows a tax loss while cash-flowing — sheltering income. Rental losses are passive: they offset passive income freely, and up to $25,000/yr can offset ordinary (W-2) income if you actively participate and your MAGI is under $100k (phasing out to $0 by $150k); unused losses carry forward. On sale, claimed depreciation is recaptured at up to 25%, and gains may owe capital-gains tax (a 1031 exchange can defer both). Figures are a year-1 estimate at your 24.0% rate — not tax advice; consult a CPA.
Schools (NCES district)
- District
- Wynnewood
- NCES district ID
- 4033300
- Math proficiency
- 13% ▼ -7.00%
- Reading proficiency
- 22% ▼ -2.00%
- Median HH income
- $42,075
- Composite
- 15.05/100
- National rank
- #9352
- State rank
- #198 of 270 in OK
Livability — Wynnewood
- Score
- 62/100
- State rank
- #253
- US rank
- #16754
Category grades
Schools grade is shown separately in the Schools card above.
Census & demographics
- Census place
- Wynnewood, OK
- Population (ZIP)
- 3,382
Population outlook (Garvin County) Hauer SSP2
- Today (2025)
- 28,277 people
- By 2030
- 28,619 · +1.2%
- By 2040
- 29,478 · +4.2%
- By 2050
- 30,384 · +7.5%
- By 2075
- 34,074 · +20.5%
- By 2100
- 36,099 · +27.7%
Race, ethnicity, and origin ACS 2023
- Neighborhood character
- Predominantly White (74%)
- Race & ethnicity
- White 74% Two or more races 14% Hispanic / Latino 9% Native American 3% Black 2%
- Hispanic origin (detail)
- Mexican 8%
- Common ancestry
- Slovak 3% European 3% Serbian 2%
- Foreign-born
- 4% · Canada
- Languages at home
- 96% English-only · Spanish 3% German/W. Germanic 1%
Political lean MEDSL · Garvin
- 2024 margin
- Solid R (+66.1) · D 16.4% · R 82.5% · Other 1.1%
- 2008→2024 swing
- -22.5pp toward R · 2008: -43.6pp · 2024: -66.1pp
- All cycles
- 2024: R+66.1 2020: R+64.2 2016: R+60.7 2012: R+46.1 2008: R+43.6
Not yet ingested
- Civics
- —
Market trends
- HPI YoY
- ▲ 7.90%
- Current HPI
- 280.5166
- Rent YoY
- —
- Metro
- —
- State GDP YoY
- ▲ 1.55%
- F500 in state
- 6
Industry mix (Fortune 500 HQ in OK)
| Industry | F500 HQs | Revenue |
|---|---|---|
| Energy | 3 | $48B |
|
||
Price history
+166.7% since first listed3 events — show timeline
- 2026-05-19 Price Changed $80,000 MLSOK
- 2026-05-02 Listed $85,000 MLSOK
- 2020-10-29 Sold (Public Records) $30,000 Public Records
Property tax history
+11.7%/yrLatest (2025): $237 · +12.3% YoY. Source: county tax records.
Cash-flow waterfall
monthlySold comps — $/sqft
last 12 mo · ≤1 miLoading sold comps…