 Fourplex
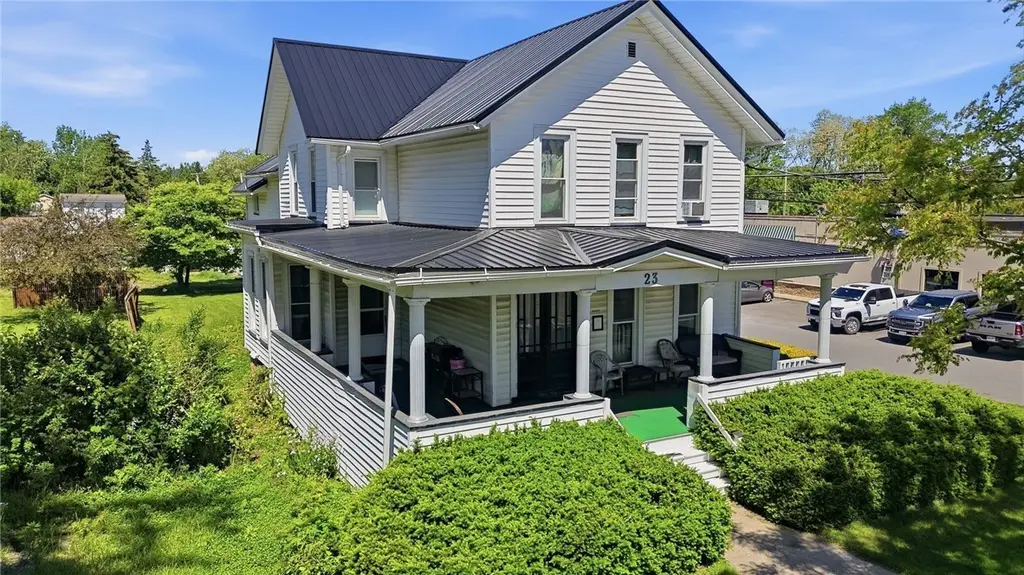
23 N Main St · Brockport, NY
Flood risk No data
- FEMA flood zone
- —
- Chance of flooding over 30 yrs
- —
- Est. flood insurance / yr
- —
Fire risk No data
- Est. fire insurance / yr
- —
Heat risk No data
- Hot days now (above threshold)
- —
- Hot days in 30 yrs
- —
Wind risk No data
- Chance of severe wind over 30 yrs
- —
Air-quality risk No data
- Unhealthy air days now
- —
- Unhealthy air days in 30 yrs
- —
Risk factors via First Street. Map © Google.
Why this score? — see what drove the B grade
The composite is a weighted blend of 9 inputs, each scored 0–100. Each bar is that input's sub-score; the figure is the points it added to the 100-point composite (weight × sub-score).
- Cash flow +30.0/30.0
- 1% rule +10.0/10.0
- DSCR +10.0/10.0
- ARV discount +7.5/15.0
- Schools +4.3/10.0
- Livability +3.7/5.0
- Rent growth +3.2/5.0
- Condition / age +2.5/5.0
- Appreciation +0.0/10.0
$474,900
🖨 Deal sheet 📄 Offer letter ✓ Due diligence
Multi-family units
County records classify this as Multi-Family (5+ Unit). Listing-text estimate: 4 units. estimate disagrees with records
5+ unit building — per-unit beds/baths from public records are typically unavailable; the breakdown below (if shown) is an estimate from the listing text.
Listing remarks MLS
Positive cash flow opportunity! All separate utilities and fully rented. C of O supplied. New water main installed 1012 from house to Street. Loads of parking and close to everything.
Key facts
- Metal roof
- Electrical panels
- Vinyl siding
Tags
Property features AI
Finance
- Financial info: Four total units with separate gas and electric meters for each unit; Operating expenses include structure maintenance, trash, and water; Owner pays grounds care, trash collection, and water; Current unit rents reported (examples): $830, $895, $940, $1,200
Exterior
- Parking: On-site parking available (one space)
- Utilities: High-speed internet available; Public water connected; Sewer connected; Circuit breaker electrical
- Home design: Two-story multi-family building; Resale property
- Construction: Metal roof; Vinyl siding
- Exterior features: Open porch
Interior
- Kitchen: Each unit includes oven/range and refrigerator
- Bedrooms: Four residential units (three 2-bed units and one 1-bed unit)
- Flooring: Carpet; Laminate; Vinyl; Varied flooring types
- Bathrooms: Five full bathrooms total across the building
- Heating & cooling: Gas forced-air heating
- Interior features: Ceiling fans; Storage space; Natural woodwork; Thermal windows
- Laundry & utility: Gas water heater
Neighborhood map
What this means for you Summary
Snapshot
- This is a 4 × 7-bed/5.0-bath units multifamily listed at $475k.
Deal economics
- At list price, monthly cash flow is $3k ($38k/yr) — positive. Per door: $788/mo.
- The deal already cash-flows at list — no discount required.
- Meets the 1% rule at list price ($8k rent vs $475k).
- Recommended offer: $468k (1.5% below list) — sets the bar for market timing.
- Cap rate 14.3% vs local median 5.1% in Brockport — top-decile yield for the area; either an underpriced asset or a hidden risk that comps aren't pricing in. Stress-test before assuming the spread holds.
Location & tenants
- Location reads 73/100 on livability (#313 in NY) — a middle-class / working-renter tenant base. Strengths: health & safety A+, cost of living A, housing A; Watch: employment D+, crime F, amenities F.
- Brockport Central School District (town): math 45% / reading 55% proficiency, ranked #369 of 590 in NY (top 62%) — acceptable for families but not a draw, mixed tenant base, ~2y average lease.
- Market conditions: Rents rising (+2.7%/yr); 79 active listings in the ZIP; solid renter incomes; 1,169 units permitted in Monroe County in 2024 (591 in 5+ unit buildings).
- At $8,274/mo this rent would consume 131% of the median local household income ($76k/yr) (locally 472% of renters already pay >50% of income on rent) — very limited rent-growth headroom before tenants either downsize or default.
Forward outlook
- Local home prices are declining (-3.0%/yr); year-one equity from $3k of loan paydown is wiped out by about $14k of value loss. Plan a longer hold.
- Monroe County population projected to shrink 6% by 2050 — rents likely to lag national; underwrite the cash flow, not the appreciation.
- At projected returns (-3.0% appreciation + 2.7% rent growth), your $133k cash investment doubles in ~5 years — after that, you're playing with house money.
Negotiation context
- It's been on market 16 days — a 2% lower offer ($468k) is reasonable based on typical stale-listing flexibility.
- 2 sale attempts since 13y ago with the ask held roughly flat each time — persistent listings suggest the price (not the market) is what's stuck; bring a comps-based counter.
- Current owner paid $164k; list at $475k implies a 190% gain — meaningful room to come down on a strong offer.
Risks & watch-outs
- Watch-outs: built in 1900 — expect roof / HVAC / electrical / plumbing capex.
Questions for the listing agent
- Can we see the unit-by-unit rent roll, current vacancy, and any below-market leases? What's the average tenancy length?
- What capital expenditures (roof, boiler, parking lot, exteriors) have been made in the last 5 years, and what's planned in the next 2?
- Built in 1900 — when were the roof, HVAC, electrical panel, plumbing, and water heater last replaced?
- Is there a deadline driving the sale (1031 exchange, divorce, estate, relocation)? That informs how much negotiation room exists.
- Schools are A-rated — typically a magnet for longer-tenancy family renters. What's the average tenant stay here, and is there a school-zone premium baked into asking?
- Crime grade is F in this area — have there been break-ins, vandalism, or insurance claims at this property in the last 3 years? What carrier currently insures it and at what premium?
- What's the average days-on-market for RENTAL listings here right now (not sales)? A rising rental-DOM trend means longer vacancies and softer asking-rent achievability than the comps imply.
- What's the recent tenant-quality profile in this submarket — average credit score on applications, eviction rate, late-payment / NSF rate, and stable-employment percentage? A property-management company in the area should have these aggregated.
- How much new apartment / multifamily construction is in the pipeline within 1–3 miles? Heavy new supply (>2% of stock underway) typically softens rents 12–24 months out; light construction supports rent growth.
Investment metrics
- 1% rule
- 1.74% ✓
- Cap rate
- 14.26%
- Cash-on-cash
- 28.44%
- DSCR
- 2.27
- GRM
- 4.8
CMA / ARV
No comps found within radius.
Projected returns pro-forma
-3.0% appreciation · 2.72% rent growth · sell at horizon
- IRR
- 22.4%
- Equity multiple
- 1.91×
- Total profit
- $121,646
- Equity at exit
- $70,809
- IRR
- 30.2%
- Equity multiple
- 3.67×
- Total profit
- $355,687
- Equity at exit
- $41,061
Cash invested: $132,972 (down + closing). Projections, not guarantees.
Landlord ↔ Tenant lean methodology
- Overall (STATE)
- 15 Strongly Tenant-Friendly
- State New York
- 15 Strongly Tenant-Friendly · D+10
- County
- — inherits STATE
- City
- — inherits STATE
ZIP-level market 14420
- Home prices YoY
- -10.6%
- Rents YoY
- 2.7%
- Active inventory
- 79
- Price-to-rent
- 19.1×
Monthly cashflow live
- Estimated rent
- $8,274 medium interval (Pro) →
- Mortgage (P&I)
- −$2,490
- Tax from tax record
- −$696 /mo · $8,357/yr
- Insurance
- −$198
- HOA
- −$0
- Vacancy / Maint / Mgmt
- −$1,738
- Net cashflow
- $3,152
Break-even live
4-unit breakdown (identical units grouped — click to expand)
| Units | Beds | Baths | Est. rent |
|---|---|---|---|
| 4× units | 7 | 5 | $8,276 |
| #1 | 7 | 5 | $2,069 |
| #2 | 7 | 5 | $2,069 |
| #3 | 7 | 5 | $2,069 |
| #4 | 7 | 5 | $2,069 |
| Total (4 units) | $8,274 | ||
UW: 25.0% down · 7.5% · 30yr · 1.5% tax · 5.0% vac · 8.0% maint · 8.0% mgmt
Financing live
Cash to close
- Down payment
- $118,725
- Closing costs
- $14,247
- Reserves months
- —
- Total cash needed
- —
Loan-product check · same deal, 3 products live
Conventional
25% down · 7.5% · 30yr
- Down + closing
- —
- Monthly P&I
- —
- Monthly cashflow
- —
- DSCR
- —
- Eligible?
- —
Personal DTI + credit; lowest rate.
DSCR
20% down · 8.5% · 30yr
- Down + closing
- —
- Monthly P&I
- —
- Monthly cashflow
- —
- DSCR
- —
- Eligible?
- —
No personal income docs; deal must DSCR.
Hard money
10% down · 12.0% · 12mo
- Down + closing
- —
- Monthly P&I
- —
- Monthly cashflow
- —
- DSCR
- —
- Eligible?
- —
Short-term bridge; refi at stabilization.
Listing history 12 events
-
2026-06-18days on market $474,900 Active 16 DOM
-
2026-06-17days on market $474,900 Active 15 DOM
-
2026-06-16days on market $474,900 Active 14 DOM
-
2026-06-15days on market $474,900 Active 13 DOM
-
2026-06-13days on market $474,900 Active 11 DOM
-
2026-06-13days on market $474,900 Active 10 DOM
-
2026-06-10days on market $474,900 Active 8 DOM
-
2026-06-09days on market $474,900 Active 7 DOM
-
2026-06-08days on market $474,900 Active 6 DOM
-
2026-06-07days on market $474,900 Active 5 DOM
-
2026-06-03remarks 699-char remark
-
2026-06-03$474,900 Active 1 DOM
ⓘ Source: listings_history table (triggers on properties + properties_extension) + one-shot
backfill from property_details.listing_events for pre-trigger history.
Tax reassessment forecast NY · Partial reset (capped growth)
- Current annual tax
- $8,357 · $696/mo
- Projected year-2 tax
- $8,357 · $696/mo
- Expected delta
- $0/yr ($0/mo · 0.0%)
ⓘ Screening estimate from a state-policy table — verify with the county assessor before closing.
Nearby sold comps map
Loading sold comps map…
Walkable amenities ~0.75 mi
Loading nearby amenities…
Taxation est. · year 1
- Rental income
- $99,288
- − Mortgage interest
- −$26,602
- − Property taxes
- −$8,357
- − Insurance
- −$2,374
- − Repairs & maintenance
- −$7,943
- − Management
- −$7,943
- − Depreciation
- −$13,815
- Taxable income
- $32,253
- Est. tax owed @ 24.0%
- −$7,741
- After-tax cash flow
- $30,080/yr
For passive investors: Depreciation is non-cash, so a rental often shows a tax loss while cash-flowing — sheltering income. Rental losses are passive: they offset passive income freely, and up to $25,000/yr can offset ordinary (W-2) income if you actively participate and your MAGI is under $100k (phasing out to $0 by $150k); unused losses carry forward. On sale, claimed depreciation is recaptured at up to 25%, and gains may owe capital-gains tax (a 1031 exchange can defer both). Figures are a year-1 estimate at your 24.0% rate — not tax advice; consult a CPA.
Schools (NCES district)
- District
- Brockport Central School District
- NCES district ID
- 3605580
- Math proficiency
- 45% ▼ -14.00%
- Reading proficiency
- 55% ▲ 1.00%
- Median HH income
- $55,571
- Composite
- 43.28/100
- National rank
- #3044
- State rank
- #369 of 590 in NY
Livability — Brockport
- Score
- 73/100
- State rank
- #313
- US rank
- #5216
Category grades
Schools grade is shown separately in the Schools card above.
Census & demographics
- Census place
- Brockport, NY
- County
- Monroe County · 674,131 people
- City population
- 20,375
- Metro
- Rochester, NY
- Population (ZIP)
- 20,375
- Household income
- $75,577
- Rent vs Own
- Severe rent burden
- 472.0
Population outlook (Monroe County) Hauer SSP2
- Today (2025)
- 759,460 people
- By 2030
- 757,154 · -0.3%
- By 2040
- 740,644 · -2.5%
- By 2050
- 714,443 · -5.9%
- By 2075
- 645,883 · -15.0%
- By 2100
- 547,084 · -28.0%
Race, ethnicity, and origin ACS 2023
- Neighborhood character
- Predominantly White (81%)
- Race & ethnicity
- White 81% Hispanic / Latino 7% Black 5% Two or more races 5% Asian 2%
- Hispanic origin (detail)
- Puerto Rican 3%
- Common ancestry
- Romanian 5% Lithuanian 2% Italian 2%
- Foreign-born
- 5% · Canada, China, South Korea
- Languages at home
- 90% English-only · Spanish 5% Other Indo-European 1% French/Haitian/Cajun 1%
Political lean MEDSL · Monroe
- 2024 margin
- D (+19.1) · D 59.5% · R 40.5%
- 2008→2024 swing
- +1.4pp toward D · 2008: 17.7pp · 2024: 19.1pp
- All cycles
- 2024: D+19.1 2020: D+21.0 2016: D+14.1 2012: D+17.4 2008: D+17.7
Not yet ingested
- Civics
- —
Market trends
- HPI YoY
- ▼ -31.08%
- Current HPI
- 261.3695
- Rent YoY
- ▲ 2.72%
- Metro
- Rochester, NY
- State GDP YoY
- ▲ 2.60%
- F500 in state
- 92
Industry mix (Fortune 500 HQ in NY)
| Industry | F500 HQs | Revenue |
|---|---|---|
| Financial Services | 10 | $950B |
|
||
| Consumer Goods | 9 | $162B |
|
||
| Insurance | 4 | $225B |
|
||
| Telecommunications | 2 | $144B |
|
||
| Pharmaceuticals | 2 | $112B |
|
||
| Media / Entertainment | 2 | $69B |
|
||
Price history
+407.9% since first listed5 events — show timeline
- 2026-06-02 Listed $474,900 UNYREIS
- 2013-06-14 Sold (MLS) $164,000 UNYREIS
- 2013-06-07 Sold (Public Records) $164,000 Public Records
- 2013-03-22 Listed $169,900 UNYREIS
- 2006-07-19 Sold (Public Records) $93,500 Public Records
Property tax history
-0.3%/yrLatest (2025): $8,357 · +0.5% YoY. Source: county tax records.
Cash-flow waterfall
monthlySold comps — $/sqft
last 12 mo · ≤1 miLoading sold comps…