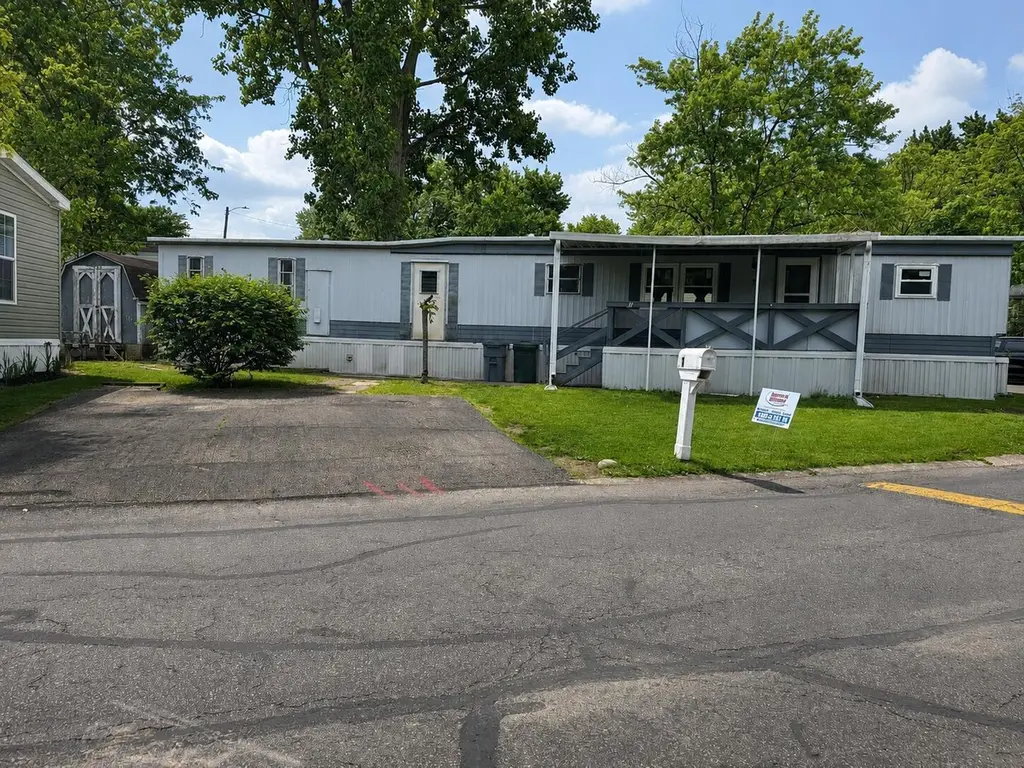
1 Estates Ln · Reynoldsburg, OH
Flood risk 1/10 · Minimal
- FEMA flood zone
- X (unshaded)
- Chance of flooding over 30 yrs
- 0.0%
- Est. flood insurance / yr
- $473 – $860
Fire risk 1/10 · Minimal
- Est. fire insurance / yr
- $713 – $1,323
Heat risk 3/10 · Minor
- Hot days now (above 98°F)
- 7 days/yr
- Hot days in 30 yrs
- 17 days/yr
Wind risk 2/10 · Minimal
- Chance of severe wind over 30 yrs
- 1.0%
Air-quality risk 2/10 · Minimal
- Unhealthy air days now
- 1 days/yr
- Unhealthy air days in 30 yrs
- 3 days/yr
Risk factors via First Street. Map © Google.
Why this score? — see what drove the B+ grade
The composite is a weighted blend of 9 inputs, each scored 0–100. Each bar is that input's sub-score; the figure is the points it added to the 100-point composite (weight × sub-score).
- Cash flow +30.0/30.0
- ARV discount +15.0/15.0
- 1% rule +10.0/10.0
- DSCR +10.0/10.0
- Livability +4.0/5.0
- Condition / age +4.0/5.0
- Schools +3.6/10.0
- Rent growth +3.0/5.0
- Appreciation +0.0/10.0
$45,000
🖨 Deal sheet (PDF) 📄 Offer letter ✓ Due diligence
Listing remarks
Welcome to this renovated 2-bedroom, 1-bath home in Reynoldsburg Estates offering thoughtful updates throughout and a functional layout with approximately 910 square feet of living space. Recent improvements include new flooring, fresh interior paint, updated bathroom with double vanity, new kitchen sink and faucet, replacement windows, and a brand-new HVAC system with central air for added comfort and peace of mind.
Key facts
- Double vanity
- Renovated
- New flooring
Tags
Property features AI
Finance
- Other: Located in Reynoldsburg Estates subdivision, Violet Township
- HOA & community: Homeowners association with monthly fee; Monthly association fee of $645; Community amenities include clubhouse, outdoor sports area and pool
Exterior
- Parking: Assigned parking
- Utilities: Public water; Public sewer
- Home design: Mobile/manufactured home (Other residential without deeded land); One story; Built in 1970; No common walls
- Construction: Built 1970; Slab foundation; Mobile/manufactured construction
- Exterior features: Shed(s) on property; Slab foundation; Mobile home dimensions approximately 60' x 12'
Interior
- Bedrooms: Two main-level bedrooms
- Flooring: Wood; Carpet; Vinyl
- Bathrooms: One full bathroom
- Heating & cooling: Central air and window units for cooling; Forced air heating
- Interior features: Approximately 910 finished living area; Wood, carpet and vinyl flooring
Neighborhood map
What this means for you Summary
Snapshot
- This is a 2-bed/1.0-bath single-family listed at $45k. Condition is rated good.
Deal economics
- At list price, monthly cash flow is $267 ($3k/yr) — positive.
- The deal already cash-flows at list — no discount required.
- Meets the 1% rule at list price ($2k rent vs $45k).
- Recommended offer: $44k (3.0% below list) — sets the bar for market timing.
- Cap rate 13.4% vs local median 4.4% in Reynoldsburg — top-decile yield for the area; either an underpriced asset or a hidden risk that comps aren't pricing in. Stress-test before assuming the spread holds.
Location & tenants
- Location reads 80/100 on livability (#124 in OH, #1,816 nationally) — a professional / high-income tenant draw. Strengths: commute A+, cost of living A+, housing A+; Watch: crime F, amenities F.
- Reynoldsburg City (suburban): math 32% / reading 50% proficiency, ranked #519 of 656 in OH (top 79%) — families likely to look elsewhere, expect single-tenant / working-renter base with shorter leases.
- Market conditions: Rents rising (+2.0%/yr); 183 active listings in the ZIP; 8 comparable units currently listed for rent nearby; rentals leasing fast (median 5d on market — plan ~1-2 weeks tenant-placement turnaround); 8,139 units permitted in Franklin County in 2024 (5,940 in 5+ unit buildings).
Forward outlook
- Local home prices are declining (-3.0%/yr); year-one equity from $311 of loan paydown is wiped out by about $1k of value loss. Plan a longer hold.
- Franklin County population projected at +34% by 2050 — long-run rental-demand tailwind backs the buy-and-hold thesis.
- At projected returns (-3.0% appreciation + 2.0% rent growth), your $13k cash investment doubles in ~6 years — after that, you're playing with house money.
Negotiation context
- It's been on market 37 days — a 3% lower offer ($44k) is reasonable based on typical stale-listing flexibility.
- 2 sale attempts with the ask held roughly flat each time — persistent listings suggest the price (not the market) is what's stuck; bring a comps-based counter.
- Current owner paid $14k; list at $45k implies a 210% gain — meaningful room to come down on a strong offer.
Risks & watch-outs
- Watch-outs: HOA is 42% of rent.
Questions for the listing agent
- It's been on market 37 days. Have you received any prior offers? Is the seller open to a 3% concession, seller financing, or rate buy-down credit?
- Built in 1970 — when were the roof, HVAC, electrical panel, plumbing, and water heater last replaced?
- What does the HOA fee cover, when was the last increase, and are there any pending special assessments or reserve-fund shortfalls?
- Is there a deadline driving the sale (1031 exchange, divorce, estate, relocation)? That informs how much negotiation room exists.
- Schools are A-rated — typically a magnet for longer-tenancy family renters. What's the average tenant stay here, and is there a school-zone premium baked into asking?
- Crime grade is F in this area — have there been break-ins, vandalism, or insurance claims at this property in the last 3 years? What carrier currently insures it and at what premium?
- What's the average days-on-market for RENTAL listings here right now (not sales)? A rising rental-DOM trend means longer vacancies and softer asking-rent achievability than the comps imply.
- What's the recent tenant-quality profile in this submarket — average credit score on applications, eviction rate, late-payment / NSF rate, and stable-employment percentage? A property-management company in the area should have these aggregated.
- How much new for-sale + rental construction is in the pipeline within 1–3 miles? Heavy new supply typically softens prices + rents 12–24 months out; constrained supply supports both.
Investment metrics
- 1% rule
- 3.44% ✓
- Cap rate
- 13.40%
- Cash-on-cash
- 25.39%
- DSCR
- 2.13
- GRM
- 2.4
CMA / ARV
- ARV (median comp)
- $56,461
- List price
- $45,000
- Delta
- -20.30%
- Verdict
- UNDERPRICED
- Comps
- 20 within 1.0 mi
Show comp detail 12 sales within ~0.75 mi
| Address | Dist | Beds/Ba | Sqft | Sold | Price | $/sf | Match |
|---|---|---|---|---|---|---|---|
| 1 Estates Ln | 0.00mi | 2/1.0 | 910 (0%) | 3mo | $14,500 | $16 | 97 |
| 250 Estates Ln | 0.03mi | 2/1.0 | 910 (0%) | 4mo | $26,500 | $29 | 95 |
| 226 Norman Ln | 0.07mi | 2/1.0 | 980 (+8%) | 4mo | $27,000 | $28 | 81 |
| 185 French Run Ln | 0.13mi | 2/2.0 | 924 (+2%) | 10mo | $20,000 | $22 | 79 |
| 126 Sarah Ln | 0.20mi | 2/2.0 | 952 (+5%) | 14mo | $20,000 | $21 | 68 |
| 144 Cambridge Ct | 0.10mi | 3/2.0 (+1) | 1,044 (+15%) | 5mo | $75,000 | $72 | 58 |
| 982 Hillridge Rd | 0.71mi | 3/1.0 (+1) | 984 (+8%) | 1mo | $225,000 | $229 | 48 |
| 956 Hillridge Rd | 0.73mi | 3/1.0 (+1) | 984 (+8%) | 2mo | $147,000 | $149 | 46 |
| 7399 Wollam Ave | 0.72mi | 3/1.0 (+1) | 1,025 (+13%) | 1mo | $204,900 | $200 | 40 |
| 1164 Hillridge Rd | 0.61mi | 2/1.0 | 1,025 (+13%) | 20mo | $234,900 | $229 | 34 |
| 1045 Cottingham Rd | 0.73mi | 3/1.5 (+1) | 1,002 (+10%) | 14mo | $239,900 | $239 | 30 |
| 7390 Wollam Ave | 0.74mi | 3/1.0 (+1) | 1,025 (+13%) | 16mo | $243,000 | $237 | 26 |
Match score weights: distance 35% · size 25% · config 20% · recency 20%. Top-matched comps best support the ARV.
Projected returns pro-forma
-3.0% appreciation · 2.02% rent growth · sell at horizon
- IRR
- 17.2%
- Equity multiple
- 1.68×
- Total profit
- $8,597
- Equity at exit
- $6,710
- IRR
- 24.6%
- Equity multiple
- 2.98×
- Total profit
- $24,975
- Equity at exit
- $3,891
Cash invested: $12,600 (down + closing). Projections, not guarantees.
Landlord ↔ Tenant lean methodology
- Overall (STATE)
- 73 Landlord-Friendly
- State Ohio
- 73 Landlord-Friendly · R+6
- County
- — inherits STATE
- City
- — inherits STATE
ZIP-level market 43068
- Rents YoY
- 2.0%
- Active inventory
- 183
- Price-to-rent
- 2.4×
Monthly cashflow live
- Estimated rent
- $1,548 high interval (Pro) →
- Mortgage (P&I)
- −$236
- Tax est. 1.5%
- −$56 /mo · $675/yr
- Insurance
- −$19
- HOA
- −$645
- Vacancy / Maint / Mgmt
- −$325
- Net cashflow
- $267
Break-even live
Sensitivity live
| Price | -10% $298 | -5% $282 | +0% $267 | +5% $251 | +10% $236 |
|---|---|---|---|---|---|
| Rent | -10% $144 | -5% $205 | +0% $267 | +5% $328 | +10% $389 |
| Rate | -1.0pp $289 | -0.5pp $278 | base $267 | +0.5pp $255 | +1.0pp $243 |
UW: 25.0% down · 7.5% · 30yr · 1.5% tax · 5.0% vac · 8.0% maint · 8.0% mgmt
Financing live
Cash to close
- Down payment
- $11,250
- Closing costs
- $1,350
- Reserves months
- —
- Total cash needed
- —
Loan-product check · same deal, 3 products live
Conventional
25% down · 7.5% · 30yr
- Down + closing
- —
- Monthly P&I
- —
- Monthly cashflow
- —
- DSCR
- —
- Eligible?
- —
Personal DTI + credit; lowest rate.
DSCR
20% down · 8.5% · 30yr
- Down + closing
- —
- Monthly P&I
- —
- Monthly cashflow
- —
- DSCR
- —
- Eligible?
- —
No personal income docs; deal must DSCR.
Hard money
10% down · 12.0% · 12mo
- Down + closing
- —
- Monthly P&I
- —
- Monthly cashflow
- —
- DSCR
- —
- Eligible?
- —
Short-term bridge; refi at stabilization.
Rent comps 8 comps
| Address | Beds | Baths | Sqft | Rent | $/sqft | DOM | Units | Dist |
|---|---|---|---|---|---|---|---|---|
| 7670 N Oakbrook Dr Reynoldsburg, OH | 1.0–3.0 | 1.0–2.5 | 923 | $1,460 | $1.58 | 4d | 6 | 0.43mi |
| 8237 Goldsmith Dr Reynoldsburg, OH | 2.0 | 1.5 | 1040 | $1,475 | $1.42 | 45d | 1 | 0.57mi |
| 7378 E Main St Reynoldsburg, OH | 3.0 | 1.5 | 1062 | $1,595 | $1.50 | 14d | 1 | 0.65mi |
| 2067 Creekview Ct Reynoldsburg, OH | 1.0–2.0 | 1.0–1.5 | 975 | $1,419 | $1.46 | 3d | 18 | 1.04mi |
| 1802 Kelly's Path Reynoldsburg, OH | 2.0 | 2.0 | 1140 | $1,910 | $1.67 | 3d | 5 | 1.04mi |
| 1366 Briarcliff Rd Reynoldsburg, OH | 1.0–2.0 | 1.0 | 667 | $1,185 | $1.78 | 3d | 11 | 1.19mi |
| 6870 E Livingston Ave Reynoldsburg, OH | 2.0–3.0 | 1.5 | 1180 | $1,200 | $1.02 | 9d | 7 | 1.40mi |
| 6801 Bordeaux Ct Reynoldsburg, OH | 2.0 | 2.0 | 1049 | $1,600 | $1.53 | 5d | 7 | 1.46mi |
HOA detail
- Monthly dues
- $645 · $7,740/yr
Listing history 20 events
-
2026-06-21days on market $45,000 Active 37 DOM
-
2026-06-18days on market $45,000 Active 34 DOM
-
2026-06-17days on market $45,000 Active 33 DOM
-
2026-06-16days on market $45,000 Active 32 DOM
-
2026-06-15days on market $45,000 Active 31 DOM
-
2026-06-13days on market $45,000 Active 29 DOM
-
2026-06-13days on market $45,000 Active 28 DOM
-
2026-06-09days on market $45,000 Active 25 DOM
-
2026-06-08days on market $45,000 Active 24 DOM
-
2026-06-07pricedays on market $45,000 Active 23 DOM
-
2026-06-05days on market $47,000 Active 20 DOM
-
2026-06-03days on market $47,000 Active 19 DOM
-
2026-06-02days on market $47,000 Active 18 DOM
-
2026-06-01days on market $47,000 Active 17 DOM
-
2026-05-31days on market $47,000 Active 16 DOM
-
2026-05-15$47,000 Active 420-char remark
-
2026-03-13soldstatus $14,500 Closed
-
2026-03-03historical Contingent
-
2026-02-26price $17,500
-
2026-02-15$23,500 Active
ⓘ Source: listings_history table (triggers on properties + properties_extension) + one-shot
backfill from property_details.listing_events for pre-trigger history.
Climate risk First Street
- Flood 1/10 Low FEMA zone X (unshaded) · 0% chance over 30 yrs
- Wildfire 1/10 Low
- Heat 3/10 Moderate 7 d/yr ≥98°F today · 17 d/yr by 30 yrs out
- Wind 2/10 Low 100% chance of damaging wind over 30 yrs
- Air quality 2/10 Low 1 unhealthy d/yr today · 3 by 30 yrs out
Nearby sold comps map
Loading sold comps map…
Walkable amenities ~0.75 mi
Loading nearby amenities…
Taxation est. · year 1
- Rental income
- $18,571
- − Mortgage interest
- −$2,521
- − Property taxes
- −$675
- − Insurance
- −$225
- − Repairs & maintenance
- −$1,486
- − Management
- −$1,486
- − HOA
- −$7,740
- − Depreciation
- −$1,309
- Taxable income
- $3,130
- Est. tax owed @ 24.0%
- −$751
- After-tax cash flow
- $2,448/yr
For passive investors: Depreciation is non-cash, so a rental often shows a tax loss while cash-flowing — sheltering income. Rental losses are passive: they offset passive income freely, and up to $25,000/yr can offset ordinary (W-2) income if you actively participate and your MAGI is under $100k (phasing out to $0 by $150k); unused losses carry forward. On sale, claimed depreciation is recaptured at up to 25%, and gains may owe capital-gains tax (a 1031 exchange can defer both). Figures are a year-1 estimate at your 24.0% rate — not tax advice; consult a CPA.
Condition & rehab AI · 12 photos
This renovated 2-bedroom, 1-bath home in Reynoldsburg Estates offers a good condition with recent updates and a functional layout.
Value-add opportunities
- Resale Paint touch-ups — Fresh paint enhances curb appeal and interior aesthetics
- Both Landscaping improvements — Enhances curb appeal and adds value
- Both New outdoor lighting — Improves safety and curb appeal
Renovation cost estimate screening
Value-add ROI direction
- Resale Paint touch-ups — Fresh paint enhances curb appeal and interior aesthetics ↑
- Both Landscaping improvements — Enhances curb appeal and adds value ↑
- Both New outdoor lighting — Improves safety and curb appeal ↑
ⓘ Cost ranges are severity-bucket heuristics (US national rule-of-thumb). Get contractor quotes + a written scope before underwriting a rehab budget.
Schools (NCES district)
- District
- Reynoldsburg City
- NCES district ID
- 3904700
- Math proficiency
- 32% ▼ -23.00%
- Reading proficiency
- 50% ▼ -10.00%
- Median HH income
- $58,857
- Composite
- 36.1/100
- National rank
- #4757
- State rank
- #519 of 656 in OH
Livability — Reynoldsburg
- Score
- 80/100
- State rank
- #124
- US rank
- #1816
Category grades
Schools grade is shown separately in the Schools card above.
Census & demographics
- Census place
- Reynoldsburg, OH
- County
- Franklin County · 1,351,780 people
- City population
- 60,148
- Metro
- Columbus, OH
- Population (ZIP)
- 60,148
- Household income
- $70,477
- Rent vs Own
- Severe rent burden
- 2189.0
Population outlook (Franklin County) Hauer SSP2
- Today (2025)
- 1,456,139 people
- By 2030
- 1,556,890 · +6.9%
- By 2040
- 1,757,349 · +20.7%
- By 2050
- 1,950,539 · +34.0%
- By 2075
- 2,376,171 · +63.2%
- By 2100
- 2,636,796 · +81.1%
Race, ethnicity, and origin ACS 2023
- Neighborhood character
- Diverse neighborhood (Simpson 0.68)
- Race & ethnicity
- White 46% Black 31% Asian 9% Two or more races 8% Hispanic / Latino 7%
- Hispanic origin (detail)
- Mexican 3% Dominican 2%
- Common ancestry
- Lithuanian 2% Italian 2% Slovak 1%
- Foreign-born
- 15% · Canada, India
- Languages at home
- 81% English-only · Other Indo-European 7% Spanish 5% French/Haitian/Cajun 2%
Political lean MEDSL · Franklin
- 2024 margin
- Strong D (+28.4) · D 63.7% · R 35.3% · Other 1.0%
- 2008→2024 swing
- +7.7pp toward D · 2008: 20.7pp · 2024: 28.4pp
- All cycles
- 2024: D+28.4 2020: D+31.4 2016: D+25.9 2012: D+21.7 2008: D+20.7
Not yet ingested
- Civics
- —
Market trends
- HPI YoY
- ▼ -222.50%
- Current HPI
- 233.8839
- Rent YoY
- ▲ 2.02%
- Metro
- Columbus, OH
- State GDP YoY
- ▲ 1.98%
- F500 in state
- 48
Industry mix (Fortune 500 HQ in OH)
| Industry | F500 HQs | Revenue |
|---|---|---|
| Insurance | 3 | $145B |
|
||
| Industrial Machinery | 3 | $49B |
|
||
| Financial Services | 3 | $24B |
|
||
| Consumer Goods | 2 | $93B |
|
||
| Aerospace / Defense | 2 | $47B |
|
||
| Utilities | 2 | $33B |
|
||
Price history
+91.5% since first listed6 events — show timeline
- 2026-06-06 Price Changed $45,000 CBRMLS
- 2026-05-15 Listed $47,000 CBRMLS
- 2026-03-13 Sold (MLS) $14,500 CBRMLS
- 2026-03-03 Contingent — CBRMLS
- 2026-02-26 Price Changed $17,500 CBRMLS
- 2026-02-15 Listed $23,500 CBRMLS
Cash-flow waterfall
monthlySold comps — $/sqft
last 12 mo · ≤1 miLoading sold comps…