2440 CR 522 · Bushnell, FL
Flood risk 1/10 · Minimal
- FEMA flood zone
- X (unshaded)
- Chance of flooding over 30 yrs
- 0.0%
- Est. flood insurance / yr
- $507 – $1,088
Fire risk 4/10 · Minor
- Est. fire insurance / yr
- $947 – $1,759
Heat risk 8/10 · Major
- Hot days now (above 108°F)
- 7 days/yr
- Hot days in 30 yrs
- 23 days/yr
Wind risk 9/10 · Severe
- Chance of severe wind over 30 yrs
- 99.0%
Air-quality risk 1/10 · Minimal
- Unhealthy air days now
- 0 days/yr
- Unhealthy air days in 30 yrs
- 0 days/yr
Risk factors via First Street. Map © Google.
Why this score? — see what drove the D grade
The composite is a weighted blend of 9 inputs, each scored 0–100. Each bar is that input's sub-score; the figure is the points it added to the 100-point composite (weight × sub-score).
- Cash flow +11.6/30.0
- ARV discount +7.5/15.0
- Schools +5.2/10.0
- Appreciation +5.0/10.0
- DSCR +3.4/10.0
- Livability +2.9/5.0
- Rent growth +2.5/5.0
- Condition / age +2.5/5.0
- 1% rule +2.2/10.0
$250,000
🖨 Deal sheet (PDF) 📄 Offer letter ✓ Due diligence
Listing remarks
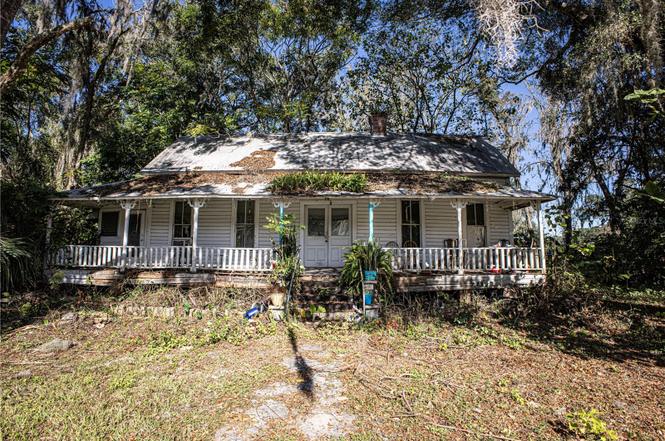
Old Florida Charm. Step back in time and discover the rare opportunity to own a piece of authentic Old Florida. Nestled on a scenic yard in the heart of Sumterville, this vacant land features a charming Florida Cracker-style home. Enjoy the serenity of rural living while remaining seconds away from 301 and a short drive to The Villages, Wildwood and Bushnell. Perfect for restoration, new construction or investment potential. This is your chance to own a true slice of Old Florida- a property filled with character, history, and unlimited possibilities. Schedule your private showing today.
Key facts
- Scenic yard
- Rural living
- New construction
Tags
Property features AI
Finance
- Other: Partially furnished; One well and one septic on the property; Living area approximately 1,104 square feet
- Financial info: Tax information not included per instructions
- HOA & community: No HOA; Community has street lights
Exterior
- Parking: No parking details provided
- Security: No security details provided
- Utilities: Well water; Private sewer; Private utilities; sewer available; water available
- Home design: Single-family residence; One story; Faces south
- Construction: Wood siding exterior; Metal roof; Crawlspace foundation; Built on approximately 0.69 acres (about 1/2 to less than 1 acre)
- Exterior features: Other exterior features; Paved road access; Street lights in the community
Interior
- Kitchen: Range
- Bedrooms: 3 bedrooms
- Flooring: Wood flooring
- Bathrooms: 1 full bathroom; 1 half bathroom
- Heating & cooling: No heating specified; No cooling specified
- Interior features: Eat-in kitchen; Kitchen/family room combo; Wood-burning fireplace
- Laundry & utility: Laundry inside
Neighborhood map
What this means for you Summary
Snapshot
- This is a 3-bed/1.5-bath single-family listed at $250k.
Deal economics
- At list price, monthly cash flow is $-76 ($-915/yr) — negative.
- To cash-flow at today's rent, offer at most $237k (5.4% below list).
- To meet the 1% rule (rent ≥ 1% of price), the offer needs to be $180k (28.2% below list).
- Recommended offer: $180k (28.2% below list) — sets the bar for 1% rule.
- Cap rate 5.9% vs local median 4.2% in Bushnell — top-decile yield for the area; either an underpriced asset or a hidden risk that comps aren't pricing in. Stress-test before assuming the spread holds.
Location & tenants
- Location reads 58/100 on livability (#835 in FL) — a working-class tenant base; expect higher turnover. Strengths: cost of living A+, housing A+, crime A-; Watch: health & safety C-, schools D+, amenities F.
- Sumter (rural): math 61% / reading 61% proficiency, ranked #11 of 73 in FL (top 15%) — acceptable for families but not a draw, mixed tenant base, ~2y average lease.
- Market conditions: 44 active listings in the ZIP; 1 comparable units currently listed for rent nearby; 3,961 units permitted in Sumter County in 2024 (248 in 5+ unit buildings).
Forward outlook
- In year one you build about $9k of equity ($2k loan paydown + $8k appreciation (3.0% local appreciation)).
- Sumter County population projected at +45% by 2050 — long-run rental-demand tailwind backs the buy-and-hold thesis.
- At projected returns (3.0% appreciation + 3.0% rent growth), your $70k cash investment doubles in ~7 years — after that, you're playing with house money.
- By year 4, paydown + projected appreciation supports a ~$31k cash-out refi (75% LTV) — recoverable capital for the next deal without selling this one.
Negotiation context
- It's been on market 163 days — a 12% lower offer ($220k) is reasonable based on typical stale-listing flexibility.
Risks & watch-outs
- Watch-outs: built in 1910 — expect roof / HVAC / electrical / plumbing capex.
- Climate carrying-cost: severe wind risk, 99% chance of damaging wind over 30y; extreme-heat days projected 7→23/yr by 2055 (HVAC capex compounding) — expect insurance premiums to compound above CPI over the hold.
Questions for the listing agent
- What do current leases actually rent for vs. the listed asking? Can we see a recent rent roll and the last 12 months of T-12 income?
- It's been on market 163 days. Have you received any prior offers? Is the seller open to a 28% concession, seller financing, or rate buy-down credit?
- Built in 1910 — when were the roof, HVAC, electrical panel, plumbing, and water heater last replaced?
- Why hasn't it sold? Are there any deal-killer items the seller is aware of (foundation, flood, title, zoning, code violations)?
- Is there a deadline driving the sale (1031 exchange, divorce, estate, relocation)? That informs how much negotiation room exists.
- Schools are D-rated, which usually means shorter tenancies and higher turnover. Who's the typical renter profile here, and what's been the actual vacancy rate?
- The area grade is low — what's the realistic commute time and amenity access for the typical tenant pool here? Any planned neighborhood developments (good or bad) we should know about?
- What's the average days-on-market for RENTAL listings here right now (not sales)? A rising rental-DOM trend means longer vacancies and softer asking-rent achievability than the comps imply.
- What's the recent tenant-quality profile in this submarket — average credit score on applications, eviction rate, late-payment / NSF rate, and stable-employment percentage? A property-management company in the area should have these aggregated.
- How much new for-sale + rental construction is in the pipeline within 1–3 miles? Heavy new supply typically softens prices + rents 12–24 months out; constrained supply supports both.
Investment metrics
- 1% rule
- 0.72% ✗
- Cap rate
- 5.93%
- Cash-on-cash
- -1.31%
- DSCR
- 0.94
- GRM
- 11.6
CMA / ARV
No comps found within radius.
Projected returns pro-forma
3.0% appreciation · 3.0% rent growth · sell at horizon
- IRR
- 6.3%
- Equity multiple
- 1.36×
- Total profit
- $25,142
- Equity at exit
- $112,411
- IRR
- 9.1%
- Equity multiple
- 2.37×
- Total profit
- $96,190
- Equity at exit
- $173,238
Cash invested: $70,000 (down + closing). Projections, not guarantees.
Landlord ↔ Tenant lean methodology
- Overall (STATE)
- 87 Strongly Landlord-Friendly
- State Florida
- 87 Strongly Landlord-Friendly · R+3
- County
- — inherits STATE
- City
- — inherits STATE
ZIP-level market 33585
- Active inventory
- 44
- Price-to-rent
- 11.6×
Monthly cashflow live
- Estimated rent
- $1,795 medium interval (Pro) →
- Mortgage (P&I)
- −$1,311
- Tax from tax record
- −$79 /mo · $950/yr
- Insurance
- −$104
- HOA
- −$0
- Vacancy / Maint / Mgmt
- −$377
- Net cashflow
- $-76
Break-even live
Sensitivity live
| Price | -10% $65 | -5% $-6 | +0% $-76 | +5% $-147 | +10% $-218 |
|---|---|---|---|---|---|
| Rent | -10% $-218 | -5% $-147 | +0% $-76 | +5% $-5 | +10% $66 |
| Rate | -1.0pp $50 | -0.5pp $-13 | base $-76 | +0.5pp $-141 | +1.0pp $-207 |
UW: 25.0% down · 7.5% · 30yr · 1.5% tax · 5.0% vac · 8.0% maint · 8.0% mgmt
Financing live
Cash to close
- Down payment
- $62,500
- Closing costs
- $7,500
- Reserves months
- —
- Total cash needed
- —
Loan-product check · same deal, 3 products live
Conventional
25% down · 7.5% · 30yr
- Down + closing
- —
- Monthly P&I
- —
- Monthly cashflow
- —
- DSCR
- —
- Eligible?
- —
Personal DTI + credit; lowest rate.
DSCR
20% down · 8.5% · 30yr
- Down + closing
- —
- Monthly P&I
- —
- Monthly cashflow
- —
- DSCR
- —
- Eligible?
- —
No personal income docs; deal must DSCR.
Hard money
10% down · 12.0% · 12mo
- Down + closing
- —
- Monthly P&I
- —
- Monthly cashflow
- —
- DSCR
- —
- Eligible?
- —
Short-term bridge; refi at stabilization.
Rent comps 1 comps
| Address | Beds | Baths | Sqft | Rent | $/sqft | DOM | Units | Dist |
|---|---|---|---|---|---|---|---|---|
| 1729 Nebraska Loop Bushnell, FL | 3.0 | 2.0 | 1263 | $1,795 | $1.42 | 22d | 1 | 1.35mi |
Listing history 16 events
-
2026-06-19days on market $250,000 Active 163 DOM
-
2026-06-18days on market $250,000 Active 162 DOM
-
2026-06-17days on market $250,000 Active 161 DOM
-
2026-06-16days on market $250,000 Active 160 DOM
-
2026-06-15days on market $250,000 Active 159 DOM
-
2026-06-14days on market $250,000 Active 157 DOM
-
2026-06-13days on market $250,000 Active 156 DOM
-
2026-06-10days on market $250,000 Active 154 DOM
-
2026-06-09days on market $250,000 Active 153 DOM
-
2026-06-08days on market $250,000 Active 152 DOM
-
2026-06-07days on market $250,000 Active 151 DOM
-
2026-06-02days on market $250,000 Active 146 DOM
-
2026-06-01days on market $250,000 Active 145 DOM
-
2026-05-31days on market $250,000 Active 144 DOM
-
2026-05-30days on market $250,000 Active 143 DOM
-
2026-01-07$250,000 Active
ⓘ Source: listings_history table (triggers on properties + properties_extension) + one-shot
backfill from property_details.listing_events for pre-trigger history.
Tax reassessment forecast FL · Resets to sale price
- Current annual tax
- $950 · $79/mo
- Projected year-2 tax
- $2,075 · $173/mo
- Expected delta
- +$1,125/yr (+$94/mo · 118.5%)
ⓘ Screening estimate from a state-policy table — verify with the county assessor before closing.
Climate risk First Street
- Flood 1/10 Low FEMA zone X (unshaded) · 0% chance over 30 yrs
- Wildfire 4/10 Moderate
- Heat 8/10 Severe 7 d/yr ≥108°F today · 23 d/yr by 30 yrs out
- Wind 9/10 Extreme 99% chance of damaging wind over 30 yrs
- Air quality 1/10 Low 0 unhealthy d/yr today · 0 by 30 yrs out
Nearby sold comps map
Loading sold comps map…
Walkable amenities ~0.75 mi
Loading nearby amenities…
Taxation est. · year 1
- Rental income
- $21,540
- − Mortgage interest
- −$14,004
- − Property taxes
- −$950
- − Insurance
- −$1,250
- − Repairs & maintenance
- −$1,723
- − Management
- −$1,723
- − Depreciation
- −$7,273
- Taxable loss
- −$5,383
- Est. tax savings @ 24.0%
- +$1,292
- After-tax cash flow
- $377/yr
For passive investors: Depreciation is non-cash, so a rental often shows a tax loss while cash-flowing — sheltering income. Rental losses are passive: they offset passive income freely, and up to $25,000/yr can offset ordinary (W-2) income if you actively participate and your MAGI is under $100k (phasing out to $0 by $150k); unused losses carry forward. On sale, claimed depreciation is recaptured at up to 25%, and gains may owe capital-gains tax (a 1031 exchange can defer both). Figures are a year-1 estimate at your 24.0% rate — not tax advice; consult a CPA.
Schools (NCES district)
- District
- Sumter
- NCES district ID
- 1201800
- Math proficiency
- 61% ▼ -4.00%
- Reading proficiency
- 61% ▼ -2.00%
- Median HH income
- $48,240
- Composite
- 51.74/100
- National rank
- #1682
- State rank
- #11 of 73 in FL
Livability — Bushnell
- Score
- 58/100
- State rank
- #835
- US rank
- #20676
Category grades
Schools grade is shown separately in the Schools card above.
Census & demographics
- Population (ZIP)
- 1,424
Population outlook (Sumter County) Hauer SSP2
- Today (2025)
- 161,172 people
- By 2030
- 180,083 · +11.7%
- By 2040
- 209,892 · +30.2%
- By 2050
- 234,186 · +45.3%
- By 2075
- 284,602 · +76.6%
- By 2100
- 317,039 · +96.7%
Race, ethnicity, and origin ACS 2023
- Neighborhood character
- Predominantly White (69%)
- Race & ethnicity
- White 69% Hispanic / Latino 30% Two or more races 8%
- Hispanic origin (detail)
- Mexican 8% Puerto Rican 17% Cuban 5%
- Common ancestry
- Lithuanian 3% Scotch-Irish 2% Italian 2%
- Foreign-born
- 6% · Canada
- Languages at home
- 84% English-only · Spanish 15% French/Haitian/Cajun 1%
Political lean MEDSL · Sumter
- 2024 margin
- Solid R (+37.6) · D 30.9% · R 68.6%
- 2008→2024 swing
- -10.6pp toward R · 2008: -27.0pp · 2024: -37.6pp
- All cycles
- 2024: R+37.6 2020: R+36.1 2016: R+39.2 2012: R+34.9 2008: R+27.0
Not yet ingested
- Civics
- —
Market trends
- HPI YoY
- —
- Current HPI
- —
- Rent YoY
- —
- Metro
- —
- State GDP YoY
- ▲ 3.28%
- F500 in state
- 36
Industry mix (Fortune 500 HQ in FL)
| Industry | F500 HQs | Revenue |
|---|---|---|
| Industrial Technology | 2 | $29B |
|
||
| Insurance | 2 | $17B |
|
||
| Retail | 1 | $60B |
|
||
| Technology Distribution | 1 | $58B |
|
||
| Homebuilding | 1 | $35B |
|
||
| Technology Manufacturing | 1 | $35B |
|
||
Price history
1 event — show timeline
- 2026-01-07 Listed $250,000 Stellar MLS as Distributed by MLS Grid
Property tax history
+5.0%/yrLatest (2025): $950 · +4.8% YoY. Source: county tax records.
Cash-flow waterfall
monthlySold comps — $/sqft
last 12 mo · ≤1 miLoading sold comps…