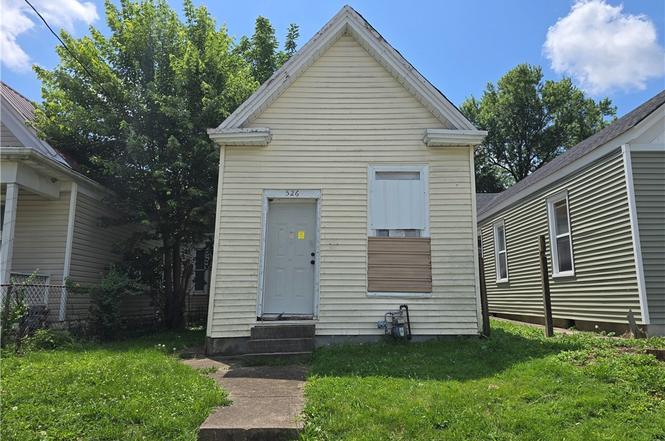
526 Culbertson Ave · New Albany, IN
Flood risk 1/10 · Minimal
- FEMA flood zone
- X (unshaded)
- Chance of flooding over 30 yrs
- 0.0%
- Est. flood insurance / yr
- $473 – $860
Fire risk 1/10 · Minimal
- Est. fire insurance / yr
- $717 – $1,331
Heat risk 5/10 · Moderate
- Hot days now (above 106°F)
- 7 days/yr
- Hot days in 30 yrs
- 20 days/yr
Wind risk 2/10 · Minimal
- Chance of severe wind over 30 yrs
- 1.0%
Air-quality risk 2/10 · Minimal
- Unhealthy air days now
- 1 days/yr
- Unhealthy air days in 30 yrs
- 2 days/yr
Risk factors via First Street. Map © Google.
Why this score? — see what drove the B grade
The composite is a weighted blend of 9 inputs, each scored 0–100. Each bar is that input's sub-score; the figure is the points it added to the 100-point composite (weight × sub-score).
- Cash flow +30.0/30.0
- 1% rule +10.0/10.0
- DSCR +10.0/10.0
- ARV discount +7.5/15.0
- Rent growth +4.3/5.0
- Schools +4.2/10.0
- Livability +3.7/5.0
- Condition / age +2.5/5.0
- Appreciation +0.0/10.0
$74,900
🖨 Deal sheet 📄 Offer letter ✓ Due diligence
Listing remarks MLS
A Blank Canvas… Literally! ????? Attention visionaries, dreamers, and fans of extreme makeovers—this shotgun house is ready for its glow-up! Completely gutted on the inside, it offers endless possibilities (because, well, there's literally nothing in the way). Want an open-concept layout? Congrats, you already have one! Thinking of adding a loft, gourmet kitchen, or secret speakeasy? The choice is yours! With solid potential and a prime location, this home is perfect for those who love a project (or at least a good story to tell at parties). Whether you're a seasoned renovator or just someone who loves a challenge, this is your chance to bring your vision to life—no pesky walls to slow you down! Come take a look before someone else turns this blank slate into a masterpiece! BYO imagination, hard hat optional. ????
Key facts
- Foundation work done
- Raised roof line
- Wide open floor plan
Tags
Property features AI
Finance
- Other: Above-grade finished area approximately 882; Below-grade unfinished area approximately 440
Exterior
- Utilities: Public water connected; Public sewer
- Home design: Single-story home
- Construction: Vinyl siding; Built with a cellar foundation
- Exterior features: Paved road access; Residential zoning
Interior
- Bathrooms: 1 full bathroom
- Interior features: Partial basement; Cellar foundation; Resale condition
Neighborhood map
What this means for you Summary
Snapshot
- This is a 2-bed/1.0-bath single-family listed at $75k.
Deal economics
- At list price, monthly cash flow is $418 ($5k/yr) — positive.
- The deal already cash-flows at list — no discount required.
- Meets the 1% rule at list price ($1k rent vs $75k).
- Cap rate 13.0% vs local median 3.8% in New Albany — top-decile yield for the area; either an underpriced asset or a hidden risk that comps aren't pricing in. Stress-test before assuming the spread holds.
Location & tenants
- Location reads 73/100 on livability (#100 in IN) — a middle-class / working-renter tenant base. Strengths: cost of living A+, housing A+, health & safety B; Watch: commute C-, employment D+, schools D.
- New Albany-Floyd County Consolidated Schools (suburban): math 46% / reading 50% proficiency, ranked #68 of 301 in IN (top 23%) — families likely to look elsewhere, expect single-tenant / working-renter base with shorter leases.
- Market conditions: Rents rising fast (+7.2%/yr); 269 active listings in the ZIP; 26 comparable units currently listed for rent nearby; rentals at typical pace (median 20d on market — plan ~3-4 weeks tenant-placement turnaround); 297 units permitted in Floyd County in 2024 (84 in 5+ unit buildings).
Forward outlook
- Local home prices are declining (-3.0%/yr); year-one equity from $518 of loan paydown is wiped out by about $2k of value loss. Plan a longer hold.
- Floyd County population projected at +10% by 2050 — modest demand growth; plan on rents tracking national, not racing it.
- At projected returns (-3.0% appreciation + 7.2% rent growth), your $21k cash investment doubles in ~5 years — after that, you're playing with house money.
Negotiation context
- Only 5 days on market — expect competitive offers; lowballing is unlikely to land.
- 3 sale attempts since 4y ago with the ask held roughly flat each time — persistent listings suggest the price (not the market) is what's stuck; bring a comps-based counter.
- Current owner paid $50k; 50% above their basis — modest negotiation headroom, anchor on the comps not their cost.
Risks & watch-outs
- Watch-outs: built in 1929 — expect roof / HVAC / electrical / plumbing capex.
- Climate carrying-cost: extreme-heat days projected 7→20/yr by 2055 (HVAC capex compounding) — expect insurance premiums to compound above CPI over the hold.
Questions for the listing agent
- Built in 1929 — when were the roof, HVAC, electrical panel, plumbing, and water heater last replaced?
- Is there a deadline driving the sale (1031 exchange, divorce, estate, relocation)? That informs how much negotiation room exists.
- Schools are D-rated, which usually means shorter tenancies and higher turnover. Who's the typical renter profile here, and what's been the actual vacancy rate?
- What's the average days-on-market for RENTAL listings here right now (not sales)? A rising rental-DOM trend means longer vacancies and softer asking-rent achievability than the comps imply.
- What's the recent tenant-quality profile in this submarket — average credit score on applications, eviction rate, late-payment / NSF rate, and stable-employment percentage? A property-management company in the area should have these aggregated.
- How much new for-sale + rental construction is in the pipeline within 1–3 miles? Heavy new supply typically softens prices + rents 12–24 months out; constrained supply supports both.
Investment metrics
- 1% rule
- 1.52% ✓
- Cap rate
- 13.00%
- Cash-on-cash
- 23.94%
- DSCR
- 2.07
- GRM
- 5.5
CMA / ARV
- ARV (on-the-fly)
- $160,524
- Comps found
- 12
Show comp detail 12 sales within ~0.75 mi
| Address | Dist | Beds/Ba | Sqft | Sold | Price | $/sf | Match |
|---|---|---|---|---|---|---|---|
| 525 E 8th St | 0.13mi | 2/1.0 | 826 (-6%) | 1mo | $149,900 | $181 | 82 |
| 1104 Ekin Ave | 0.26mi | 2/1.0 | 841 (-5%) | 6mo | $51,000 | $61 | 75 |
| 1521 Ekin Ave | 0.54mi | 2/1.0 | 896 (+2%) | 2mo | $162,000 | $181 | 70 |
| 1102 Beeler St | 0.29mi | 2/1.0 | 752 (-15%) | 1mo | $158,000 | $210 | 61 |
| 1314 Chartres St | 0.45mi | 2/1.0 | 956 (+8%) | 7mo | $68,000 | $71 | 60 |
| 226 Green St | 0.69mi | 2/1.0 | 898 (+2%) | 6mo | $180,000 | $200 | 60 |
| 1711 Ekin Ave | 0.66mi | 2/2.0 | 900 (+2%) | 4mo | $210,000 | $233 | 59 |
| 1516 Charlestown Rd | 0.70mi | 2/1.0 | 832 (-6%) | 3mo | $186,900 | $225 | 56 |
| 247 Jackson St | 0.70mi | 2/1.0 | 826 (-6%) | 2mo | $150,000 | $182 | 55 |
| 1108 State St | 0.54mi | 2/1.0 | 982 (+11%) | 2mo | $52,900 | $54 | 54 |
| 330 E 16th St | 0.62mi | 2/1.0 | 1,008 (+14%) | 5mo | $190,000 | $188 | 43 |
| 1313 Vine St | 0.70mi | 1/1.0 (-1) | 1,012 (+15%) | 6mo | $114,000 | $113 | 33 |
Match score weights: distance 35% · size 25% · config 20% · recency 20%. Top-matched comps best support the ARV.
Projected returns pro-forma
-3.0% appreciation · 7.24% rent growth · sell at horizon
- IRR
- 21.7%
- Equity multiple
- 1.93×
- Total profit
- $19,590
- Equity at exit
- $11,168
- IRR
- 32.4%
- Equity multiple
- 4.53×
- Total profit
- $74,117
- Equity at exit
- $6,476
Cash invested: $20,972 (down + closing). Projections, not guarantees.
Landlord ↔ Tenant lean methodology
- Overall (STATE)
- 90 Strongly Landlord-Friendly
- State Indiana
- 90 Strongly Landlord-Friendly · R+11
- County
- — inherits STATE
- City
- — inherits STATE
ZIP-level market 47150
- Rents YoY
- 7.2%
- Active inventory
- 269
- Price-to-rent
- 5.5×
Monthly cashflow live
- Estimated rent
- $1,142 high interval (Pro) →
- Mortgage (P&I)
- −$393
- Tax from tax record
- −$60 /mo · $719/yr
- Insurance
- −$31
- HOA
- −$0
- Vacancy / Maint / Mgmt
- −$240
- Net cashflow
- $418
Break-even live
UW: 25.0% down · 7.5% · 30yr · 1.5% tax · 5.0% vac · 8.0% maint · 8.0% mgmt
Financing live
Cash to close
- Down payment
- $18,725
- Closing costs
- $2,247
- Reserves months
- —
- Total cash needed
- —
Loan-product check · same deal, 3 products live
Conventional
25% down · 7.5% · 30yr
- Down + closing
- —
- Monthly P&I
- —
- Monthly cashflow
- —
- DSCR
- —
- Eligible?
- —
Personal DTI + credit; lowest rate.
DSCR
20% down · 8.5% · 30yr
- Down + closing
- —
- Monthly P&I
- —
- Monthly cashflow
- —
- DSCR
- —
- Eligible?
- —
No personal income docs; deal must DSCR.
Hard money
10% down · 12.0% · 12mo
- Down + closing
- —
- Monthly P&I
- —
- Monthly cashflow
- —
- DSCR
- —
- Eligible?
- —
Short-term bridge; refi at stabilization.
Rent comps 26 comps
| Address | Beds | Baths | Sqft | Rent | $/sqft | DOM | Units | Dist |
|---|---|---|---|---|---|---|---|---|
| 520 Culbertson Ave Unit B New Albany, IN | 3.0 | 2.0 | 1000 | $1,395 | $1.40 | 3d | 1 | 0.05mi |
| 812 Culbertson Ave New Albany, IN | 2.0 | 1.0 | 1000 | $1,095 | $1.09 | 21d | 1 | 0.13mi |
| 901 E Oak St New Albany, IN | 3.0 | 1.0 | 1100 | $1,350 | $1.23 | 23d | 1 | 0.17mi |
| 905 E Elm St New Albany, IN | 1.0–2.0 | 1.0 | 937 | $1,035 | $1.10 | 23d | 1 | 0.21mi |
| 608 E Spring St Unit 2 New Albany, IN | 2.0 | 2.0 | 1100 | $1,195 | $1.09 | 3d | 1 | 0.26mi |
| 608 E Spring St Unit 2 New Albany, IN | 2.0 | 2.0 | 1100 | $1,195 | $1.09 | 23d | 1 | 0.26mi |
| 309 E Spring St Unit 310-106 New Albany, IN | 2.0 | 2.0 | 1005 | $1,250 | $1.24 | 17d | 1 | 0.29mi |
| 309 E Spring St Unit 310-203 New Albany, IN | 2.0 | 2.5 | 1005 | $1,250 | $1.24 | 3d | 1 | 0.29mi |
| 1409 Chartres St Unit 2 New Albany, IN | 1.0 | 1.0 | 700 | $750 | $1.07 | 23d | 1 | 0.45mi |
| 1409 Chartres St Unit 2 New Albany, IN | 1.0 | 1.0 | 650 | $750 | $1.15 | 14d | 1 | 0.45mi |
| 1307 E Market St #2 New Albany, IN | 1.0 | 1.0 | 804 | $975 | $1.21 | 15d | 1 | 0.51mi |
| 1307 E Market St #1 New Albany, IN | 2.0 | 1.0 | 936 | $1,190 | $1.27 | 17d | 1 | 0.51mi |
| 1108 State St New Albany, IN | 2.0 | 1.0 | 982 | $1,150 | $1.17 | 21d | 1 | 0.55mi |
| 1201 Dewey St #3 New Albany, IN | 1.0 | 1.0 | 700 | $775 | $1.11 | 17d | 1 | 0.56mi |
| 121 E 14th St Unit 2 New Albany, IN | 1.0 | 1.0 | 650 | $825 | $1.27 | 20d | 1 | 0.62mi |
| 508 Vincennes St New Albany, IN | 1.0 | 1.0 | 750 | $850 | $1.13 | 23d | 1 | 0.63mi |
| 1637 E Market St New Albany, IN | 1.0 | 1.0 | 643 | $1,066 | $1.66 | 3d | 1 | 0.71mi |
| 1915 Culbertson Ave New Albany, IN | 3.0 | 1.0 | 1000 | $1,450 | $1.45 | 17d | 1 | 0.89mi |
| 1226 Naghel St Unit 2 New Albany, IN | 1.0 | 1.0 | 600 | $725 | $1.21 | 23d | 1 | 0.95mi |
| 1226 Naghel St Unit 2 New Albany, IN | 1.0 | 1.0 | 650 | $725 | $1.12 | 21d | 1 | 0.95mi |
| 1808 Bono Rd New Albany, IN | 1.0–2.0 | 1.0–2.0 | 1000 | $1,035 | $1.03 | 3d | 1 | 0.99mi |
| 1940 Center St Unit 2 New Albany, IN | 1.0 | 1.0 | 650 | $725 | $1.12 | 21d | 1 | 1.02mi |
| 2032 Culbertson Ave Unit 6 New Albany, IN | 1.0 | 1.0 | 550 | $695 | $1.26 | 3d | 1 | 1.06mi |
| 1316 Roosevelt Ave Unit 11 New Albany, IN | 2.0 | 1.5 | 700 | $950 | $1.36 | 23d | 1 | 1.11mi |
| 2121 Culbertson Ave Unit D New Albany, IN | 1.0 | 1.0 | 650 | $750 | $1.15 | 23d | 1 | 1.11mi |
| 2239 Charlestown Rd Apt 104 New Albany, IN | 1.0 | 1.0 | 842 | $1,100 | $1.31 | 14d | 1 | 1.18mi |
Listing history 5 events
-
2026-06-18days on market $74,900 Active 5 DOM
-
2026-06-17days on market $74,900 Active 4 DOM
-
2026-06-16days on market $74,900 Active 3 DOM
-
2026-06-15remarks 699-char remark
-
2026-06-15$74,900 Active 2 DOM
ⓘ Source: listings_history table (triggers on properties + properties_extension) + one-shot
backfill from property_details.listing_events for pre-trigger history.
Tax reassessment forecast IN · Partial reset (capped growth)
- Current annual tax
- $719 · $60/mo
- Projected year-2 tax
- $719 · $60/mo
- Expected delta
- $0/yr ($0/mo · 0.0%)
ⓘ Screening estimate from a state-policy table — verify with the county assessor before closing.
Climate risk First Street
- Flood 1/10 Low FEMA zone X (unshaded) · 0% chance over 30 yrs
- Wildfire 1/10 Low
- Heat 5/10 Major 7 d/yr ≥106°F today · 20 d/yr by 30 yrs out
- Wind 2/10 Low 100% chance of damaging wind over 30 yrs
- Air quality 2/10 Low 1 unhealthy d/yr today · 2 by 30 yrs out
Nearby sold comps map
Loading sold comps map…
Walkable amenities ~0.75 mi
Loading nearby amenities…
Taxation est. · year 1
- Rental income
- $13,706
- − Mortgage interest
- −$4,196
- − Property taxes
- −$719
- − Insurance
- −$374
- − Repairs & maintenance
- −$1,097
- − Management
- −$1,097
- − Depreciation
- −$2,179
- Taxable income
- $4,045
- Est. tax owed @ 24.0%
- −$971
- After-tax cash flow
- $4,050/yr
For passive investors: Depreciation is non-cash, so a rental often shows a tax loss while cash-flowing — sheltering income. Rental losses are passive: they offset passive income freely, and up to $25,000/yr can offset ordinary (W-2) income if you actively participate and your MAGI is under $100k (phasing out to $0 by $150k); unused losses carry forward. On sale, claimed depreciation is recaptured at up to 25%, and gains may owe capital-gains tax (a 1031 exchange can defer both). Figures are a year-1 estimate at your 24.0% rate — not tax advice; consult a CPA.
Schools (NCES district)
- District
- New Albany-Floyd County Consolidated Schools
- NCES district ID
- 1807410
- Math proficiency
- 46% ▼ -4.00%
- Reading proficiency
- 50% ▼ -3.00%
- Median HH income
- $54,709
- Composite
- 41.57/100
- National rank
- #3441
- State rank
- #68 of 301 in IN
Livability — New Albany
- Score
- 73/100
- State rank
- #100
- US rank
- #5454
Category grades
Schools grade is shown separately in the Schools card above.
Census & demographics
- Census place
- New Albany, IN
- County
- Floyd County · 49,144 people
- City population
- 49,144
- Metro
- Louisville/Jefferson County, KY-IN
- Population (ZIP)
- 49,144
- Household income
- $62,820
- Rent vs Own
- Severe rent burden
- 1737.0
Population outlook (Floyd County) Hauer SSP2
- Today (2025)
- 82,092 people
- By 2030
- 84,384 · +2.8%
- By 2040
- 87,919 · +7.1%
- By 2050
- 89,958 · +9.6%
- By 2075
- 94,159 · +14.7%
- By 2100
- 91,907 · +12.0%
Race, ethnicity, and origin ACS 2023
- Neighborhood character
- Predominantly White (82%)
- Race & ethnicity
- White 82% Black 8% Two or more races 6% Hispanic / Latino 5% Asian 1%
- Common ancestry
- Italian 3% Slovak 2% Lithuanian 2%
- Foreign-born
- 3% · Canada
- Languages at home
- 96% English-only · Spanish 2% Other Asian/Pacific 1%
Political lean MEDSL · Floyd
- 2024 margin
- R (+15.5) · D 41.4% · R 56.9% · Other 1.7%
- 2008→2024 swing
- -5.4pp toward R · 2008: -10.1pp · 2024: -15.5pp
- All cycles
- 2024: R+15.5 2020: R+14.1 2016: R+20.1 2012: R+14.3 2008: R+10.1
Not yet ingested
- Civics
- —
Market trends
- HPI YoY
- ▼ -185.20%
- Current HPI
- 206.7738
- Rent YoY
- ▲ 7.24%
- Metro
- Louisville/Jefferson County, KY-IN
- State GDP YoY
- ▲ 2.90%
- F500 in state
- 18
Industry mix (Fortune 500 HQ in IN)
| Industry | F500 HQs | Revenue |
|---|---|---|
| Industrial Machinery | 2 | $37B |
|
||
| Healthcare | 1 | $177B |
|
||
| Pharmaceuticals | 1 | $45B |
|
||
| Metals / Steel | 1 | $18B |
|
||
| Agriculture | 1 | $17B |
|
||
| Packaging | 1 | $12B |
|
||
Price history
+24.8% since first listed11 events — show timeline
- 2026-06-13 Listed $74,900 SIRA
- 2025-04-01 Sold (MLS) $50,000 SIRA
- 2025-03-18 Delisted — SIRA
- 2025-03-17 Listed $65,000 SIRA
- 2022-12-01 Sold (MLS) $51,000 SIRA
- 2022-10-27 Pending — SIRA
- 2022-10-25 Price Changed $56,500 SIRA
- 2022-10-19 Price Changed $57,999 SIRA
- 2022-10-14 Price Changed $58,999 SIRA
- 2022-10-10 Price Changed $59,500 SIRA
- 2022-10-07 Listed $60,000 SIRA
Property tax history
+1.9%/yrLatest (2025): $719 · +13.2% YoY. Source: county tax records.
Cash-flow waterfall
monthlySold comps — $/sqft
last 12 mo · ≤1 miLoading sold comps…