3129 Airport Blvd · Houston, TX
Flood risk 6/10 · Moderate
- FEMA flood zone
- X (shaded)
- Chance of flooding over 30 yrs
- 0.7%
- Est. flood insurance / yr
- $507 – $1,088
Fire risk 3/10 · Minor
- Est. fire insurance / yr
- $1,222 – $2,270
Heat risk 9/10 · Severe
- Hot days now (above 109°F)
- 7 days/yr
- Hot days in 30 yrs
- 23 days/yr
Wind risk 9/10 · Severe
- Chance of severe wind over 30 yrs
- 99.0%
Air-quality risk 2/10 · Minimal
- Unhealthy air days now
- 2 days/yr
- Unhealthy air days in 30 yrs
- 2 days/yr
Risk factors via First Street. Map © Google.
Why this score? — see what drove the C- grade
The composite is a weighted blend of 9 inputs, each scored 0–100. Each bar is that input's sub-score; the figure is the points it added to the 100-point composite (weight × sub-score).
- Cash flow +18.2/30.0
- Appreciation +10.0/10.0
- DSCR +5.7/10.0
- 1% rule +4.3/10.0
- Rent growth +3.7/5.0
- Livability +3.7/5.0
- Schools +2.7/10.0
- Condition / age +2.5/5.0
- ARV discount +1.9/15.0
$155,000
🖨 Deal sheet (PDF) 📄 Offer letter ✓ Due diligence
Listing remarks MLS
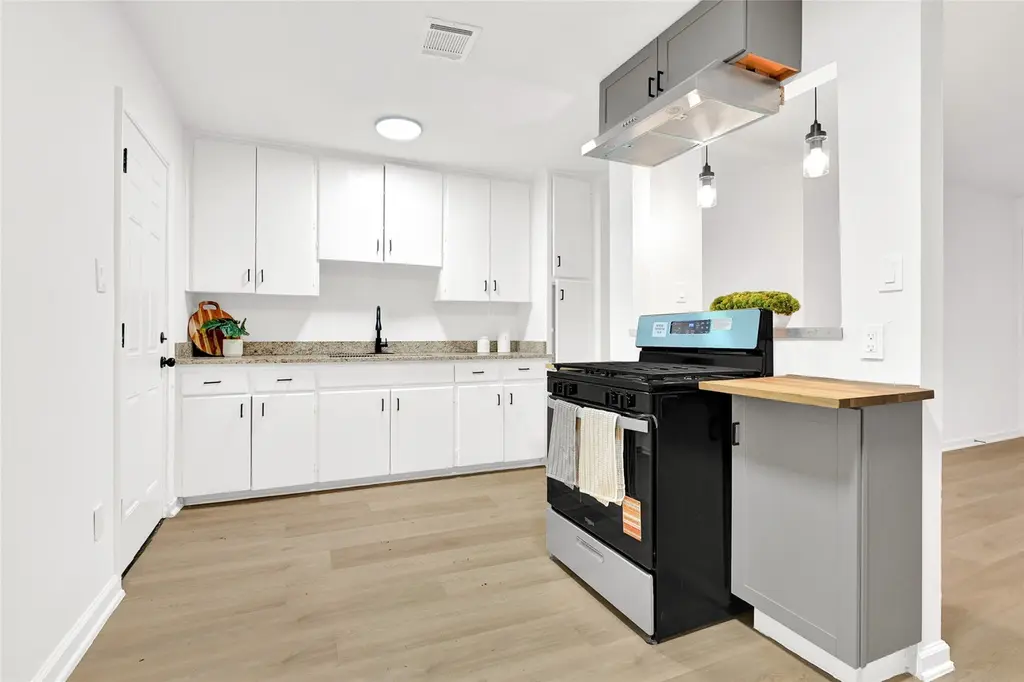
Move-in ready and beautifully renovated, this 3-bedroom, 1-bath home offers modern updates and a prime location! Featuring a brand-new roof, new water heater, updated gas lines, new plumbing, and a new A/C system for peace of mind. Enjoy modern fixtures, ceiling fans, and new vinyl plank flooring throughout, along with fresh interior and exterior paint for a clean, inviting feel. Located with no HOA, just minutes from NRG Stadium, the Texas Medical Center, and Downtown Houston, with easy access to major highways. Whether you’re a first-time buyer or investor, this home is a great opportunity in a highly desirable area!
Key facts
- New plumbing
- New a c system
- Brand new roof
Tags
Neighborhood map
What this means for you Summary
Snapshot
- This is a 3-bed/1.0-bath single-family listed at $155k.
Deal economics
- At list price, monthly cash flow is $140 ($2k/yr) — positive.
- The deal already cash-flows at list — no discount required.
- To meet the 1% rule (rent ≥ 1% of price), the offer needs to be $144k (6.8% below list).
- Recommended offer: $144k (6.8% below list) — sets the bar for 1% rule.
Location & tenants
- Location reads 74/100 on livability (#184 in TX, #4,771 nationally) — a middle-class / working-renter tenant base. Strengths: amenities A+, cost of living A+, housing A+; Watch: crime F.
- Houston ISD (urban): math 27% / reading 35% proficiency, ranked #593 of 826 in TX (top 72%) — families likely to look elsewhere, expect single-tenant / working-renter base with shorter leases; 71% free/reduced lunch — lower-income household profile, screen leases tightly.
- Zoned schools: Reynolds El (math 8% / reading 8%, grade F, #4,301 of 4,322 statewide, top 100%, 334 students, 98% FRL); Attucks Middle (math 15% / reading 22%, grade F, #1,478 of 1,662 statewide, top 90%, 439 students, 98% FRL); Worthing H S (math 22% / reading 21%, grade F, #1,377 of 1,632 statewide, top 85%, 827 students, 96% FRL) — zoned schools average 97% FRL vs 71% district-wide (26 pts higher); higher-poverty schools than district average — tighter screening recommended.
- Zoned-school proficiency averages 16% at this address vs 31% district-wide (-15 pts) — the specific schools serving this property underperform the Houston ISD average; the district grade overstates school quality for this exact location.
- Market conditions: Rents rising fast (+4.8%/yr); 321 active listings in the ZIP; 18 comparable units currently listed for rent nearby; rentals at typical pace (median 19d on market — plan ~3-4 weeks tenant-placement turnaround); lower-income renter base — watch delinquency; 29,883 units permitted in Harris County in 2024 (8,621 in 5+ unit buildings).
Forward outlook
- In year one you build about $17k of equity ($1k loan paydown + $16k appreciation (10.0% local appreciation)).
- Harris County population projected at +47% by 2050 — long-run rental-demand tailwind backs the buy-and-hold thesis.
- At projected returns (10.0% appreciation + 4.8% rent growth), your $43k cash investment doubles in ~3 years — after that, you're playing with house money.
- By year 3, paydown + projected appreciation supports a ~$42k cash-out refi (75% LTV) — recoverable capital for the next deal without selling this one.
Negotiation context
- It's been on market 82 days — a 6% lower offer ($146k) is reasonable based on typical stale-listing flexibility.
- 2 sale attempts; this cycle's ask is 9588% above the opening price — seller raised mid-cycle; expect resistance to lowballs.
Risks & watch-outs
- Watch-outs: built in 1950 — expect roof / HVAC / electrical / plumbing capex.
- Climate carrying-cost: major flood risk; severe wind risk, 99% chance of damaging wind over 30y; extreme-heat days projected 7→23/yr by 2055 (HVAC capex compounding) — expect insurance premiums to compound above CPI over the hold.
Questions for the listing agent
- It's been on market 82 days. Have you received any prior offers? Is the seller open to a 7% concession, seller financing, or rate buy-down credit?
- Built in 1950 — when were the roof, HVAC, electrical panel, plumbing, and water heater last replaced?
- Why hasn't it sold? Are there any deal-killer items the seller is aware of (foundation, flood, title, zoning, code violations)?
- Is there a deadline driving the sale (1031 exchange, divorce, estate, relocation)? That informs how much negotiation room exists.
- Schools are D-rated, which usually means shorter tenancies and higher turnover. Who's the typical renter profile here, and what's been the actual vacancy rate?
- Crime grade is F in this area — have there been break-ins, vandalism, or insurance claims at this property in the last 3 years? What carrier currently insures it and at what premium?
- What's the average days-on-market for RENTAL listings here right now (not sales)? A rising rental-DOM trend means longer vacancies and softer asking-rent achievability than the comps imply.
- What's the recent tenant-quality profile in this submarket — average credit score on applications, eviction rate, late-payment / NSF rate, and stable-employment percentage? A property-management company in the area should have these aggregated.
- How much new for-sale + rental construction is in the pipeline within 1–3 miles? Heavy new supply typically softens prices + rents 12–24 months out; constrained supply supports both.
Investment metrics
- 1% rule
- 0.93% ✗
- Cap rate
- 7.38%
- Cash-on-cash
- 3.88%
- DSCR
- 1.17
- GRM
- 8.9
CMA / ARV
- ARV (median comp)
- $137,943
- List price
- $155,000
- Delta
- 12.37%
- Verdict
- OVERPRICED
- Comps
- 20 within 1.0 mi
Show comp detail 7 sales within ~0.75 mi
| Address | Dist | Beds/Ba | Sqft | Sold | Price | $/sf | Match |
|---|---|---|---|---|---|---|---|
| 3201 Airport Blvd | 0.01mi | 3/2.0 | 984 (+9%) | 22mo | $198,900 | $202 | 62 |
| 10506 Chesterfield Dr | 0.27mi | 3/1.0 | 858 (-5%) | 20mo | $84,882 | $99 | 62 |
| 10101 Rosehaven Dr | 0.35mi | 3/1.0 | 876 (-3%) | 22mo | $130,000 | $148 | 60 |
| 10013 Cathedral Dr | 0.39mi | 3/1.0 | 813 (-10%) | 20mo | $129,900 | $160 | 48 |
| 9605 Chesterfield Dr | 0.60mi | 3/1.0 | 792 (-12%) | 4mo | $50,000 | $63 | 48 |
| 9522 Fairland Dr | 0.63mi | 2/1.0 (-1) | 834 (-8%) | 17mo | $68,900 | $83 | 38 |
| 9502 Chesterfield Dr | 0.70mi | 3/2.0 | 978 (+8%) | 17mo | $145,000 | $148 | 36 |
Match score weights: distance 35% · size 25% · config 20% · recency 20%. Top-matched comps best support the ARV.
Projected returns pro-forma
10.0% appreciation · 4.77% rent growth · sell at horizon
- IRR
- 27.7%
- Equity multiple
- 3.21×
- Total profit
- $95,955
- Equity at exit
- $139,636
- IRR
- 24.7%
- Equity multiple
- 7.48×
- Total profit
- $281,205
- Equity at exit
- $301,131
Cash invested: $43,400 (down + closing). Projections, not guarantees.
Landlord ↔ Tenant lean methodology
- Overall (STATE)
- 87 Strongly Landlord-Friendly
- State Texas
- 87 Strongly Landlord-Friendly · R+5
- County
- — inherits STATE
- City
- — inherits STATE
ZIP-level market 77051
- Home prices YoY
- 9.7%
- Rents YoY
- 4.8%
- Active inventory
- 321
- Price-to-rent
- 8.9×
Monthly cashflow live
- Estimated rent
- $1,444 high interval (Pro) →
- Mortgage (P&I)
- −$813
- Tax from tax record
- −$123 /mo · $1,477/yr
- Insurance
- −$65
- HOA
- −$0
- Vacancy / Maint / Mgmt
- −$303
- Net cashflow
- $140
Break-even live
Sensitivity live
| Price | -10% $228 | -5% $184 | +0% $140 | +5% $97 | +10% $53 |
|---|---|---|---|---|---|
| Rent | -10% $26 | -5% $83 | +0% $140 | +5% $197 | +10% $255 |
| Rate | -1.0pp $218 | -0.5pp $180 | base $140 | +0.5pp $100 | +1.0pp $59 |
UW: 25.0% down · 7.5% · 30yr · 1.5% tax · 5.0% vac · 8.0% maint · 8.0% mgmt
Financing live
Cash to close
- Down payment
- $38,750
- Closing costs
- $4,650
- Reserves months
- —
- Total cash needed
- —
Loan-product check · same deal, 3 products live
Conventional
25% down · 7.5% · 30yr
- Down + closing
- —
- Monthly P&I
- —
- Monthly cashflow
- —
- DSCR
- —
- Eligible?
- —
Personal DTI + credit; lowest rate.
DSCR
20% down · 8.5% · 30yr
- Down + closing
- —
- Monthly P&I
- —
- Monthly cashflow
- —
- DSCR
- —
- Eligible?
- —
No personal income docs; deal must DSCR.
Hard money
10% down · 12.0% · 12mo
- Down + closing
- —
- Monthly P&I
- —
- Monthly cashflow
- —
- DSCR
- —
- Eligible?
- —
Short-term bridge; refi at stabilization.
Rent comps 18 comps
| Address | Beds | Baths | Sqft | Rent | $/sqft | DOM | Units | Dist |
|---|---|---|---|---|---|---|---|---|
| 10510 Cathedral Dr Houston, TX | 3.0 | 1.0 | 887 | $1,300 | $1.47 | 45d | 1 | 0.14mi |
| 4112 Grassmere St Houston, TX | 2.0 | 1.0 | 711 | $700 | $0.98 | 13d | 1 | 0.87mi |
| 4205 Grassmere St Houston, TX | 2.0 | 1.0 | 824 | $900 | $1.09 | 26d | 1 | 0.93mi |
| 9414 Heno St Unit 13 Houston, TX | 2.0 | 1.0 | 824 | $900 | $1.09 | 26d | 1 | 0.93mi |
| 4322 Groton Dr Houston, TX | 3.0 | 1.0 | 858 | $1,395 | $1.63 | 45d | 1 | 1.15mi |
| 2889 Reed Rd Houston, TX | 1.0–2.0 | 1.0–2.0 | 997 | $1,648 | $1.65 | 5d | 2 | 1.18mi |
| 2725 Reed Rd Houston, TX | 1.0–3.0 | 1.0–2.5 | 911 | $975 | $1.07 | 45d | 1 | 1.21mi |
| 4205 Phlox St Unit 2 BEDROOM 6 Houston, TX | 2.0 | 1.0 | 736 | $860 | $1.17 | 20d | 1 | 1.27mi |
| 4207 Phlox St Houston, TX | 2.0 | 1.0 | 736 | $962 | $1.31 | 1d | 2 | 1.29mi |
| 4326 Larkspur St Unit 3 Houston, TX | 2.0 | 1.0 | 800 | $1,200 | $1.50 | 19d | 1 | 1.43mi |
| 11900 Oakmoor Pkwy Houston, TX | 1.0–3.0 | 1.0–2.0 | 892 | $1,469 | $1.65 | 5d | 12 | 1.46mi |
| 11800 City Park Central Ln Unit 11857 Houston, TX | 2.0 | 2.0 | 885 | $1,362 | $1.54 | 45d | 1 | 1.47mi |
| 11800 City Park Central Ln Unit 2162 Houston, TX | 2.0 | 2.0 | 885 | $1,290 | $1.46 | 7d | 1 | 1.47mi |
| 11800 City Park Central Ln Apt 422 Houston, TX | 2.0 | 2.0 | 885 | $1,290 | $1.46 | 9d | 1 | 1.47mi |
| 11800 City Park Central Ln Unit 425 Houston, TX | 2.0 | 2.0 | 885 | $1,325 | $1.50 | 0d | 1 | 1.47mi |
| 11800 City Park Central Ln Unit 2174 Houston, TX | 2.0 | 2.0 | 885 | $1,314 | $1.48 | 13d | 1 | 1.47mi |
| 11806 City Park Central Ln Houston, TX | 2.0 | 2.0 | 1107 | $1,636 | $1.48 | 45d | 1 | 1.47mi |
| 11806 City Park Central Ln Houston, TX | 2.0 | 2.0 | 1107 | $1,636 | $1.48 | 18d | 1 | 1.47mi |
Listing history 15 events
-
2026-06-13days on market $155,000 Pending 82 DOM
-
2026-06-10days on market $155,000 Pending 81 DOM
-
2026-06-08days on market $155,000 Pending 80 DOM
-
2026-06-07days on market $155,000 Pending 79 DOM
-
2026-06-04statusdays on market $155,000 Pending 76 DOM
-
2026-06-01days on market $155,000 Active 73 DOM
-
2026-05-31days on market $155,000 Active 72 DOM
-
2026-05-07price $155,000 635-char remark
Show marketing remark (635 chars)
Move-in ready and beautifully renovated, this 3-bedroom, 1-bath home offers modern updates and a prime location! Featuring a brand-new roof, new water heater, updated gas lines, new plumbing, and a new A/C system for peace of mind. Enjoy modern fixtures, ceiling fans, and new vinyl plank flooring throughout, along with fresh interior and exterior paint for a clean, inviting feel. Located with no HOA, just minutes from NRG Stadium, the Texas Medical Center, and Downtown Houston, with easy access to major highways. Whether you’re a first-time buyer or investor, this home is a great opportunity in a highly desirable area!
-
2026-04-25historical $1,600
-
2026-04-14$1,600
-
2026-04-13price $165,000 635-char remark
Show marketing remark (635 chars)
Move-in ready and beautifully renovated, this 3-bedroom, 1-bath home offers modern updates and a prime location! Featuring a brand-new roof, new water heater, updated gas lines, new plumbing, and a new A/C system for peace of mind. Enjoy modern fixtures, ceiling fans, and new vinyl plank flooring throughout, along with fresh interior and exterior paint for a clean, inviting feel. Located with no HOA, just minutes from NRG Stadium, the Texas Medical Center, and Downtown Houston, with easy access to major highways. Whether you’re a first-time buyer or investor, this home is a great opportunity in a highly desirable area!
-
2026-03-20$175,000 Active 635-char remark
Show marketing remark (635 chars)
Move-in ready and beautifully renovated, this 3-bedroom, 1-bath home offers modern updates and a prime location! Featuring a brand-new roof, new water heater, updated gas lines, new plumbing, and a new A/C system for peace of mind. Enjoy modern fixtures, ceiling fans, and new vinyl plank flooring throughout, along with fresh interior and exterior paint for a clean, inviting feel. Located with no HOA, just minutes from NRG Stadium, the Texas Medical Center, and Downtown Houston, with easy access to major highways. Whether you’re a first-time buyer or investor, this home is a great opportunity in a highly desirable area!
-
2026-01-02soldstatus
-
2026-01-02soldstatus
-
1988-01-01soldstatus
ⓘ Source: listings_history table (triggers on properties + properties_extension) + one-shot
backfill from property_details.listing_events for pre-trigger history.
Tax reassessment forecast TX · Resets to sale price
- Current annual tax
- $1,477 · $123/mo
- Projected year-2 tax
- $2,836 · $236/mo
- Expected delta
- +$1,360/yr (+$113/mo · 92.1%)
ⓘ Screening estimate from a state-policy table — verify with the county assessor before closing.
Climate risk First Street
- Flood 6/10 Major FEMA zone X (shaded) · 70% chance over 30 yrs
- Wildfire 3/10 Moderate
- Heat 9/10 Extreme 7 d/yr ≥109°F today · 23 d/yr by 30 yrs out
- Wind 9/10 Extreme 99% chance of damaging wind over 30 yrs
- Air quality 2/10 Low 2 unhealthy d/yr today · 2 by 30 yrs out
Nearby sold comps map
Loading sold comps map…
Walkable amenities ~0.75 mi
Loading nearby amenities…
Taxation est. · year 1
- Rental income
- $17,330
- − Mortgage interest
- −$8,682
- − Property taxes
- −$1,477
- − Insurance
- −$775
- − Repairs & maintenance
- −$1,386
- − Management
- −$1,386
- − Depreciation
- −$4,509
- Taxable loss
- −$886
- Est. tax savings @ 24.0%
- +$213
- After-tax cash flow
- $1,898/yr
For passive investors: Depreciation is non-cash, so a rental often shows a tax loss while cash-flowing — sheltering income. Rental losses are passive: they offset passive income freely, and up to $25,000/yr can offset ordinary (W-2) income if you actively participate and your MAGI is under $100k (phasing out to $0 by $150k); unused losses carry forward. On sale, claimed depreciation is recaptured at up to 25%, and gains may owe capital-gains tax (a 1031 exchange can defer both). Figures are a year-1 estimate at your 24.0% rate — not tax advice; consult a CPA.
Schools (NCES district)
- District
- Houston ISD
- NCES district ID
- 4823640
- Math proficiency
- 27% ▼ -18.00%
- Reading proficiency
- 35% ▼ -6.00%
- Median HH income
- $46,054
- Composite
- 26.63/100
- National rank
- #7173
- State rank
- #593 of 826 in TX
Livability — Houston
- Score
- 74/100
- State rank
- #184
- US rank
- #4771
Category grades
Schools grade is shown separately in the Schools card above.
Census & demographics
- Census place
- Houston, TX
- County
- Harris County · 4,702,590 people
- City population
- 3,226,434
- Metro
- Houston-The Woodlands-Sugar Land, TX
- Population (ZIP)
- 19,795
- Household income
- $37,415
- Rent vs Own
- Severe rent burden
- 1446.0
Population outlook (Harris County) Hauer SSP2
- Today (2025)
- 5,571,493 people
- By 2030
- 6,089,821 · +9.3%
- By 2040
- 7,142,806 · +28.2%
- By 2050
- 8,185,864 · +46.9%
- By 2075
- 10,574,329 · +89.8%
- By 2100
- 12,109,958 · +117.4%
Race, ethnicity, and origin ACS 2023
- Neighborhood character
- Predominantly Black (77%)
- Race & ethnicity
- Black 77% Hispanic / Latino 16% Two or more races 11% White 3%
- Hispanic origin (detail)
- Mexican 6% Puerto Rican 1%
- Foreign-born
- 8% · Canada, China
- Languages at home
- 88% English-only · Spanish 10%
Political lean MEDSL · Harris
- 2024 margin
- Lean D (+5.5) · D 52.0% · R 46.4% · Other 1.6%
- 2008→2024 swing
- +3.9pp toward D · 2008: 1.6pp · 2024: 5.5pp
- All cycles
- 2024: D+5.5 2020: D+13.3 2016: D+12.4 2012: D+0.1 2008: D+1.6
Not yet ingested
- Civics
- —
Market trends
- HPI YoY
- ▲ 16.02%
- Current HPI
- 180.4283
- Rent YoY
- ▲ 4.77%
- Metro
- Houston-The Woodlands-Sugar Land, TX
- State GDP YoY
- ▲ 3.95%
- F500 in state
- 110
Industry mix (Fortune 500 HQ in TX)
| Industry | F500 HQs | Revenue |
|---|---|---|
| Energy | 16 | $1,198B |
|
||
| Technology | 5 | $198B |
|
||
| Engineering / Construction | 4 | $72B |
|
||
| Energy Services | 3 | $60B |
|
||
| Utilities | 3 | $41B |
|
||
| Healthcare | 2 | $330B |
|
||
Price history
-11.4% since first listed8 events — show timeline
- 2026-05-07 Price Changed $155,000 HARMLS
- 2026-04-25 Rental Removed $1,600 HARMLS
- 2026-04-14 Listed for Rent $1,600 HARMLS
- 2026-04-13 Price Changed $165,000 HARMLS
- 2026-03-20 Listed $175,000 HARMLS
- 2026-01-02 Sold (Public Records) — Public Records
- 2026-01-02 Sold (Public Records) — Public Records
- 1988-01-01 Sold (Public Records) — Public Records
Property tax history
+2.7%/yrLatest (2025): $1,477 · +11.7% YoY. Source: county tax records.
Cash-flow waterfall
monthlySold comps — $/sqft
last 12 mo · ≤1 miLoading sold comps…