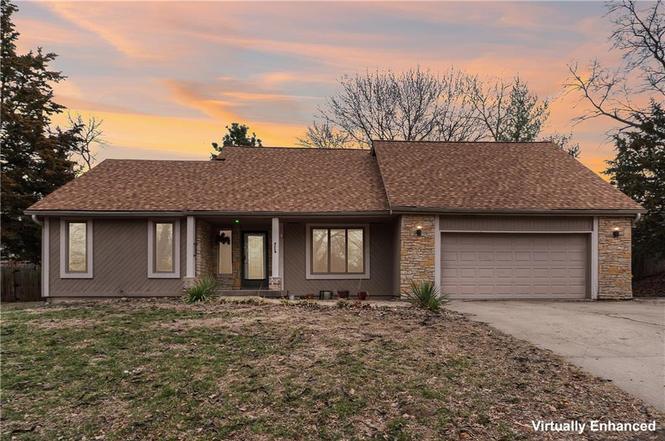
4531 Woodstock St · Shawnee, KS
Flood risk 1/10 · Minimal
- FEMA flood zone
- X (unshaded)
- Chance of flooding over 30 yrs
- 0.0%
- Est. flood insurance / yr
- $473 – $860
Fire risk 2/10 · Minimal
- Est. fire insurance / yr
- $1,154 – $2,142
Heat risk 4/10 · Minor
- Hot days now (above 107°F)
- 7 days/yr
- Hot days in 30 yrs
- 16 days/yr
Wind risk 2/10 · Minimal
- Chance of severe wind over 30 yrs
- —
Air-quality risk 2/10 · Minimal
- Unhealthy air days now
- 2 days/yr
- Unhealthy air days in 30 yrs
- 2 days/yr
Risk factors via First Street. Map © Google.
Why this score? — see what drove the F grade
The composite is a weighted blend of 9 inputs, each scored 0–100. Each bar is that input's sub-score; the figure is the points it added to the 100-point composite (weight × sub-score).
- ARV discount +10.0/15.0
- Cash flow +7.3/30.0
- Schools +4.8/10.0
- Livability +4.4/5.0
- Rent growth +2.5/5.0
- Condition / age +2.5/5.0
- 1% rule +1.9/10.0
- DSCR +1.5/10.0
- Appreciation +0.0/10.0
$385,000
🖨 Deal sheet (PDF) 📄 Offer letter ✓ Due diligence
Listing remarks
PRICE REDUCED — BRING AN OFFER Opportunities like this in Quivira Woods don’t come along often, especially when they combine space, character, and the kind of setting buyers are searching for right now. Tucked into one of western Shawnee’s most desirable pockets, this exceptional 1.5-story home offers warmth, flexibility, and over 3,120 finished square feet designed for real life, featuring 4 bedrooms, 2.5 bathrooms, and 100% hardwood and tile flooring throughout (minus the staircases) for a clean, timeless feel. Natural light fills the open living areas anchored by a cozy hearth-room fireplace, while the eat-in kitchen offers abundant counter space, an electric cooktop, s
Key facts
- 0.48 acre lot
- 2 garage spots
- Built 1978
Property features AI
Exterior
- Parking: Attached garage with garage door opener (2 car)
- Utilities: Public water; Septic tank sewer
- Home design: Single-family residence; 1.5-story floor plan
- Construction: Frame and stone with wood siding; Composition roof
- Exterior features: Patio; Privacy fence; City lot
Interior
- Kitchen: Dishwasher; Disposal; Electric range
- Bedrooms: 4 bedrooms (primary on main level; additional bedrooms on second floor)
- Bathrooms: 2 full bathrooms; 1 half bathroom
- Heating & cooling: Electric heating; Electric cooling
- Interior features: Ceiling fans; Pantry; Vaulted ceilings; Thermal windows; Finished full basement; Hearth room fireplace; Den/Study; Exercise room; Family room; Main floor primary bedroom; Workshop; Eat-in kitchen; Formal dining area
- Laundry & utility: Main-level laundry room
Neighborhood map
What this means for you Summary
Snapshot
- This is a 4-bed/2.5-bath single-family listed at $385k.
Deal economics
- At list price, monthly cash flow is $-512 ($-6k/yr) — negative.
- To cash-flow at today's rent, offer at most $295k (23.5% below list).
- To meet the 1% rule (rent ≥ 1% of price), the offer needs to be $264k (31.3% below list).
- Recommended offer: $264k (31.3% below list) — sets the bar for 1% rule.
- Cap rate 4.7% vs local median 3.2% in Shawnee — top-decile yield for the area; either an underpriced asset or a hidden risk that comps aren't pricing in. Stress-test before assuming the spread holds.
Location & tenants
- Location reads 87/100 on livability (#2 in KS, #276 nationally) — a professional / high-income tenant draw. Strengths: commute A+, employment A+, housing A+.
- De Soto (suburban): math 49% / reading 53% proficiency, ranked #3 of 169 in KS (top 2%) — acceptable for families but not a draw, mixed tenant base, ~2y average lease; only 10% free/reduced lunch — higher-income household profile.
- Zoned schools: Riverview Elementary (math 56% / reading 66%, grade B, #68 of 684 statewide, top 10%, 480 students, 8% FRL); Mill Creek Middle School (math 33% / reading 43%, grade F, #33 of 219 statewide, top 15%, 629 students, 9% FRL); Mill Valley High School (math 41% / reading 40%, grade F, #19 of 327 statewide, top 6%, 1,355 students, 7% FRL) — zoned schools at 8% FRL track the district average.
- Market conditions: 44 active listings in the ZIP; 2 comparable units currently listed for rent nearby; 2,969 units permitted in Johnson County in 2024 (1,066 in 5+ unit buildings).
Forward outlook
- Local home prices are declining (-3.0%/yr); year-one equity from $3k of loan paydown is wiped out by about $12k of value loss. Plan a longer hold.
- Johnson County population projected at +27% by 2050 — long-run rental-demand tailwind backs the buy-and-hold thesis.
Negotiation context
- It's been on market 63 days — a 6% lower offer ($362k) is reasonable based on typical stale-listing flexibility.
- 2 sale attempts; this cycle's ask has dropped $80k (17%) from the opening price — seller is motivated, your offer sets the floor, not the list.
Questions for the listing agent
- What do current leases actually rent for vs. the listed asking? Can we see a recent rent roll and the last 12 months of T-12 income?
- It's been on market 63 days. Have you received any prior offers? Is the seller open to a 31% concession, seller financing, or rate buy-down credit?
- Built in 1978 — when were the roof, HVAC, electrical panel, plumbing, and water heater last replaced?
- Why hasn't it sold? Are there any deal-killer items the seller is aware of (foundation, flood, title, zoning, code violations)?
- Is there a deadline driving the sale (1031 exchange, divorce, estate, relocation)? That informs how much negotiation room exists.
- Schools are B-rated — typically a magnet for longer-tenancy family renters. What's the average tenant stay here, and is there a school-zone premium baked into asking?
- The area grade is low — what's the realistic commute time and amenity access for the typical tenant pool here? Any planned neighborhood developments (good or bad) we should know about?
- What's the average days-on-market for RENTAL listings here right now (not sales)? A rising rental-DOM trend means longer vacancies and softer asking-rent achievability than the comps imply.
- What's the recent tenant-quality profile in this submarket — average credit score on applications, eviction rate, late-payment / NSF rate, and stable-employment percentage? A property-management company in the area should have these aggregated.
- How much new for-sale + rental construction is in the pipeline within 1–3 miles? Heavy new supply typically softens prices + rents 12–24 months out; constrained supply supports both.
Investment metrics
- 1% rule
- 0.69% ✗
- Cap rate
- 4.70%
- Cash-on-cash
- -5.70%
- DSCR
- 0.75
- GRM
- 12.1
CMA / ARV
- ARV (on-the-fly)
- $408,000
- Comps found
- 12
Show comp detail 12 sales within ~0.75 mi
| Address | Dist | Beds/Ba | Sqft | Sold | Price | $/sf | Match |
|---|---|---|---|---|---|---|---|
| 20823 W 45th Ter | 0.05mi | 4/2.5 | 2,186 (+9%) | 6mo | $560,000 | $256 | 77 |
| 21436 W 48th. St | 0.39mi | 4/2.5 | 2,181 (+9%) | 1mo | $420,000 | $193 | 66 |
| 21505 W 50th St | 0.57mi | 3/2.5 (-1) | 1,922 (-4%) | 1mo | $410,000 | $213 | 61 |
| 4811 Mund Rd | 0.42mi | 3/2.5 (-1) | 2,189 (+9%) | 0mo | $425,000 | $194 | 59 |
| 4754 Lakecrest Dr | 0.28mi | 3/2.0 (-1) | 1,760 (-12%) | 6mo | $435,000 | $247 | 55 |
| 651 River Dr | 0.72mi | 4/3.0 | 1,882 (-6%) | 1mo | $335,000 | $178 | 54 |
| 22014 W 47 Ter | 0.73mi | 3/2.5 (-1) | 1,962 (-2%) | 6mo | $400,000 | $204 | 53 |
| 21218 W 51st St | 0.59mi | 4/2.5 | 2,259 (+13%) | 1mo | $470,000 | $208 | 50 |
| 21430 W 51st St | 0.68mi | 4/2.5 | 2,201 (+10%) | 8mo | $429,000 | $195 | 45 |
| 620 River Falls Rd | 0.75mi | 3/2.5 (-1) | 1,864 (-7%) | 5mo | $330,000 | $177 | 45 |
| 860 River Dr | 0.74mi | 4/3.0 | 1,751 (-12%) | 0mo | $365,000 | $208 | 42 |
| 21810 W 49th St | 0.67mi | 4/2.5 | 2,265 (+13%) | 9mo | $440,000 | $194 | 39 |
Match score weights: distance 35% · size 25% · config 20% · recency 20%. Top-matched comps best support the ARV.
Projected returns pro-forma
-3.0% appreciation · 3.0% rent growth · sell at horizon
- IRR
- -26.1%
- Equity multiple
- 0.12×
- Total profit
- $-95,000
- Equity at exit
- $57,405
- IRR
- -22.9%
- Equity multiple
- -0.16×
- Total profit
- $-124,709
- Equity at exit
- $33,288
Cash invested: $107,800 (down + closing). Projections, not guarantees.
Landlord ↔ Tenant lean methodology
- Overall (STATE)
- 83 Strongly Landlord-Friendly
- State Kansas
- 83 Strongly Landlord-Friendly · R+10
- County
- — inherits STATE
- City
- — inherits STATE
ZIP-level market 66218
- Home prices YoY
- -28.8%
- Active inventory
- 44
- Price-to-rent
- 12.1×
Monthly cashflow live
- Estimated rent
- $2,644 medium interval (Pro) →
- Mortgage (P&I)
- −$2,019
- Tax from tax record
- −$422 /mo · $5,062/yr
- Insurance
- −$160
- HOA
- −$0
- Vacancy / Maint / Mgmt
- −$555
- Net cashflow
- $-512
Break-even live
Sensitivity live
| Price | -10% $-294 | -5% $-403 | +0% $-512 | +5% $-621 | +10% $-730 |
|---|---|---|---|---|---|
| Rent | -10% $-721 | -5% $-617 | +0% $-512 | +5% $-408 | +10% $-303 |
| Rate | -1.0pp $-318 | -0.5pp $-414 | base $-512 | +0.5pp $-612 | +1.0pp $-713 |
UW: 25.0% down · 7.5% · 30yr · 1.5% tax · 5.0% vac · 8.0% maint · 8.0% mgmt
Financing live
Cash to close
- Down payment
- $96,250
- Closing costs
- $11,550
- Reserves months
- —
- Total cash needed
- —
Loan-product check · same deal, 3 products live
Conventional
25% down · 7.5% · 30yr
- Down + closing
- —
- Monthly P&I
- —
- Monthly cashflow
- —
- DSCR
- —
- Eligible?
- —
Personal DTI + credit; lowest rate.
DSCR
20% down · 8.5% · 30yr
- Down + closing
- —
- Monthly P&I
- —
- Monthly cashflow
- —
- DSCR
- —
- Eligible?
- —
No personal income docs; deal must DSCR.
Hard money
10% down · 12.0% · 12mo
- Down + closing
- —
- Monthly P&I
- —
- Monthly cashflow
- —
- DSCR
- —
- Eligible?
- —
Short-term bridge; refi at stabilization.
Rent comps 2 comps
| Address | Beds | Baths | Sqft | Rent | $/sqft | DOM | Units | Dist |
|---|---|---|---|---|---|---|---|---|
| 5131 Woodland Dr Shawnee, KS | 3.0 | 3.0 | 1510 | $2,415 | $1.60 | 3d | 1 | 0.77mi |
| 5701 Woodland Dr Shawnee, KS | 3.0 | 2.0 | 2176 | $2,995 | $1.38 | 25d | 1 | 1.43mi |
Listing history 9 events
-
2026-05-03status Pending
-
2026-04-27status Active
-
2026-03-12status Pending
-
2026-03-12historical Active Under Contract
-
2026-03-09price $385,000
-
2026-02-27price $410,000
-
2026-02-04price $440,000
-
2026-01-16$465,000 Active
-
2025-10-09historical $465,000
ⓘ Source: listings_history table (triggers on properties + properties_extension) + one-shot
backfill from property_details.listing_events for pre-trigger history.
Tax reassessment forecast KS · Resets to sale price
- Current annual tax
- $5,062 · $422/mo
- Projected year-2 tax
- $5,428 · $452/mo
- Expected delta
- +$367/yr (+$31/mo · 7.2%)
ⓘ Screening estimate from a state-policy table — verify with the county assessor before closing.
Climate risk First Street
- Flood 1/10 Low FEMA zone X (unshaded) · 0% chance over 30 yrs
- Wildfire 2/10 Low
- Heat 4/10 Moderate 7 d/yr ≥107°F today · 16 d/yr by 30 yrs out
- Wind 2/10 Low
- Air quality 2/10 Low 2 unhealthy d/yr today · 2 by 30 yrs out
Nearby sold comps map
Loading sold comps map…
Walkable amenities ~0.75 mi
Loading nearby amenities…
Taxation est. · year 1
- Rental income
- $31,733
- − Mortgage interest
- −$21,566
- − Property taxes
- −$5,062
- − Insurance
- −$1,925
- − Repairs & maintenance
- −$2,539
- − Management
- −$2,539
- − Depreciation
- −$11,200
- Taxable loss
- −$13,097
- Est. tax savings @ 24.0%
- +$3,143
- After-tax cash flow
- $-3,002/yr
For passive investors: Depreciation is non-cash, so a rental often shows a tax loss while cash-flowing — sheltering income. Rental losses are passive: they offset passive income freely, and up to $25,000/yr can offset ordinary (W-2) income if you actively participate and your MAGI is under $100k (phasing out to $0 by $150k); unused losses carry forward. On sale, claimed depreciation is recaptured at up to 25%, and gains may owe capital-gains tax (a 1031 exchange can defer both). Figures are a year-1 estimate at your 24.0% rate — not tax advice; consult a CPA.
Schools (NCES district)
- District
- De Soto
- NCES district ID
- 2005490
- Math proficiency
- 49% ▼ -1.00%
- Reading proficiency
- 53% ▼ -1.00%
- Median HH income
- $96,361
- Composite
- 48.04/100
- National rank
- #2192
- State rank
- #3 of 169 in KS
Livability — Shawnee
- Score
- 87/100
- State rank
- #2
- US rank
- #276
Category grades
Schools grade is shown separately in the Schools card above.
Census & demographics
- Census place
- Shawnee, KS
- City population
- 60,541
- Population (ZIP)
- 8,796
Population outlook (Johnson County) Hauer SSP2
- Today (2025)
- 663,396 people
- By 2030
- 702,585 · +5.9%
- By 2040
- 775,386 · +16.9%
- By 2050
- 841,772 · +26.9%
- By 2075
- 994,137 · +49.9%
- By 2100
- 1,073,036 · +61.7%
Race, ethnicity, and origin ACS 2023
- Neighborhood character
- Predominantly White (84%)
- Race & ethnicity
- White 84% Black 6% Two or more races 4% Asian 4% Hispanic / Latino 3%
- Common ancestry
- Slovak 4% Iranian 3% Romanian 3%
- Foreign-born
- 7% · Canada
- Languages at home
- 91% English-only · Other Indo-European 2% Spanish 2% Other Asian/Pacific 1%
Political lean MEDSL · Johnson
- 2024 margin
- Lean D (+8.5) · D 53.4% · R 44.9% · Other 1.8%
- 2008→2024 swing
- +17.5pp toward D · 2008: -9.0pp · 2024: 8.5pp
- All cycles
- 2024: D+8.5 2020: D+8.2 2016: R+2.7 2012: R+17.8 2008: R+9.0
Not yet ingested
- Civics
- —
Market trends
- HPI YoY
- ▼ -96.05%
- Current HPI
- 237.3018
- Rent YoY
- —
- Metro
- —
- State GDP YoY
- —
- F500 in state
- 0
Price history
-17.2% since first listed9 events — show timeline
- 2026-05-03 Pending — Heartland MLS as Distributed by MLS Grid
- 2026-04-27 Relisted — Heartland MLS as Distributed by MLS Grid
- 2026-03-12 Pending — Heartland MLS as Distributed by MLS Grid
- 2026-03-12 Contingent — Heartland MLS as Distributed by MLS Grid
- 2026-03-09 Price Changed $385,000 Heartland MLS as Distributed by MLS Grid
- 2026-02-27 Price Changed $410,000 Heartland MLS as Distributed by MLS Grid
- 2026-02-04 Price Changed $440,000 Heartland MLS as Distributed by MLS Grid
- 2026-01-16 Listed $465,000 Heartland MLS as Distributed by MLS Grid
- 2025-10-09 Coming Soon $465,000 Heartland MLS as Distributed by MLS Grid
Property tax history
+4.0%/yrLatest (2025): $5,062 · +15.5% YoY. Source: county tax records.
Cash-flow waterfall
monthlySold comps — $/sqft
last 12 mo · ≤1 miLoading sold comps…