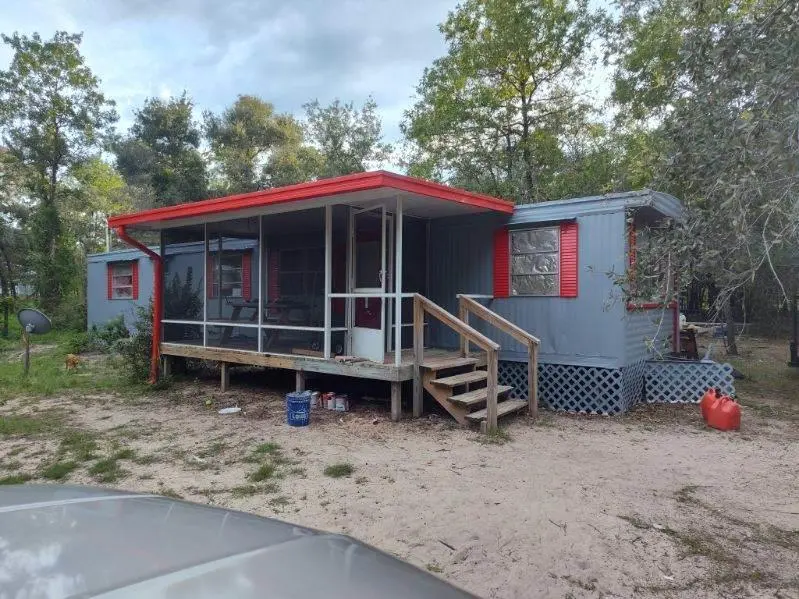
150 NE 139th Ter · Williston Highlands, FL
Flood risk 7/10 · Major
- FEMA flood zone
- X (unshaded)
- Chance of flooding over 30 yrs
- 0.99%
- Est. flood insurance / yr
- $507 – $1,088
Fire risk 3/10 · Minor
- Est. fire insurance / yr
- $947 – $1,759
Heat risk 8/10 · Major
- Hot days now (above 107°F)
- 5 days/yr
- Hot days in 30 yrs
- 17 days/yr
Wind risk 9/10 · Severe
- Chance of severe wind over 30 yrs
- 99.0%
Air-quality risk 2/10 · Minimal
- Unhealthy air days now
- 1 days/yr
- Unhealthy air days in 30 yrs
- 2 days/yr
Risk factors via First Street. Map © Google.
Why this score? — see what drove the B- grade
The composite is a weighted blend of 9 inputs, each scored 0–100. Each bar is that input's sub-score; the figure is the points it added to the 100-point composite (weight × sub-score).
- Cash flow +30.0/30.0
- 1% rule +10.0/10.0
- DSCR +10.0/10.0
- ARV discount +7.5/15.0
- Schools +3.6/10.0
- Livability +2.9/5.0
- Rent growth +2.5/5.0
- Condition / age +2.5/5.0
- Appreciation +0.0/10.0
$75,000
🖨 Deal sheet 📄 Offer letter ✓ Due diligence
Listing remarks
Set on a full acre in Williston, Florida, this 3-bedroom, 1-bathroom mobile home is a solid opportunity for someone looking to take on a renovation project with long-term potential. The wide-open lot gives you plenty of space to work with—whether that means starting a garden, adding outdoor living areas, or expanding the home itself. It's an ideal setup for someone who wants room to grow and the freedom to customize. Located in a quiet part of Levy County, this property offers a blend of privacy and small-town access. Williston is known for its natural springs and peaceful pace of life, with easy access to outdoor spots like Blue Grotto and Devil's Den, both popular with divers and na
Key facts
- Natural springs
- Full acre
- Wide-open lot
Tags
Property features AI
Finance
- Other: Located in the Williston Highlands subdivision
Exterior
- Utilities: Well and private water source
- Home design: Residential mobile home
- Construction: Aluminum siding; Metal roof
- Exterior features: Level and wooded lot
Interior
- Kitchen: Refrigerator
- Bathrooms: 1 full bathroom
- Interior features: Cathedral ceilings; Vaulted ceilings; Crawl space basement
Neighborhood map
What this means for you Summary
Snapshot
- This is a 3-bed/1.0-bath manufactured listed at $75k.
Deal economics
- At list price, monthly cash flow is $729 ($9k/yr) — positive.
- The deal already cash-flows at list — no discount required.
- Meets the 1% rule at list price ($2k rent vs $75k).
- Cap rate 19.0% vs local median 5.9% in Williston Highlands — top-decile yield for the area; either an underpriced asset or a hidden risk that comps aren't pricing in. Stress-test before assuming the spread holds.
Location & tenants
- Location reads 57/100 on livability (#851 in FL) — a working-class tenant base; expect higher turnover. Strengths: crime A+, cost of living A+, housing A+; Watch: employment C-, schools F, amenities F.
- Levy (rural): math 45% / reading 43% proficiency, ranked #54 of 73 in FL (top 74%) — families likely to look elsewhere, expect single-tenant / working-renter base with shorter leases; 62% free/reduced lunch — lower-income household profile, screen leases tightly.
- Market conditions: 358 active listings in the ZIP; 199 units permitted in Levy County in 2024 (0 in 5+ unit buildings).
Forward outlook
- Local home prices are declining (-3.0%/yr); year-one equity from $519 of loan paydown is wiped out by about $2k of value loss. Plan a longer hold.
- Levy County population projected at -28% by 2050 — secular population decline; favor cash flow + early exit over multi-decade hold.
- At projected returns (-3.0% appreciation + 3.0% rent growth), your $21k cash investment doubles in ~3 years — after that, you're playing with house money.
Negotiation context
- Only 4 days on market — expect competitive offers; lowballing is unlikely to land.
- 11 sale attempts since 2y ago with the ask held roughly flat each time — persistent listings suggest the price (not the market) is what's stuck; bring a comps-based counter.
- Current owner paid $43k; list at $75k implies a 75% gain — meaningful room to come down on a strong offer.
Risks & watch-outs
- Watch-outs: flood insurance adds $66/mo.
- Climate carrying-cost: major flood risk; severe wind risk, 99% chance of damaging wind over 30y; extreme-heat days projected 5→17/yr by 2055 (HVAC capex compounding) — expect insurance premiums to compound above CPI over the hold.
Questions for the listing agent
- Built in 1966 — when were the roof, HVAC, electrical panel, plumbing, and water heater last replaced?
- What's the actual annual flood-insurance premium (NFIP or private), and is the property in a SFHA with mandatory coverage?
- Is there a deadline driving the sale (1031 exchange, divorce, estate, relocation)? That informs how much negotiation room exists.
- Schools are F-rated, which usually means shorter tenancies and higher turnover. Who's the typical renter profile here, and what's been the actual vacancy rate?
- What's the average days-on-market for RENTAL listings here right now (not sales)? A rising rental-DOM trend means longer vacancies and softer asking-rent achievability than the comps imply.
- What's the recent tenant-quality profile in this submarket — average credit score on applications, eviction rate, late-payment / NSF rate, and stable-employment percentage? A property-management company in the area should have these aggregated.
- How much new for-sale + rental construction is in the pipeline within 1–3 miles? Heavy new supply typically softens prices + rents 12–24 months out; constrained supply supports both.
Investment metrics
- 1% rule
- 2.19% ✓
- Cap rate
- 19.02%
- Cash-on-cash
- 45.45%
- DSCR
- 3.02
- GRM
- 3.8
CMA / ARV
No comps found within radius.
Projected returns pro-forma
-3.0% appreciation · 3.0% rent growth · sell at horizon
- IRR
- 38.3%
- Equity multiple
- 2.63×
- Total profit
- $34,327
- Equity at exit
- $11,183
- IRR
- 44.8%
- Equity multiple
- 5.28×
- Total profit
- $89,891
- Equity at exit
- $6,485
Cash invested: $21,000 (down + closing). Projections, not guarantees.
Landlord ↔ Tenant lean methodology
- Overall (STATE)
- 87 Strongly Landlord-Friendly
- State Florida
- 87 Strongly Landlord-Friendly · R+3
- County
- — inherits STATE
- City
- — inherits STATE
ZIP-level market 32696
- Home prices YoY
- -6.2%
- Active inventory
- 358
- Price-to-rent
- 3.8×
Monthly cashflow live
- Estimated rent
- $1,639 medium interval (Pro) →
- Mortgage (P&I)
- −$393
- Tax from tax record
- −$75 /mo · $897/yr
- Insurance
- −$31
- Flood insurance flood zone
- −$66 /mo · $798/yr
- HOA
- −$0
- Vacancy / Maint / Mgmt
- −$344
- Net cashflow
- $729
Break-even live
UW: 25.0% down · 7.5% · 30yr · 1.5% tax · 5.0% vac · 8.0% maint · 8.0% mgmt
Financing live
Cash to close
- Down payment
- $18,750
- Closing costs
- $2,250
- Reserves months
- —
- Total cash needed
- —
Loan-product check · same deal, 3 products live
Conventional
25% down · 7.5% · 30yr
- Down + closing
- —
- Monthly P&I
- —
- Monthly cashflow
- —
- DSCR
- —
- Eligible?
- —
Personal DTI + credit; lowest rate.
DSCR
20% down · 8.5% · 30yr
- Down + closing
- —
- Monthly P&I
- —
- Monthly cashflow
- —
- DSCR
- —
- Eligible?
- —
No personal income docs; deal must DSCR.
Hard money
10% down · 12.0% · 12mo
- Down + closing
- —
- Monthly P&I
- —
- Monthly cashflow
- —
- DSCR
- —
- Eligible?
- —
Short-term bridge; refi at stabilization.
Listing history 6 events
-
2026-06-13status $75,000 Pending 4 DOM
-
2026-06-10days on market $75,000 Active 4 DOM
-
2026-06-09days on market $75,000 Active 3 DOM
-
2026-06-08days on market $75,000 Active 2 DOM
-
2026-06-07remarks 693-char remark
-
2026-06-07$75,000 Active 1 DOM
ⓘ Source: listings_history table (triggers on properties + properties_extension) + one-shot
backfill from property_details.listing_events for pre-trigger history.
Tax reassessment forecast FL · Resets to sale price
- Current annual tax
- $897 · $75/mo
- Projected year-2 tax
- $897 · $75/mo
- Expected delta
- $0/yr ($0/mo · -0.0%)
ⓘ Screening estimate from a state-policy table — verify with the county assessor before closing.
Climate risk First Street
- Flood 7/10 Severe FEMA zone X (unshaded) · 99% chance over 30 yrs
- Wildfire 3/10 Moderate
- Heat 8/10 Severe 5 d/yr ≥107°F today · 17 d/yr by 30 yrs out
- Wind 9/10 Extreme 99% chance of damaging wind over 30 yrs
- Air quality 2/10 Low 1 unhealthy d/yr today · 2 by 30 yrs out
Nearby sold comps map
Loading sold comps map…
Walkable amenities ~0.75 mi
Loading nearby amenities…
Taxation est. · year 1
- Rental income
- $19,667
- − Mortgage interest
- −$4,201
- − Property taxes
- −$897
- − Insurance
- −$1,172
- − Repairs & maintenance
- −$1,573
- − Management
- −$1,573
- − Depreciation
- −$2,182
- Taxable income
- $8,067
- Est. tax owed @ 24.0%
- −$1,936
- After-tax cash flow
- $6,811/yr
For passive investors: Depreciation is non-cash, so a rental often shows a tax loss while cash-flowing — sheltering income. Rental losses are passive: they offset passive income freely, and up to $25,000/yr can offset ordinary (W-2) income if you actively participate and your MAGI is under $100k (phasing out to $0 by $150k); unused losses carry forward. On sale, claimed depreciation is recaptured at up to 25%, and gains may owe capital-gains tax (a 1031 exchange can defer both). Figures are a year-1 estimate at your 24.0% rate — not tax advice; consult a CPA.
Schools (NCES district)
- District
- Levy
- NCES district ID
- 1201140
- Math proficiency
- 45% ▼ -8.00%
- Reading proficiency
- 43% ▼ -3.00%
- Median HH income
- $35,254
- Composite
- 36.42/100
- National rank
- #4673
- State rank
- #54 of 73 in FL
Livability — Williston Highlands
- Score
- 57/100
- State rank
- #851
- US rank
- #21745
Category grades
Schools grade is shown separately in the Schools card above.
Census & demographics
- Census place
- Williston Highlands, FL
- Population (ZIP)
- 14,532
Population outlook (Levy County) Hauer SSP2
- Today (2025)
- 36,536 people
- By 2030
- 34,498 · -5.6%
- By 2040
- 30,294 · -17.1%
- By 2050
- 26,368 · -27.8%
- By 2075
- 19,003 · -48.0%
- By 2100
- 13,169 · -64.0%
Race, ethnicity, and origin ACS 2023
- Neighborhood character
- Predominantly White (69%)
- Race & ethnicity
- White 69% Hispanic / Latino 13% Black 13% Two or more races 7%
- Hispanic origin (detail)
- Mexican 3% Puerto Rican 4% Cuban 2%
- Common ancestry
- Slovak 4% Iranian 2% Lithuanian 1%
- Foreign-born
- 6% · Canada, China
- Languages at home
- 89% English-only · Spanish 10% Chinese 1%
Political lean MEDSL · Levy
- 2024 margin
- Solid R (+50.3) · D 24.6% · R 74.8%
- 2008→2024 swing
- -23.3pp toward R · 2008: -26.9pp · 2024: -50.3pp
- All cycles
- 2024: R+50.3 2020: R+45.6 2016: R+44.8 2012: R+32.2 2008: R+26.9
Not yet ingested
- Civics
- —
Market trends
- HPI YoY
- ▼ -21.99%
- Current HPI
- 335.7751
- Rent YoY
- —
- Metro
- —
- State GDP YoY
- ▲ 3.28%
- F500 in state
- 36
Industry mix (Fortune 500 HQ in FL)
| Industry | F500 HQs | Revenue |
|---|---|---|
| Industrial Technology | 2 | $29B |
|
||
| Insurance | 2 | $17B |
|
||
| Retail | 1 | $60B |
|
||
| Technology Distribution | 1 | $58B |
|
||
| Homebuilding | 1 | $35B |
|
||
| Technology Manufacturing | 1 | $35B |
|
||
Price history
+275.0% since first listed29 events — show timeline
- 2026-06-07 Listed $75,000 DGLMLS
- 2026-05-13 Pending — Stellar MLS as Distributed by MLS Grid
- 2026-05-08 Listing Removed — Stellar MLS as Distributed by MLS Grid
- 2026-04-14 Price Changed $75,000 Stellar MLS as Distributed by MLS Grid
- 2026-03-23 Price Changed $78,000 Stellar MLS as Distributed by MLS Grid
- 2026-03-12 Listed $79,000 Stellar MLS as Distributed by MLS Grid
- 2026-01-17 Price Changed $69,900 DGLMLS
- 2025-12-15 Listed $72,500 DGLMLS
- 2025-08-04 Price Changed $69,900 DGLMLS
- 2025-07-19 Price Changed $79,900 DGLMLS
- 2025-05-29 Relisted — DGLMLS
- 2025-05-29 Price Changed $89,900 DGLMLS
- 2025-04-15 Listed $87,500 DGLMLS
- 2025-01-17 Listing Removed — Stellar MLS as Distributed by MLS Grid
- 2025-01-04 Price Changed $75,000 Stellar MLS as Distributed by MLS Grid
- 2024-12-30 Price Changed $55,900 Stellar MLS as Distributed by MLS Grid
- 2024-12-10 Listed $59,900 Stellar MLS as Distributed by MLS Grid
- 2024-10-22 Price Changed $64,900 DGLMLS
- 2024-09-30 Price Changed $69,900 DGLMLS
- 2024-09-09 Price Changed $75,000 DGLMLS
- 2024-08-29 Listed $89,900 DGLMLS
- 2024-08-23 Listed $89,900 DGLMLS
- 2024-07-26 Price Changed $79,000 DGLMLS
- 2024-07-01 Price Changed $85,000 DGLMLS
- 2024-06-27 Relisted — DGLMLS
- 2024-05-28 Listed $97,000 DGLMLS
- 2024-03-22 Sold (MLS) $42,900 DGLMLS
- 2024-03-05 Listed $42,900 DGLMLS
- 2005-09-15 Sold (Public Records) $20,000 Public Records
Property tax history
+9.4%/yrLatest (2025): $897 · +124.9% YoY. Source: county tax records.
Cash-flow waterfall
monthlySold comps — $/sqft
last 12 mo · ≤1 miLoading sold comps…