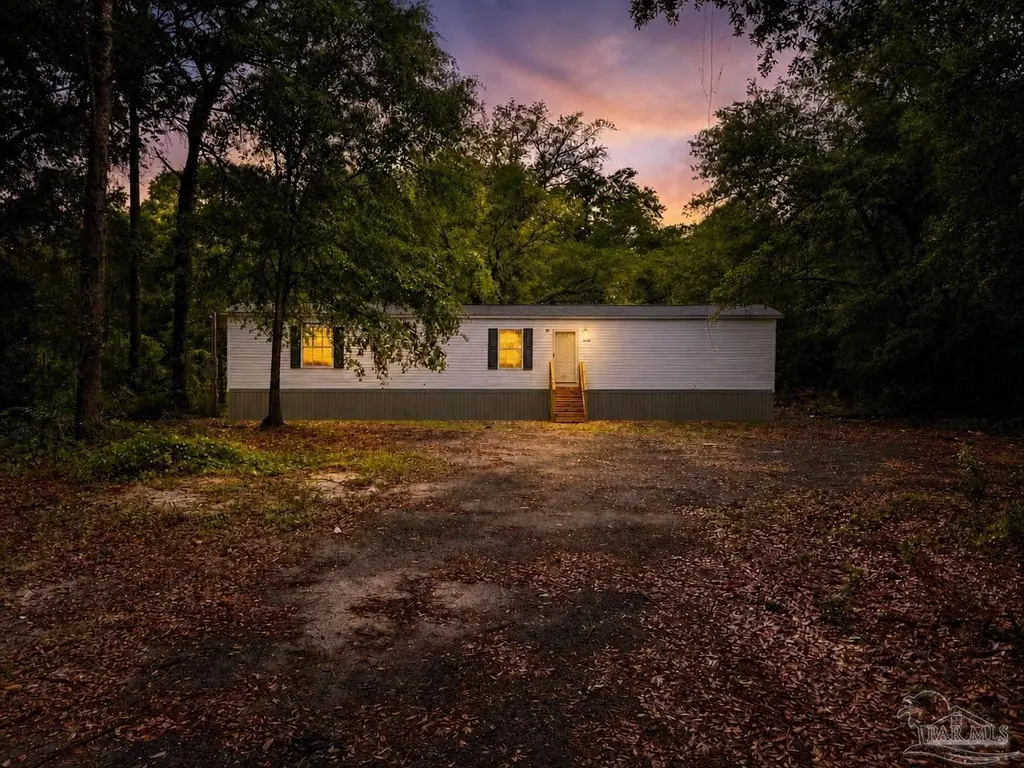
4444 Skylark Rd · East Milton, FL
Flood risk 6/10 · Moderate
- FEMA flood zone
- X (unshaded)
- Chance of flooding over 30 yrs
- 0.74%
- Est. flood insurance / yr
- $507 – $1,088
Fire risk 6/10 · Moderate
- Est. fire insurance / yr
- $947 – $1,759
Heat risk 10/10 · Severe
- Hot days now (above 105°F)
- 7 days/yr
- Hot days in 30 yrs
- 22 days/yr
Wind risk 9/10 · Severe
- Chance of severe wind over 30 yrs
- 99.0%
Air-quality risk 2/10 · Minimal
- Unhealthy air days now
- 0 days/yr
- Unhealthy air days in 30 yrs
- 1 days/yr
Risk factors via First Street. Map © Google.
Why this score? — see what drove the C+ grade
The composite is a weighted blend of 9 inputs, each scored 0–100. Each bar is that input's sub-score; the figure is the points it added to the 100-point composite (weight × sub-score).
- Cash flow +24.9/30.0
- DSCR +8.1/10.0
- ARV discount +7.5/15.0
- 1% rule +6.5/10.0
- Schools +5.3/10.0
- Livability +3.9/5.0
- Rent growth +3.6/5.0
- Condition / age +2.5/5.0
- Appreciation +0.0/10.0
$159,997
🖨 Deal sheet 📄 Offer letter ✓ Due diligence
Listing remarks
Brand New Mobile Home - Modern Living at an Affordable Price! Welcome to 4444 Skylark Rd - a brand new mobile home offering the perfect blend of comfort, style, and affordability. Whether you're looking for a primary residence, a rental investment, or a low-maintenance getaway, this property checks all the boxes. Come inside to an open-concept layout designed for modern living, featuring a bright and spacious living area that flows seamlessly into the kitchen. The kitchen comes equipped with sleek cabinetry, ample counter space, and modern finishes--excellent for both everyday living and entertaining. The home offers a thoughtfully designed split-bedroom floor plan, providing privacy and fu
Key facts
- Split-bedroom layout
- Energy-efficient
- Low maintenance
Tags
Property features AI
Finance
- Other: Lot size approximately 0.46 acres; Building area approximately 1,153 square feet
- HOA & community: No homeowners association
Exterior
- Parking: Open parking; Circular driveway
- Security: Smoke detector(s)
- Utilities: Electric with circuit breakers; Septic tank
- Home design: Mobile/manufactured or modular home; One story; Resale property; New construction
- Construction: Pillar/post/pier foundation; Built using modular/manufactured construction methods
- Exterior features: Shingle roof; Paved road access; Publicly maintained road
Interior
- Kitchen: ENERGY STAR qualified dishwasher; Electric water heater
- Bedrooms: Primary bedroom on the first floor (approx. 14 x 12); Second bedroom on the first floor (approx. 10 x 10); Third bedroom on the first floor (approx. 14 x 9)
- Flooring: Vinyl
- Bathrooms: Two full bathrooms
- Heating & cooling: Central heating; Central cooling with ENERGY STAR qualified equipment; Open-loop geothermal heat pump system
- Interior features: Vinyl flooring; Kitchen and dining combined; Smoke detector(s)
Neighborhood map
What this means for you Summary
Snapshot
- This is a 3-bed/2.0-bath manufactured listed at $160k.
Deal economics
- At list price, monthly cash flow is $342 ($4k/yr) — positive.
- The deal already cash-flows at list — no discount required.
- Meets the 1% rule at list price ($2k rent vs $160k).
- Recommended offer: $155k (3.0% below list) — sets the bar for market timing.
- Cap rate 8.9% vs local median 4.6% in East Milton — top-decile yield for the area; either an underpriced asset or a hidden risk that comps aren't pricing in. Stress-test before assuming the spread holds.
Location & tenants
- Location reads 77/100 on livability (#199 in FL, #3,139 nationally) — a middle-class / working-renter tenant base. Strengths: cost of living A+, housing A+, health & safety A+; Watch: crime C-, amenities C-, commute F.
- Santa Rosa (suburban): math 63% / reading 60% proficiency, ranked #8 of 73 in FL (top 11%) — acceptable for families but not a draw, mixed tenant base, ~2y average lease.
- Market conditions: Rents rising fast (+4.5%/yr); 806 active listings in the ZIP; solid renter incomes; 1,983 units permitted in Santa Rosa County in 2024 (128 in 5+ unit buildings).
Forward outlook
- Local home prices are declining (-3.0%/yr); year-one equity from $1k of loan paydown is wiped out by about $5k of value loss. Plan a longer hold.
- Santa Rosa County population projected at +31% by 2050 — long-run rental-demand tailwind backs the buy-and-hold thesis.
- At projected returns (-3.0% appreciation + 4.5% rent growth), your $45k cash investment doubles in ~10 years — after that, you're playing with house money.
Negotiation context
- It's been on market 43 days — a 3% lower offer ($155k) is reasonable based on typical stale-listing flexibility.
- Current owner paid $18k; list at $160k implies a 814% gain — meaningful room to come down on a strong offer.
Risks & watch-outs
- Climate carrying-cost: major flood risk; severe wind risk, 99% chance of damaging wind over 30y; major wildfire risk; extreme-heat days projected 7→22/yr by 2055 (HVAC capex compounding) — expect insurance premiums to compound above CPI over the hold.
Questions for the listing agent
- It's been on market 43 days. Have you received any prior offers? Is the seller open to a 3% concession, seller financing, or rate buy-down credit?
- Is there a deadline driving the sale (1031 exchange, divorce, estate, relocation)? That informs how much negotiation room exists.
- Schools are B-rated — typically a magnet for longer-tenancy family renters. What's the average tenant stay here, and is there a school-zone premium baked into asking?
- What's the average days-on-market for RENTAL listings here right now (not sales)? A rising rental-DOM trend means longer vacancies and softer asking-rent achievability than the comps imply.
- What's the recent tenant-quality profile in this submarket — average credit score on applications, eviction rate, late-payment / NSF rate, and stable-employment percentage? A property-management company in the area should have these aggregated.
- How much new for-sale + rental construction is in the pipeline within 1–3 miles? Heavy new supply typically softens prices + rents 12–24 months out; constrained supply supports both.
Investment metrics
- 1% rule
- 1.15% ✓
- Cap rate
- 8.86%
- Cash-on-cash
- 9.17%
- DSCR
- 1.41
- GRM
- 7.3
CMA / ARV
No comps found within radius.
Projected returns pro-forma
-3.0% appreciation · 4.53% rent growth · sell at horizon
- IRR
- -0.7%
- Equity multiple
- 0.97×
- Total profit
- $-1,235
- Equity at exit
- $23,856
- IRR
- 10.5%
- Equity multiple
- 1.88×
- Total profit
- $39,235
- Equity at exit
- $13,834
Cash invested: $44,799 (down + closing). Projections, not guarantees.
Landlord ↔ Tenant lean methodology
- Overall (STATE)
- 87 Strongly Landlord-Friendly
- State Florida
- 87 Strongly Landlord-Friendly · R+3
- County
- — inherits STATE
- City
- — inherits STATE
ZIP-level market 32583
- Home prices YoY
- -11.3%
- Rents YoY
- 4.5%
- Active inventory
- 806
- Price-to-rent
- 7.3×
Monthly cashflow live
- Estimated rent
- $1,833 medium interval (Pro) →
- Mortgage (P&I)
- −$839
- Tax est. 1.5%
- −$200 /mo · $2,400/yr
- Insurance
- −$67
- HOA
- −$0
- Vacancy / Maint / Mgmt
- −$385
- Net cashflow
- $342
Break-even live
UW: 25.0% down · 7.5% · 30yr · 1.5% tax · 5.0% vac · 8.0% maint · 8.0% mgmt
Financing live
Cash to close
- Down payment
- $39,999
- Closing costs
- $4,800
- Reserves months
- —
- Total cash needed
- —
Loan-product check · same deal, 3 products live
Conventional
25% down · 7.5% · 30yr
- Down + closing
- —
- Monthly P&I
- —
- Monthly cashflow
- —
- DSCR
- —
- Eligible?
- —
Personal DTI + credit; lowest rate.
DSCR
20% down · 8.5% · 30yr
- Down + closing
- —
- Monthly P&I
- —
- Monthly cashflow
- —
- DSCR
- —
- Eligible?
- —
No personal income docs; deal must DSCR.
Hard money
10% down · 12.0% · 12mo
- Down + closing
- —
- Monthly P&I
- —
- Monthly cashflow
- —
- DSCR
- —
- Eligible?
- —
Short-term bridge; refi at stabilization.
Listing history 21 events
-
2026-06-18status $159,997 Pending 43 DOM
-
2026-06-18days on market $159,997 Active 43 DOM
-
2026-06-17days on market $159,997 Active 42 DOM
-
2026-06-16days on market $159,997 Active 41 DOM
-
2026-06-15days on market $159,997 Active 40 DOM
-
2026-06-14days on market $159,997 Active 38 DOM
-
2026-06-10days on market $159,997 Active 35 DOM
-
2026-06-09days on market $159,997 Active 34 DOM
-
2026-06-08days on market $159,997 Active 33 DOM
-
2026-06-07days on market $159,997 Active 32 DOM
-
2026-06-05days on market $159,997 Active 29 DOM
-
2026-06-03days on market $159,997 Active 28 DOM
-
2026-06-02days on market $159,997 Active 27 DOM
-
2026-06-01days on market $159,997 Active 26 DOM
-
2026-05-31days on market $159,997 Active 25 DOM
-
2026-05-31days on market $159,997 Active 24 DOM
-
2026-05-21price $162,500
-
2026-05-06$164,500 Active
-
2016-12-13soldstatus $17,500
-
2016-02-24soldstatus $5,100
-
2013-05-24soldstatus $36,000
ⓘ Source: listings_history table (triggers on properties + properties_extension) + one-shot
backfill from property_details.listing_events for pre-trigger history.
Climate risk First Street
- Flood 6/10 Major FEMA zone X (unshaded) · 74% chance over 30 yrs
- Wildfire 6/10 Major
- Heat 10/10 Extreme 7 d/yr ≥105°F today · 22 d/yr by 30 yrs out
- Wind 9/10 Extreme 99% chance of damaging wind over 30 yrs
- Air quality 2/10 Low 0 unhealthy d/yr today · 1 by 30 yrs out
Nearby sold comps map
Loading sold comps map…
Walkable amenities ~0.75 mi
Loading nearby amenities…
Taxation est. · year 1
- Rental income
- $21,995
- − Mortgage interest
- −$8,962
- − Property taxes
- −$2,400
- − Insurance
- −$800
- − Repairs & maintenance
- −$1,760
- − Management
- −$1,760
- − Depreciation
- −$4,654
- Taxable income
- $1,659
- Est. tax owed @ 24.0%
- −$398
- After-tax cash flow
- $3,709/yr
For passive investors: Depreciation is non-cash, so a rental often shows a tax loss while cash-flowing — sheltering income. Rental losses are passive: they offset passive income freely, and up to $25,000/yr can offset ordinary (W-2) income if you actively participate and your MAGI is under $100k (phasing out to $0 by $150k); unused losses carry forward. On sale, claimed depreciation is recaptured at up to 25%, and gains may owe capital-gains tax (a 1031 exchange can defer both). Figures are a year-1 estimate at your 24.0% rate — not tax advice; consult a CPA.
Schools (NCES district)
- District
- Santa Rosa
- NCES district ID
- 1201650
- Math proficiency
- 63% ▼ -6.00%
- Reading proficiency
- 60% ▼ -5.00%
- Median HH income
- $58,161
- Composite
- 53.12/100
- National rank
- #1511
- State rank
- #8 of 73 in FL
Livability — East Milton
- Score
- 77/100
- State rank
- #199
- US rank
- #3139
Category grades
Schools grade is shown separately in the Schools card above.
Census & demographics
- Census place
- East Milton, FL
- County
- Santa Rosa County · 194,764 people
- City population
- 31,415
- Metro
- Pensacola-Ferry Pass-Brent, FL
- Population (ZIP)
- 31,828
- Household income
- $85,440
- Rent vs Own
- Severe rent burden
- 122.0
Population outlook (Santa Rosa County) Hauer SSP2
- Today (2025)
- 195,978 people
- By 2030
- 209,782 · +7.0%
- By 2040
- 235,293 · +20.1%
- By 2050
- 256,408 · +30.8%
- By 2075
- 298,074 · +52.1%
- By 2100
- 303,216 · +54.7%
Race, ethnicity, and origin ACS 2023
- Neighborhood character
- Predominantly White (74%)
- Race & ethnicity
- White 74% Black 11% Two or more races 10% Hispanic / Latino 6% Asian 1%
- Hispanic origin (detail)
- Mexican 3% Puerto Rican 2% Cuban 1%
- Common ancestry
- Italian 3% Slovak 2% Serbian 2%
- Foreign-born
- 3% · Canada
- Languages at home
- 94% English-only · Spanish 3%
Political lean MEDSL · Santa Rosa
- 2024 margin
- Solid R (+51.0) · D 24.1% · R 75.0%
- 2008→2024 swing
- -3.0pp toward R · 2008: -47.9pp · 2024: -51.0pp
- All cycles
- 2024: R+51.0 2020: R+46.5 2016: R+53.5 2012: R+52.6 2008: R+47.9
Not yet ingested
- Civics
- —
Market trends
- HPI YoY
- ▼ -38.35%
- Current HPI
- 301.8819
- Rent YoY
- ▲ 4.53%
- Metro
- Pensacola-Ferry Pass-Brent, FL
- State GDP YoY
- ▲ 3.28%
- F500 in state
- 36
Industry mix (Fortune 500 HQ in FL)
| Industry | F500 HQs | Revenue |
|---|---|---|
| Industrial Technology | 2 | $29B |
|
||
| Insurance | 2 | $17B |
|
||
| Retail | 1 | $60B |
|
||
| Technology Distribution | 1 | $58B |
|
||
| Homebuilding | 1 | $35B |
|
||
| Technology Manufacturing | 1 | $35B |
|
||
Price history
+351.4% since first listed5 events — show timeline
- 2026-05-21 Price Changed $162,500 PARMLS
- 2026-05-06 Listed $164,500 PARMLS
- 2016-12-13 Sold (Public Records) $17,500 Public Records
- 2016-02-24 Sold (Public Records) $5,100 Public Records
- 2013-05-24 Sold (Public Records) $36,000 Public Records
Property tax history
+3.6%/yrLatest (2025): $319 · +13.8% YoY. Source: county tax records.
Cash-flow waterfall
monthlySold comps — $/sqft
last 12 mo · ≤1 miLoading sold comps…