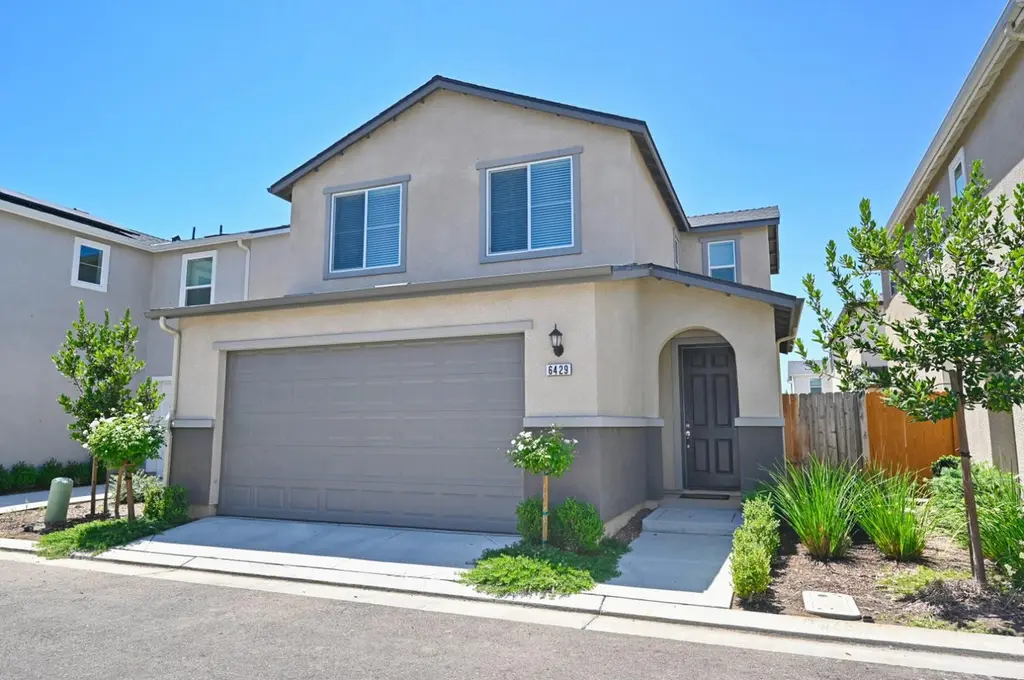
6429 E Moscato Dr · Fresno, CA
Flood risk 1/10 · Minimal
- FEMA flood zone
- X (shaded)
- Chance of flooding over 30 yrs
- 0.0%
- Est. flood insurance / yr
- $507 – $1,088
Fire risk 6/10 · Moderate
- Est. fire insurance / yr
- $659 – $1,223
Heat risk 8/10 · Major
- Hot days now (above 105°F)
- 7 days/yr
- Hot days in 30 yrs
- 16 days/yr
Wind risk 1/10 · Minimal
- Chance of severe wind over 30 yrs
- —
Air-quality risk 10/10 · Severe
- Unhealthy air days now
- 57 days/yr
- Unhealthy air days in 30 yrs
- 60 days/yr
Risk factors via First Street. Map © Google.
Why this score? — see what drove the D grade
The composite is a weighted blend of 9 inputs, each scored 0–100. Each bar is that input's sub-score; the figure is the points it added to the 100-point composite (weight × sub-score).
- ARV discount +10.6/15.0
- Cash flow +9.8/30.0
- Schools +5.9/10.0
- Rent growth +3.2/5.0
- Livability +3.1/5.0
- 1% rule +3.0/10.0
- DSCR +2.8/10.0
- Condition / age +2.5/5.0
- Appreciation +0.0/10.0
$399,950
🖨 Deal sheet 📄 Offer letter ✓ Due diligence
Listing remarks MLS
Rates are up! We're here to help! Seller to include Up To $15,000 closing costs credit to pay closing costs and apply towards interest rate buy-down when using preferred lender! **Contact agent for details as restrictions apply. In addition, this Turn Key product includes Washer/Dryer/Refrigerator & 2 Fauxwood Blinds! You can view the model homes located at 6538 East Hammond Ave, Fresno, Ca 93727 (Olive & Armstrong). Come see us in person or call to get the details! The community will be gated and will have a community pool for next summer! *Some photos reflect renderings of the exterior of the home and may not reflect the exact exterior color scheme you will be getting. Contact sales agent for specific details. www.TheAveWilson.com
Key facts
- Paid solar
- Community clubhouse
- Gated communities
Tags
Property features AI
Finance
- HOA & community: Community association with monthly fee of $135; Association amenities include pool and spa/hot tub
Exterior
- Parking: 2-car garage
- Security: Gated community
- Utilities: Electric service on; Public sewer; Public utilities
- Home design: Single family residence
- Construction: Stucco exterior; Composition roof; Concrete foundation; Built with public records living area
- Exterior features: Two-story; Community in-ground pool; Urban lot setting; Solar installed
Interior
- Bathrooms: 2.5 bathrooms
- Heating & cooling: Central heat and central air
- Interior features: Central heating and cooling; Laundry located inside in a laundry closet
- Laundry & utility: Inside laundry with a laundry closet
Neighborhood map
What this means for you Summary
Snapshot
- This is a 3-bed/3.0-bath single-family listed at $400k.
Deal economics
- At list price, monthly cash flow is $-257 ($-3k/yr) — negative.
- To cash-flow at today's rent, offer at most $354k (11.4% below list).
- To meet the 1% rule (rent ≥ 1% of price), the offer needs to be $320k (19.9% below list).
- Recommended offer: $320k (19.9% below list) — sets the bar for 1% rule.
- Cap rate 5.5% vs local median 3.7% in Fresno — top-decile yield for the area; either an underpriced asset or a hidden risk that comps aren't pricing in. Stress-test before assuming the spread holds.
Location & tenants
- Location reads 62/100 on livability (#469 in CA) — a middle-class / working-renter tenant base. Strengths: commute A+, housing A+; Watch: amenities D+, employment D+, crime F.
- Clovis Unified (suburban): math 58% / reading 72% proficiency, ranked #152 of 1,400 in CA (top 11%) — acceptable for families but not a draw, mixed tenant base, ~2y average lease.
- Zoned schools: Virginia R. Boris Elementary (740 students, 53% FRL); Reyburn Intermediate (1,643 students, 58% FRL); Clovis East High (2,768 students, 56% FRL) — zoned schools average 56% FRL vs 32% district-wide (24 pts higher); higher-poverty schools than district average — tighter screening recommended.
- Market conditions: Rents rising (+3.0%/yr); 327 active listings in the ZIP; 16 comparable units currently listed for rent nearby; rentals at typical pace (median 24d on market — plan ~3-4 weeks tenant-placement turnaround); solid renter incomes; 2,426 units permitted in Fresno County in 2024 (296 in 5+ unit buildings).
- This rent runs 44% of the median local income ($87k/yr) — at the standard rent-burdened threshold; future hikes will face affordability resistance.
Forward outlook
- Local home prices are declining (-3.0%/yr); year-one equity from $3k of loan paydown is wiped out by about $12k of value loss. Plan a longer hold.
- Fresno County population projected at +11% by 2050 — modest demand growth; plan on rents tracking national, not racing it.
Negotiation context
- Only 12 days on market — expect competitive offers; lowballing is unlikely to land.
- 2 sale attempts since 4y ago with the ask held roughly flat each time — persistent listings suggest the price (not the market) is what's stuck; bring a comps-based counter.
Risks & watch-outs
- Climate carrying-cost: major wildfire risk; extreme-heat days projected 7→16/yr by 2055 (HVAC capex compounding) — expect insurance premiums to compound above CPI over the hold.
Questions for the listing agent
- What do current leases actually rent for vs. the listed asking? Can we see a recent rent roll and the last 12 months of T-12 income?
- What does the HOA fee cover, when was the last increase, and are there any pending special assessments or reserve-fund shortfalls?
- Is there a deadline driving the sale (1031 exchange, divorce, estate, relocation)? That informs how much negotiation room exists.
- Schools are D-rated, which usually means shorter tenancies and higher turnover. Who's the typical renter profile here, and what's been the actual vacancy rate?
- Crime grade is F in this area — have there been break-ins, vandalism, or insurance claims at this property in the last 3 years? What carrier currently insures it and at what premium?
- The area grade is low — what's the realistic commute time and amenity access for the typical tenant pool here? Any planned neighborhood developments (good or bad) we should know about?
- What's the average days-on-market for RENTAL listings here right now (not sales)? A rising rental-DOM trend means longer vacancies and softer asking-rent achievability than the comps imply.
- What's the recent tenant-quality profile in this submarket — average credit score on applications, eviction rate, late-payment / NSF rate, and stable-employment percentage? A property-management company in the area should have these aggregated.
- How much new for-sale + rental construction is in the pipeline within 1–3 miles? Heavy new supply typically softens prices + rents 12–24 months out; constrained supply supports both.
Investment metrics
- 1% rule
- 0.80% ✗
- Cap rate
- 5.52%
- Cash-on-cash
- -2.76%
- DSCR
- 0.88
- GRM
- 10.4
CMA / ARV
- ARV (on-the-fly)
- $429,142
- Comps found
- 12
Show comp detail 12 sales within ~0.75 mi
| Address | Dist | Beds/Ba | Sqft | Sold | Price | $/sf | Match |
|---|---|---|---|---|---|---|---|
| 6543 E Cresthaven Dr | 0.22mi | 3/2.5 | 1,402 (-1%) | 0mo | $411,820 | $294 | 85 |
| 2128 N Autumnglo Dr | 0.24mi | 3/2.5 | 1,402 (-1%) | 0mo | $410,820 | $293 | 84 |
| 6591 E Cresthaven Dr | 0.25mi | 3/2.5 | 1,402 (-1%) | 0mo | $403,099 | $288 | 84 |
| 6604 E Clingstone Dr | 0.27mi | 3/2.5 | 1,402 (-1%) | 1mo | $407,820 | $291 | 83 |
| 6527 E Cresthaven Dr | 0.18mi | 3/2.5 | 1,227 (-14%) | 0mo | $394,300 | $321 | 66 |
| 6575 E Cresthaven Dr | 0.19mi | 3/2.5 | 1,227 (-14%) | 0mo | $370,300 | $302 | 66 |
| 6576 E Clingstone Dr | 0.20mi | 3/2.5 | 1,227 (-14%) | 1mo | $370,300 | $302 | 65 |
| 6544 E Blushing Dr | 0.22mi | 3/2.5 | 1,227 (-14%) | 1mo | $385,300 | $314 | 64 |
| 6567 E Cresthaven Dr | 0.24mi | 3/2.5 | 1,227 (-14%) | 0mo | $387,300 | $316 | 64 |
| 6584 E Clingstone Dr | 0.24mi | 3/2.5 | 1,227 (-14%) | 1mo | $385,300 | $314 | 63 |
| 6551 E Cresthaven Dr | 0.25mi | 3/2.5 | 1,227 (-14%) | 0mo | $385,300 | $314 | 63 |
| 2760 N Sophie Dr | 0.52mi | 3/2.8 | 1,589 (+12%) | 0mo | $398,000 | $250 | 55 |
Match score weights: distance 35% · size 25% · config 20% · recency 20%. Top-matched comps best support the ARV.
Projected returns pro-forma
-3.0% appreciation · 2.95% rent growth · sell at horizon
- IRR
- -20.9%
- Equity multiple
- 0.27×
- Total profit
- $-81,298
- Equity at exit
- $59,634
- IRR
- -14.4%
- Equity multiple
- 0.18×
- Total profit
- $-92,303
- Equity at exit
- $34,580
Cash invested: $111,986 (down + closing). Projections, not guarantees.
Landlord ↔ Tenant lean methodology
- Overall (STATE)
- 18 Strongly Tenant-Friendly
- State California
- 18 Strongly Tenant-Friendly · D+13
- County
- — inherits STATE
- City
- — inherits STATE
ZIP-level market 93727
- Rents YoY
- 3.0%
- Active inventory
- 327
- Price-to-rent
- 10.4×
Monthly cashflow live
- Estimated rent
- $3,203 high interval (Pro) →
- Mortgage (P&I)
- −$2,097
- Tax from tax record
- −$389 /mo · $4,665/yr
- Insurance
- −$167
- HOA
- −$135
- Vacancy / Maint / Mgmt
- −$673
- Net cashflow
- $-257
Break-even live
UW: 25.0% down · 7.5% · 30yr · 1.5% tax · 5.0% vac · 8.0% maint · 8.0% mgmt
Financing live
Cash to close
- Down payment
- $99,988
- Closing costs
- $11,998
- Reserves months
- —
- Total cash needed
- —
Loan-product check · same deal, 3 products live
Conventional
25% down · 7.5% · 30yr
- Down + closing
- —
- Monthly P&I
- —
- Monthly cashflow
- —
- DSCR
- —
- Eligible?
- —
Personal DTI + credit; lowest rate.
DSCR
20% down · 8.5% · 30yr
- Down + closing
- —
- Monthly P&I
- —
- Monthly cashflow
- —
- DSCR
- —
- Eligible?
- —
No personal income docs; deal must DSCR.
Hard money
10% down · 12.0% · 12mo
- Down + closing
- —
- Monthly P&I
- —
- Monthly cashflow
- —
- DSCR
- —
- Eligible?
- —
Short-term bridge; refi at stabilization.
Rent comps 16 comps
| Address | Beds | Baths | Sqft | Rent | $/sqft | DOM | Units | Dist |
|---|---|---|---|---|---|---|---|---|
| 6446 E Meritage Dr Fresno, CA | 3.0 | 2.5 | 1652 | $4,195 | $2.54 | 44d | 1 | 0.01mi |
| 2400 N Armstrong Ave Fresno, CA | 3.0 | 3.0 | 1400 | $900 | $0.64 | 44d | 1 | 0.16mi |
| 6609 E Carmen Ave Fresno, CA | 3.0 | 2.0 | 1782 | $2,650 | $1.49 | 3d | 1 | 0.36mi |
| 6050 E Princeton Ave Fresno, CA | 2.0 | 2.0 | 1091 | $2,195 | $2.01 | 3d | 1 | 0.63mi |
| 6563 E Tobey Ave Fresno, CA | 4.0 | 2.0 | 1794 | $4,695 | $2.62 | 44d | 1 | 0.63mi |
| 5965 E Shields Ave #177 Fresno, CA | 2.0 | 2.0 | 1104 | $1,550 | $1.40 | 15d | 1 | 0.89mi |
| 7170 E Amherst Ave Fresno, CA | 3.0 | 2.0 | 1635 | $2,595 | $1.59 | 15d | 1 | 0.93mi |
| 2851 N Janice Ave Fresno, CA | 3.0 | 2.0 | 1341 | $2,395 | $1.79 | 24d | 1 | 0.94mi |
| 6102 E Giavanna Ave Fresno, CA | 3.0 | 2.0 | 1343 | $2,600 | $1.94 | 44d | 1 | 1.24mi |
| 5910 E Robinson Ave Fresno, CA | 3.0 | 1.0 | 1100 | $2,050 | $1.86 | 3d | 1 | 1.26mi |
| 3462 N Clover Ave Fresno, CA | 3.0 | 2.0 | 1787 | $2,400 | $1.34 | 24d | 1 | 1.27mi |
| 3684 N Shelly Ave Fresno, CA | 4.0 | 3.0 | 1816 | $2,850 | $1.57 | 24d | 1 | 1.41mi |
| 7399 E Giavanna Ave Fresno, CA | 3.0 | 2.5 | 1703 | $2,250 | $1.32 | 44d | 1 | 1.45mi |
| 6052 E Bishop Ln Fresno, CA | 3.0 | 2.5 | 1579 | $2,250 | $1.42 | 21d | 1 | 1.48mi |
| 3675 Sunnyside Ave Clovis, CA | 3.0 | 2.0 | 1455 | $2,195 | $1.51 | 44d | 1 | 1.49mi |
| 6193 E Brick Dr Fresno, CA | 3.0 | 2.5 | 1512 | $2,395 | $1.58 | 20d | 1 | 1.50mi |
HOA detail
- Monthly dues
- $135 · $1,620/yr
- Likely covers
- poolsecurity
Listing history 11 events
-
2026-06-18days on market $399,950 Active 12 DOM
-
2026-06-17days on market $399,950 Active 11 DOM
-
2026-06-16days on market $399,950 Active 10 DOM
-
2026-06-15days on market $399,950 Active 9 DOM
-
2026-06-13days on market $399,950 Active 7 DOM
-
2026-06-13days on market $399,950 Active 6 DOM
-
2026-06-10days on market $399,950 Active 4 DOM
-
2026-06-09days on market $399,950 Active 3 DOM
-
2026-06-08days on market $399,950 Active 2 DOM
-
2026-06-07remarks 699-char remark
-
2026-06-07$399,950 Active 1 DOM
ⓘ Source: listings_history table (triggers on properties + properties_extension) + one-shot
backfill from property_details.listing_events for pre-trigger history.
Tax reassessment forecast CA · Resets to sale price
- Current annual tax
- $4,665 · $389/mo
- Projected year-2 tax
- $4,665 · $389/mo
- Expected delta
- $0/yr ($0/mo · 0.0%)
ⓘ Screening estimate from a state-policy table — verify with the county assessor before closing.
Climate risk First Street
- Flood 1/10 Low FEMA zone X (shaded) · 0% chance over 30 yrs
- Wildfire 6/10 Major
- Heat 8/10 Severe 7 d/yr ≥105°F today · 16 d/yr by 30 yrs out
- Wind 1/10 Low
- Air quality 10/10 Extreme 57 unhealthy d/yr today · 60 by 30 yrs out
Nearby sold comps map
Loading sold comps map…
Walkable amenities ~0.75 mi
Loading nearby amenities…
Taxation est. · year 1
- Rental income
- $38,436
- − Mortgage interest
- −$22,403
- − Property taxes
- −$4,665
- − Insurance
- −$2,000
- − Repairs & maintenance
- −$3,075
- − Management
- −$3,075
- − HOA
- −$1,620
- − Depreciation
- −$11,635
- Taxable loss
- −$10,036
- Est. tax savings @ 24.0%
- +$2,409
- After-tax cash flow
- $-680/yr
For passive investors: Depreciation is non-cash, so a rental often shows a tax loss while cash-flowing — sheltering income. Rental losses are passive: they offset passive income freely, and up to $25,000/yr can offset ordinary (W-2) income if you actively participate and your MAGI is under $100k (phasing out to $0 by $150k); unused losses carry forward. On sale, claimed depreciation is recaptured at up to 25%, and gains may owe capital-gains tax (a 1031 exchange can defer both). Figures are a year-1 estimate at your 24.0% rate — not tax advice; consult a CPA.
Schools (NCES district)
- District
- Clovis Unified
- NCES district ID
- 0609030
- Math proficiency
- 58% ▲ 1.00%
- Reading proficiency
- 72% ▲ 2.00%
- Median HH income
- $71,950
- Composite
- 58.7/100
- National rank
- #2003
- State rank
- #152 of 1400 in CA
Livability — Fresno
- Score
- 62/100
- State rank
- #469
- US rank
- #15907
Category grades
Schools grade is shown separately in the Schools card above.
Census & demographics
- Census place
- Fresno, CA
- County
- Fresno County · 834,801 people
- City population
- 593,114
- Metro
- Fresno, CA
- Population (ZIP)
- 84,107
- Household income
- $87,466
- Rent vs Own
- Severe rent burden
- 2745.0
Population outlook (Fresno County) Hauer SSP2
- Today (2025)
- 1,042,971 people
- By 2030
- 1,072,198 · +2.8%
- By 2040
- 1,122,408 · +7.6%
- By 2050
- 1,157,251 · +11.0%
- By 2075
- 1,182,575 · +13.4%
- By 2100
- 1,105,899 · +6.0%
Race, ethnicity, and origin ACS 2023
- Neighborhood character
- Diverse neighborhood (Simpson 0.68)
- Race & ethnicity
- Hispanic / Latino 46% Asian 27% Two or more races 22% White 18% Black 5% Native American 2%
- Hispanic origin (detail)
- Mexican 42%
- Common ancestry
- Russian 1% Slovak 1% Portuguese 1%
- Foreign-born
- 22% · Canada, China, Vietnam
- Languages at home
- 54% English-only · Spanish 25% Other Asian/Pacific 13% Other Indo-European 6%
Political lean MEDSL · Fresno
- 2024 margin
- Toss-up / Even · D 46.5% · R 50.9% · Other 2.6%
- 2008→2024 swing
- -6.5pp toward R · 2008: 2.1pp · 2024: -4.4pp
- All cycles
- 2024: R+4.4 2020: D+7.8 2016: D+3.9 2012: R+2.9 2008: D+2.1
Not yet ingested
- Civics
- —
Market trends
- HPI YoY
- ▼ -317.54%
- Current HPI
- 379.1959
- Rent YoY
- ▲ 2.95%
- Metro
- Fresno, CA
- State GDP YoY
- ▲ 3.21%
- F500 in state
- 116
Industry mix (Fortune 500 HQ in CA)
| Industry | F500 HQs | Revenue |
|---|---|---|
| Technology | 27 | $1,492B |
|
||
| Financial Services | 3 | $174B |
|
||
| Retail | 3 | $44B |
|
||
| Insurance | 3 | $26B |
|
||
| Media / Entertainment | 2 | $115B |
|
||
| Pharmaceuticals / Biotech | 2 | $62B |
|
||
Price history
+6.1% since first listed6 events — show timeline
- 2026-06-06 Listed $399,950 FRESNOMLS
- 2023-05-02 Sold (MLS) $364,990 FRESNOMLS
- 2022-12-29 Pending — FRESNOMLS
- 2022-12-06 Price Changed $364,990 FRESNOMLS
- 2022-12-03 Price Changed $369,990 FRESNOMLS
- 2022-11-20 Listed $376,990 FRESNOMLS
Property tax history
+102.2%/yrLatest (2025): $4,665 · +1.8% YoY. Source: county tax records.
Cash-flow waterfall
monthlySold comps — $/sqft
last 12 mo · ≤1 miLoading sold comps…