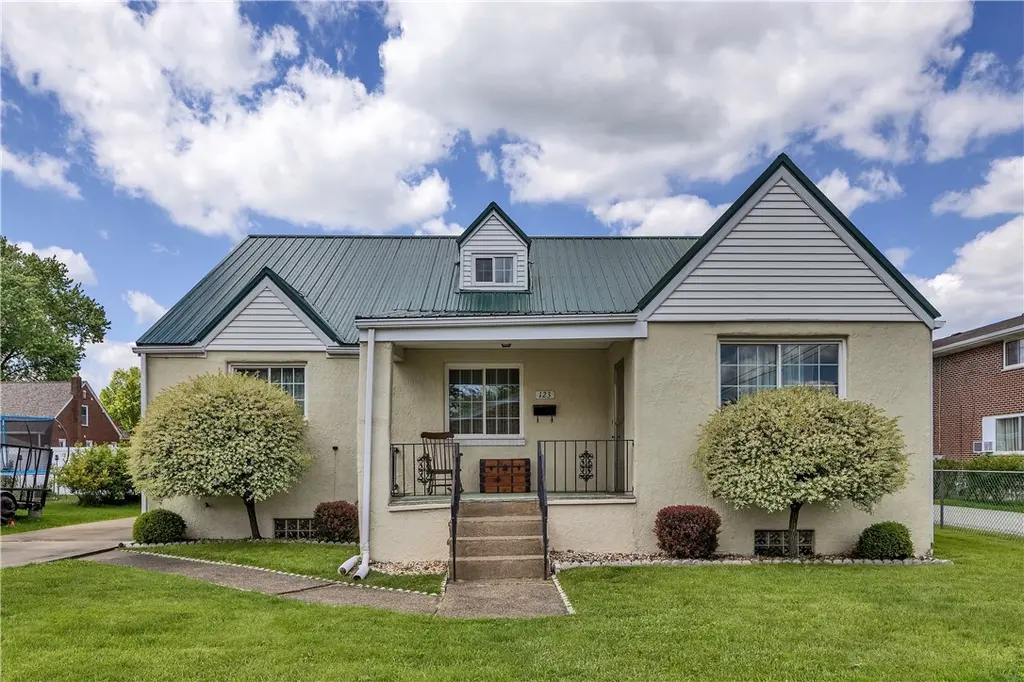
123 Orr Ave · Cheswick, PA
Flood risk 6/10 · Moderate
- FEMA flood zone
- X (unshaded)
- Chance of flooding over 30 yrs
- 0.7%
- Est. flood insurance / yr
- $473 – $860
Fire risk 1/10 · Minimal
- Est. fire insurance / yr
- $511 – $949
Heat risk 5/10 · Moderate
- Hot days now (above 98°F)
- 8 days/yr
- Hot days in 30 yrs
- 19 days/yr
Wind risk 2/10 · Minimal
- Chance of severe wind over 30 yrs
- —
Air-quality risk 4/10 · Minor
- Unhealthy air days now
- 5 days/yr
- Unhealthy air days in 30 yrs
- 7 days/yr
Risk factors via First Street. Map © Google.
Why this score? — see what drove the D grade
The composite is a weighted blend of 9 inputs, each scored 0–100. Each bar is that input's sub-score; the figure is the points it added to the 100-point composite (weight × sub-score).
- Cash flow +11.5/30.0
- ARV discount +10.0/15.0
- Livability +4.0/5.0
- Schools +3.5/10.0
- DSCR +3.4/10.0
- 1% rule +2.8/10.0
- Rent growth +2.5/5.0
- Condition / age +2.5/5.0
- Appreciation +0.0/10.0
$225,000
🖨 Deal sheet (PDF) 📄 Offer letter ✓ Due diligence
Listing remarks MLS
Level Corner Lot. Great Potential. Nice Kitchen. Lock Box on Side Door.
Key facts
- New metal roof
- Flexible space
- One-floor living
Tags
Property features AI
Exterior
- Parking: Off-street parking for 2 vehicles
- Utilities: Public water; Public sewer
- Home design: Resale property
- Construction: Stucco exterior; Metal roof; Full walk-up basement
- Exterior features: Lot dimensions approximately 66 x 121 x 66 x 121
Interior
- Kitchen: Cooktop; Refrigerator; Some electric appliances
- Bedrooms: Bedroom on main level (13 x 13); Upper-level bedroom (14 x 11); Upper-level bedroom (13 x 9); Additional bedroom in lower level
- Flooring: Hardwood floors; Carpet
- Bathrooms: Two full bathrooms
- Heating & cooling: Forced air heating (gas); Central air conditioning
- Interior features: Window treatments throughout; Decorative fireplace (1)
- Laundry & utility: Lower-level laundry room
Neighborhood map
What this means for you Summary
Snapshot
- This is a 3-bed/1.0-bath single-family listed at $225k.
Deal economics
- At list price, monthly cash flow is $-75 ($-898/yr) — negative.
- To cash-flow at today's rent, offer at most $212k (5.9% below list).
- To meet the 1% rule (rent ≥ 1% of price), the offer needs to be $176k (21.9% below list).
- Recommended offer: $176k (21.9% below list) — sets the bar for 1% rule.
Location & tenants
- Location reads 81/100 on livability (#176 in PA, #1,469 nationally) — a professional / high-income tenant draw. Strengths: crime A+, cost of living A+, housing A+; Watch: amenities F.
- Allegheny Valley SD (suburban): math 29% / reading 53% proficiency, ranked #341 of 539 in PA (top 63%) — families likely to look elsewhere, expect single-tenant / working-renter base with shorter leases.
- Zoned schools: Acmetonia El Sch (math 26% / reading 56%, grade F, #932 of 1,518 statewide, top 62%, 484 students, 100% FRL); Springdale Jshs (math 32% / reading 47%, grade F, #265 of 437 statewide, top 63%, 387 students, 94% FRL) — zoned schools average 97% FRL vs 36% district-wide (61 pts higher); higher-poverty schools than district average — tighter screening recommended.
- Market conditions: 32 active listings in the ZIP; 2,996 units permitted in Allegheny County in 2024 (1,588 in 5+ unit buildings).
Forward outlook
- Local home prices are declining (-3.0%/yr); year-one equity from $2k of loan paydown is wiped out by about $7k of value loss. Plan a longer hold.
Negotiation context
- It's been on market 21 days — a 2% lower offer ($222k) is reasonable based on typical stale-listing flexibility.
- 2 sale attempts since 16y ago with the ask held roughly flat each time — persistent listings suggest the price (not the market) is what's stuck; bring a comps-based counter.
- Current owner paid $72k; list at $225k implies a 212% gain — meaningful room to come down on a strong offer.
Risks & watch-outs
- Watch-outs: built in 1949 — expect roof / HVAC / electrical / plumbing capex.
- Climate carrying-cost: major flood risk; extreme-heat days projected 8→19/yr by 2055 (HVAC capex compounding) — expect insurance premiums to compound above CPI over the hold.
Questions for the listing agent
- What do current leases actually rent for vs. the listed asking? Can we see a recent rent roll and the last 12 months of T-12 income?
- Built in 1949 — when were the roof, HVAC, electrical panel, plumbing, and water heater last replaced?
- Is there a deadline driving the sale (1031 exchange, divorce, estate, relocation)? That informs how much negotiation room exists.
- Schools are B-rated — typically a magnet for longer-tenancy family renters. What's the average tenant stay here, and is there a school-zone premium baked into asking?
- The area grade is low — what's the realistic commute time and amenity access for the typical tenant pool here? Any planned neighborhood developments (good or bad) we should know about?
- What's the average days-on-market for RENTAL listings here right now (not sales)? A rising rental-DOM trend means longer vacancies and softer asking-rent achievability than the comps imply.
- What's the recent tenant-quality profile in this submarket — average credit score on applications, eviction rate, late-payment / NSF rate, and stable-employment percentage? A property-management company in the area should have these aggregated.
- How much new for-sale + rental construction is in the pipeline within 1–3 miles? Heavy new supply typically softens prices + rents 12–24 months out; constrained supply supports both.
Investment metrics
- 1% rule
- 0.78% ✗
- Cap rate
- 5.89%
- Cash-on-cash
- -1.43%
- DSCR
- 0.94
- GRM
- 10.7
CMA / ARV
- ARV (median comp)
- $238,005
- List price
- $225,000
- Delta
- -5.46%
- Verdict
- FAIR
- Comps
- 20 within 1.0 mi
Show comp detail 4 sales within ~0.75 mi
| Address | Dist | Beds/Ba | Sqft | Sold | Price | $/sf | Match |
|---|---|---|---|---|---|---|---|
| 1425 Freeport Rd | 0.22mi | 3/2.0 | 1,979 (-5%) | 4mo | $187,000 | $94 | 74 |
| 400 Hill Ave | 0.57mi | 3/2.5 | 2,112 (+1%) | 9mo | $349,000 | $165 | 58 |
| 301 N Highland Ave | 0.66mi | 3/1.5 | 1,869 (-10%) | 0mo | $200,000 | $107 | 50 |
| 114 Pillow Ave | 0.43mi | 4/2.0 (+1) | 1,850 (-11%) | 11mo | $260,000 | $141 | 43 |
Match score weights: distance 35% · size 25% · config 20% · recency 20%. Top-matched comps best support the ARV.
Projected returns pro-forma
-3.0% appreciation · 3.0% rent growth · sell at horizon
- IRR
- -18.7%
- Equity multiple
- 0.35×
- Total profit
- $-41,257
- Equity at exit
- $33,548
- IRR
- -11.1%
- Equity multiple
- 0.33×
- Total profit
- $-42,187
- Equity at exit
- $19,454
Cash invested: $63,000 (down + closing). Projections, not guarantees.
Landlord ↔ Tenant lean methodology
- Overall (STATE)
- 62 Landlord-Friendly
- State Pennsylvania
- 62 Landlord-Friendly · EVEN
- County
- — inherits STATE
- City
- — inherits STATE
ZIP-level market 15024
- Home prices YoY
- -9.2%
- Active inventory
- 32
- Price-to-rent
- 10.7×
Monthly cashflow live
- Estimated rent
- $1,757 medium interval (Pro) →
- Mortgage (P&I)
- −$1,180
- Tax from tax record
- −$189 /mo · $2,271/yr
- Insurance
- −$94
- HOA
- −$0
- Vacancy / Maint / Mgmt
- −$369
- Net cashflow
- $-75
Break-even live
Sensitivity live
| Price | -10% $53 | -5% $-11 | +0% $-75 | +5% $-139 | +10% $-202 |
|---|---|---|---|---|---|
| Rent | -10% $-214 | -5% $-144 | +0% $-75 | +5% $-5 | +10% $64 |
| Rate | -1.0pp $38 | -0.5pp $-18 | base $-75 | +0.5pp $-133 | +1.0pp $-192 |
UW: 25.0% down · 7.5% · 30yr · 1.5% tax · 5.0% vac · 8.0% maint · 8.0% mgmt
Financing live
Cash to close
- Down payment
- $56,250
- Closing costs
- $6,750
- Reserves months
- —
- Total cash needed
- —
Loan-product check · same deal, 3 products live
Conventional
25% down · 7.5% · 30yr
- Down + closing
- —
- Monthly P&I
- —
- Monthly cashflow
- —
- DSCR
- —
- Eligible?
- —
Personal DTI + credit; lowest rate.
DSCR
20% down · 8.5% · 30yr
- Down + closing
- —
- Monthly P&I
- —
- Monthly cashflow
- —
- DSCR
- —
- Eligible?
- —
No personal income docs; deal must DSCR.
Hard money
10% down · 12.0% · 12mo
- Down + closing
- —
- Monthly P&I
- —
- Monthly cashflow
- —
- DSCR
- —
- Eligible?
- —
Short-term bridge; refi at stabilization.
Listing history 9 events
-
2026-06-03statusdays on market $225,000 Pending 21 DOM
-
2026-06-02days on market $225,000 Active 20 DOM
-
2026-06-01days on market $225,000 Active 19 DOM
-
2026-05-31days on market $225,000 Active 18 DOM
-
2026-05-13$225,000 Active 424-char remark
-
2011-02-11soldstatus $72,000
-
2011-02-04soldstatus $72,000 71-char remark
Show marketing remark (71 chars)
Level Corner Lot. Great Potential. Nice Kitchen. Lock Box on Side Door.
-
2011-02-04price $79,500 71-char remark
Show marketing remark (71 chars)
Level Corner Lot. Great Potential. Nice Kitchen. Lock Box on Side Door.
-
2010-11-03$72,000 71-char remark
Show marketing remark (71 chars)
Level Corner Lot. Great Potential. Nice Kitchen. Lock Box on Side Door.
ⓘ Source: listings_history table (triggers on properties + properties_extension) + one-shot
backfill from property_details.listing_events for pre-trigger history.
Tax reassessment forecast PA · Partial reset (capped growth)
- Current annual tax
- $2,271 · $189/mo
- Projected year-2 tax
- $2,913 · $243/mo
- Expected delta
- +$642/yr (+$54/mo · 28.3%)
ⓘ Screening estimate from a state-policy table — verify with the county assessor before closing.
Climate risk First Street
- Flood 6/10 Major FEMA zone X (unshaded) · 70% chance over 30 yrs
- Wildfire 1/10 Low
- Heat 5/10 Major 8 d/yr ≥98°F today · 19 d/yr by 30 yrs out
- Wind 2/10 Low
- Air quality 4/10 Moderate 5 unhealthy d/yr today · 7 by 30 yrs out
Nearby sold comps map
Loading sold comps map…
Walkable amenities ~0.75 mi
Loading nearby amenities…
Taxation est. · year 1
- Rental income
- $21,084
- − Mortgage interest
- −$12,603
- − Property taxes
- −$2,271
- − Insurance
- −$1,125
- − Repairs & maintenance
- −$1,687
- − Management
- −$1,687
- − Depreciation
- −$6,545
- Taxable loss
- −$4,834
- Est. tax savings @ 24.0%
- +$1,160
- After-tax cash flow
- $262/yr
For passive investors: Depreciation is non-cash, so a rental often shows a tax loss while cash-flowing — sheltering income. Rental losses are passive: they offset passive income freely, and up to $25,000/yr can offset ordinary (W-2) income if you actively participate and your MAGI is under $100k (phasing out to $0 by $150k); unused losses carry forward. On sale, claimed depreciation is recaptured at up to 25%, and gains may owe capital-gains tax (a 1031 exchange can defer both). Figures are a year-1 estimate at your 24.0% rate — not tax advice; consult a CPA.
Schools (NCES district)
- District
- Allegheny Valley SD
- NCES district ID
- 4202190
- Math proficiency
- 29% ▼ -15.00%
- Reading proficiency
- 53% ▼ -13.00%
- Median HH income
- $48,049
- Composite
- 35.04/100
- National rank
- #5037
- State rank
- #341 of 539 in PA
Livability — Cheswick
- Score
- 81/100
- State rank
- #176
- US rank
- #1469
Category grades
Schools grade is shown separately in the Schools card above.
Census & demographics
- Population (ZIP)
- 9,192
Population outlook (Allegheny County) Hauer SSP2
- Today (2025)
- 1,250,282 people
- By 2030
- 1,256,482 · +0.5%
- By 2040
- 1,256,318 · +0.5%
- By 2050
- 1,244,169 · -0.5%
- By 2075
- 1,197,693 · -4.2%
- By 2100
- 1,093,187 · -12.6%
Race, ethnicity, and origin ACS 2023
- Neighborhood character
- Predominantly White (92%)
- Race & ethnicity
- White 92% Asian 3% Two or more races 3% Black 2%
- Common ancestry
- Romanian 11% Italian 2% Lithuanian 2%
- Foreign-born
- 5% · China, Canada
- Languages at home
- 94% English-only · Chinese 2% Other Indo-European 2%
Political lean MEDSL · Allegheny
- 2024 margin
- Strong D (+20.3) · D 59.7% · R 39.4%
- 2008→2024 swing
- +4.8pp toward D · 2008: 15.5pp · 2024: 20.3pp
- All cycles
- 2024: D+20.3 2020: D+20.4 2016: D+16.4 2012: D+14.4 2008: D+15.5
Not yet ingested
- Civics
- —
Market trends
- HPI YoY
- ▼ -25.38%
- Current HPI
- 248.9181
- Rent YoY
- —
- Metro
- —
- State GDP YoY
- ▲ 1.68%
- F500 in state
- 34
Industry mix (Fortune 500 HQ in PA)
| Industry | F500 HQs | Revenue |
|---|---|---|
| Healthcare | 2 | $309B |
|
||
| Insurance | 2 | $27B |
|
||
| Telecommunications / Media | 1 | $124B |
|
||
| Industrial Distribution | 1 | $22B |
|
||
| Financial Services | 1 | $20B |
|
||
| Chemicals / Materials | 1 | $18B |
|
||
Price history
+212.5% since first listed6 events — show timeline
- 2026-06-03 Pending — West Penn MLS
- 2026-05-13 Listed $225,000 West Penn MLS
- 2011-02-11 Sold (Public Records) $72,000 Public Records
- 2011-02-04 Price Changed $79,500 West Penn MLS
- 2011-02-04 Sold (MLS) $72,000 West Penn MLS
- 2010-11-03 Listed $72,000 West Penn MLS
Property tax history
+0.8%/yrLatest (2026): $2,271 · +1.8% YoY. Source: county tax records.
Cash-flow waterfall
monthlySold comps — $/sqft
last 12 mo · ≤1 miLoading sold comps…