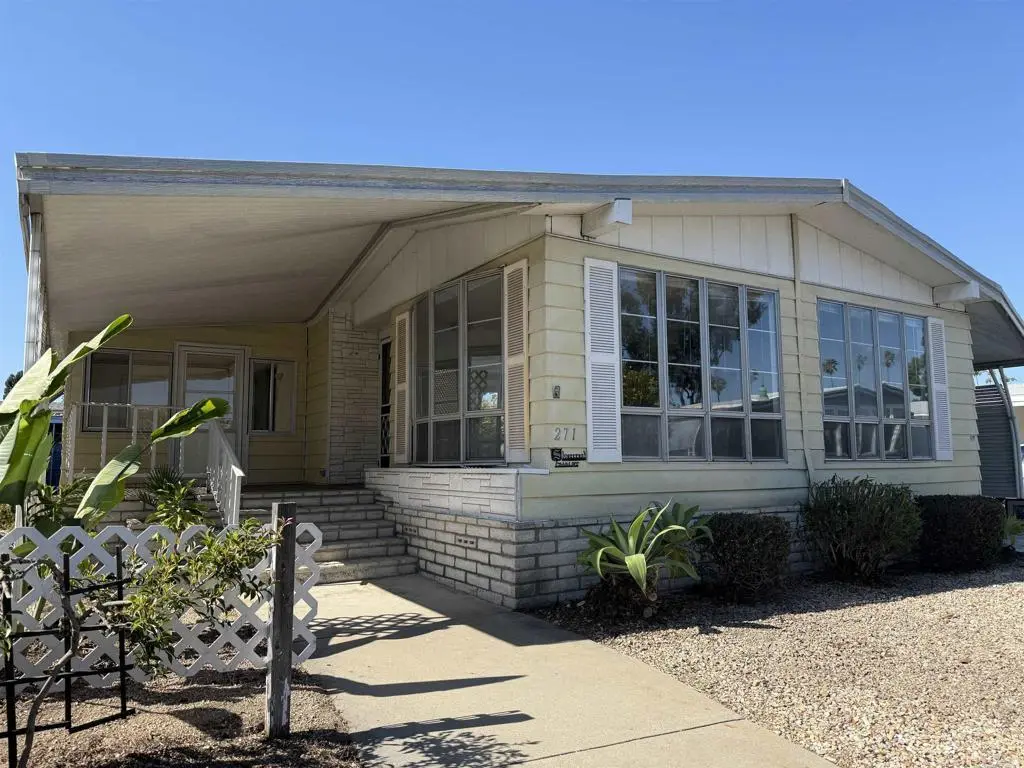
276 N El Camino Real #271 · Oceanside, CA
Flood risk 1/10 · Minimal
- FEMA flood zone
- A99
- Chance of flooding over 30 yrs
- 0.0%
- Est. flood insurance / yr
- $1,009 – $1,996
Fire risk 4/10 · Minor
- Est. fire insurance / yr
- $659 – $1,223
Heat risk 5/10 · Moderate
- Hot days now (above 86°F)
- 7 days/yr
- Hot days in 30 yrs
- 23 days/yr
Wind risk 1/10 · Minimal
- Chance of severe wind over 30 yrs
- —
Air-quality risk 4/10 · Minor
- Unhealthy air days now
- 5 days/yr
- Unhealthy air days in 30 yrs
- 5 days/yr
Risk factors via First Street. Map © Google.
Why this score? — see what drove the B+ grade
The composite is a weighted blend of 9 inputs, each scored 0–100. Each bar is that input's sub-score; the figure is the points it added to the 100-point composite (weight × sub-score).
- Cash flow +30.0/30.0
- ARV discount +15.0/15.0
- DSCR +10.0/10.0
- 1% rule +9.0/10.0
- Schools +3.6/10.0
- Livability +3.2/5.0
- Condition / age +2.8/5.0
- Rent growth +2.5/5.0
- Appreciation +0.0/10.0
$275,000
🖨 Deal sheet 📄 Offer letter ✓ Due diligence
Listing remarks
PRICE IMPROVEMENT $275,000!! Don't miss this opportunity to own a RARE QUADRUPLE WIDE “Quad” Classic Vintage Silvercrest Chalet 1978 Model beautiful home with over appx. 2,000 sq. ft. of living space (40'x12', 43'x13'4", 43'x10' and 40'x12'). Step inside a light filled living area with floor to ceiling windows and a stunning fireplace encased in glass for visibility throughout the living room, dining room & kitchen! The highly efficient kitchen layout creates an ergonomic food prep area with cook top island that opens up to formal dining or built in entertainment area. The home features Two Primary Ensuite Bedrooms on opposite ends of the home with a Guest Bedroom i
Key facts
- 2,300 sq ft lot
- 2 parking spots
- Community pool
Property features AI
Finance
- Other: Park/Neighborhood name: Laguna Vista
- Financial info: Land lease property
- HOA & community: Senior community; Community features include a lake; Land lease of $816 per month
Exterior
- Parking: 2 total parking spaces; 2 carport spaces; Located in Laguna Vista park
- Security: Gated community access (enter gate to reach property)
- Utilities: Public sewer
- Home design: Mobile home (Chalet model); Single-story; Mobile home remains on site; Mobile dimensions approximately 26 ft wide by 43 ft long
- Construction: Composition roof
- Exterior features: Front porch; Patio; Community in-ground heated pool; Lot is level/flat; Has a view
Interior
- Kitchen: Kitchen details not provided
- Bedrooms: Bedrooms not specified
- Flooring: Flooring details not provided
- Bathrooms: 2 full bathrooms
- Heating & cooling: Central furnace heating
- Interior features: One-level home; Front entry with carport access; Den; Association-maintained in-ground heated spa
- Laundry & utility: Laundry in an individual room
Neighborhood map
What this means for you Summary
Snapshot
- This is a 3-bed/2.0-bath manufactured listed at $275k. Condition is rated average.
Deal economics
- At list price, monthly cash flow is $1k ($12k/yr) — positive.
- The deal already cash-flows at list — no discount required.
- Meets the 1% rule at list price ($4k rent vs $275k).
- Recommended offer: $267k (3.0% below list) — sets the bar for market timing.
- Cap rate 11.2% vs local median 2.5% in Oceanside — top-decile yield for the area; either an underpriced asset or a hidden risk that comps aren't pricing in. Stress-test before assuming the spread holds.
Location & tenants
- Location reads 64/100 on livability (#413 in CA) — a middle-class / working-renter tenant base. Strengths: amenities A+, commute A+, employment A; Watch: schools D+, crime D, cost of living F.
- Oceanside Unified (suburban): math 31% / reading 51% proficiency, ranked #221 of 517 in CA (top 43%) — families likely to look elsewhere, expect single-tenant / working-renter base with shorter leases.
- Market conditions: Rents soft (-0.1%/yr); 69 active listings in the ZIP; 15 comparable units currently listed for rent nearby; rentals at typical pace (median 24d on market — plan ~3-4 weeks tenant-placement turnaround); 11,759 units permitted in San Diego County in 2024 (7,244 in 5+ unit buildings).
- At $3,841/mo this rent would consume 66% of the median local household income ($70k/yr) (locally 4169% of renters already pay >50% of income on rent) — very limited rent-growth headroom before tenants either downsize or default.
Forward outlook
- Local home prices are declining (-3.0%/yr); year-one equity from $2k of loan paydown is wiped out by about $8k of value loss. Plan a longer hold.
- San Diego County population projected at +20% by 2050 — long-run rental-demand tailwind backs the buy-and-hold thesis.
Negotiation context
- It's been on market 42 days — a 3% lower offer ($267k) is reasonable based on typical stale-listing flexibility.
Risks & watch-outs
- Watch-outs: flood insurance adds $125/mo.
- Climate carrying-cost: in FEMA flood zone A99 (mandatory federal flood insurance); extreme-heat days projected 7→23/yr by 2055 (HVAC capex compounding) — expect insurance premiums to compound above CPI over the hold.
Questions for the listing agent
- It's been on market 42 days. Have you received any prior offers? Is the seller open to a 3% concession, seller financing, or rate buy-down credit?
- Built in 1978 — when were the roof, HVAC, electrical panel, plumbing, and water heater last replaced?
- What's the actual annual flood-insurance premium (NFIP or private), and is the property in a SFHA with mandatory coverage?
- Is there a deadline driving the sale (1031 exchange, divorce, estate, relocation)? That informs how much negotiation room exists.
- Schools are D-rated, which usually means shorter tenancies and higher turnover. Who's the typical renter profile here, and what's been the actual vacancy rate?
- Crime grade is D in this area — have there been break-ins, vandalism, or insurance claims at this property in the last 3 years? What carrier currently insures it and at what premium?
- What's the average days-on-market for RENTAL listings here right now (not sales)? A rising rental-DOM trend means longer vacancies and softer asking-rent achievability than the comps imply.
- What's the recent tenant-quality profile in this submarket — average credit score on applications, eviction rate, late-payment / NSF rate, and stable-employment percentage? A property-management company in the area should have these aggregated.
- How much new for-sale + rental construction is in the pipeline within 1–3 miles? Heavy new supply typically softens prices + rents 12–24 months out; constrained supply supports both.
Investment metrics
- 1% rule
- 1.40% ✓
- Cap rate
- 11.24%
- Cash-on-cash
- 17.67%
- DSCR
- 1.79
- GRM
- 6.0
CMA / ARV
- ARV (median comp)
- $384,630
- List price
- $275,000
- Delta
- -28.50%
- Verdict
- UNDERPRICED
- Comps
- 18 within 1.0 mi
Show comp detail 6 sales within ~0.75 mi
| Address | Dist | Beds/Ba | Sqft | Sold | Price | $/sf | Match |
|---|---|---|---|---|---|---|---|
| 276 N El Camino Real #204 | 0.11mi | 3/2.0 | 2,040 (-1%) | 8mo | $500,000 | $245 | 86 |
| 276 N El Camino Real #208 | 0.00mi | 2/2.0 (-1) | 2,040 (-1%) | 14mo | $391,888 | $192 | 81 |
| 276 N El Camino Real Spc 190 Real #190 | 0.11mi | 2/2.0 (-1) | 1,938 (-6%) | 16mo | $420,000 | $217 | 66 |
| 276 N El Camino Real #139 | 0.00mi | 2/2.0 (-1) | 1,792 (-13%) | 9mo | $445,000 | $248 | 65 |
| 276 N El Camino Real Real #178 | 0.11mi | 2/2.0 (-1) | 1,827 (-12%) | 23mo | $337,000 | $184 | 52 |
| 200 N El Camino Real #107 | 0.29mi | 2/2.0 (-1) | 1,776 (-14%) | 9mo | $379,000 | $213 | 51 |
Match score weights: distance 35% · size 25% · config 20% · recency 20%. Top-matched comps best support the ARV.
Projected returns pro-forma
-3.0% appreciation · 0.0% rent growth · sell at horizon
- IRR
- 3.0%
- Equity multiple
- 1.11×
- Total profit
- $8,570
- Equity at exit
- $41,003
- IRR
- 9.3%
- Equity multiple
- 1.61×
- Total profit
- $47,243
- Equity at exit
- $23,777
Cash invested: $77,000 (down + closing). Projections, not guarantees.
Landlord ↔ Tenant lean methodology
- Overall (STATE)
- 18 Strongly Tenant-Friendly
- State California
- 18 Strongly Tenant-Friendly · D+13
- County
- — inherits STATE
- City
- — inherits STATE
ZIP-level market 92058
- Home prices YoY
- -34.9%
- Rents YoY
- -0.1%
- Active inventory
- 69
- Price-to-rent
- 6.0×
Monthly cashflow live
- Estimated rent
- $3,841 high interval (Pro) →
- Mortgage (P&I)
- −$1,442
- Tax est. 1.5%
- −$344 /mo · $4,125/yr
- Insurance
- −$115
- Flood insurance flood zone
- −$125 /mo · $1,502/yr
- HOA
- −$0
- Vacancy / Maint / Mgmt
- −$807
- Net cashflow
- $1,009
Break-even live
UW: 25.0% down · 7.5% · 30yr · 1.5% tax · 5.0% vac · 8.0% maint · 8.0% mgmt
Financing live
Cash to close
- Down payment
- $68,750
- Closing costs
- $8,250
- Reserves months
- —
- Total cash needed
- —
Loan-product check · same deal, 3 products live
Conventional
25% down · 7.5% · 30yr
- Down + closing
- —
- Monthly P&I
- —
- Monthly cashflow
- —
- DSCR
- —
- Eligible?
- —
Personal DTI + credit; lowest rate.
DSCR
20% down · 8.5% · 30yr
- Down + closing
- —
- Monthly P&I
- —
- Monthly cashflow
- —
- DSCR
- —
- Eligible?
- —
No personal income docs; deal must DSCR.
Hard money
10% down · 12.0% · 12mo
- Down + closing
- —
- Monthly P&I
- —
- Monthly cashflow
- —
- DSCR
- —
- Eligible?
- —
Short-term bridge; refi at stabilization.
Rent comps 15 comps
| Address | Beds | Baths | Sqft | Rent | $/sqft | DOM | Units | Dist |
|---|---|---|---|---|---|---|---|---|
| 200 N El Camino Real #263 Oceanside, CA | 2.0 | 2.0 | 1440 | $2,475 | $1.72 | 4d | 1 | 0.27mi |
| 200 N El Camino Real #52 Oceanside, CA | 2.0 | 2.0 | 1500 | $2,750 | $1.83 | 4d | 1 | 0.27mi |
| 3925 Estancia Dr Oceanside, CA | 3.0 | 2.0 | 1501 | $4,495 | $2.99 | 43d | 1 | 0.36mi |
| 3679 Branch Ct Oceanside, CA | 3.0 | 2.0 | 1625 | $3,895 | $2.40 | 3d | 1 | 0.46mi |
| 225 Melinda Way Oceanside, CA | 3.0 | 2.5 | 1610 | $4,000 | $2.48 | 43d | 1 | 0.75mi |
| 4140 Sitio Flor Oceanside, CA | 3.0 | 3.0 | 1548 | $3,725 | $2.41 | 43d | 1 | 0.83mi |
| 330 Del Flora St Oceanside, CA | 4.0 | 2.0 | 2200 | $9,000 | $4.09 | 24d | 1 | 0.84mi |
| 4211 Mission Ranch Way Oceanside, CA | 3.0 | 3.0 | 1548 | $3,949 | $2.55 | 44d | 1 | 0.93mi |
| 4260 Calle Del Vis Unit C Oceanside, CA | 3.0 | 2.5 | 2395 | $4,850 | $2.03 | 24d | 1 | 0.96mi |
| 4236 Vista del Rio Way #2 Oceanside, CA | 2.0 | 2.5 | 1500 | $2,695 | $1.80 | 20d | 1 | 1.04mi |
| 393 Spring Canyon Way Oceanside, CA | 4.0 | 3.0 | 2600 | $4,395 | $1.69 | 14d | 1 | 1.18mi |
| 408 Shadow Tree Dr Oceanside, CA | 4.0 | 3.0 | 2788 | $4,200 | $1.51 | 17d | 1 | 1.26mi |
| 367 Rimhurst Ct Oceanside, CA | 3.0 | 3.0 | 1968 | $4,300 | $2.18 | 43d | 1 | 1.27mi |
| 757 Sunningdale Dr Oceanside, CA | 3.0 | 2.0 | 1400 | $4,200 | $3.00 | 17d | 1 | 1.29mi |
| 4504 Goldfinch Way Oceanside, CA | 3.0 | 2.5 | 1436 | $3,400 | $2.37 | 24d | 1 | 1.34mi |
Listing history 15 events
-
2026-06-18days on market $275,000 Active 42 DOM
-
2026-06-17days on market $275,000 Active 41 DOM
-
2026-06-16days on market $275,000 Active 40 DOM
-
2026-06-15days on market $275,000 Active 39 DOM
-
2026-06-13days on market $275,000 Active 37 DOM
-
2026-06-13pricedays on market $275,000 Active 36 DOM
-
2026-06-09days on market $295,000 Active 33 DOM
-
2026-06-08days on market $295,000 Active 32 DOM
-
2026-06-07days on market $295,000 Active 31 DOM
-
2026-06-04days on market $295,000 Active 28 DOM
-
2026-06-03days on market $295,000 Active 27 DOM
-
2026-06-02days on market $295,000 Active 26 DOM
-
2026-06-01days on market $295,000 Active 25 DOM
-
2026-05-31days on market $295,000 Active 24 DOM
-
2026-05-07$325,000 Active 1205-char remark
ⓘ Source: listings_history table (triggers on properties + properties_extension) + one-shot
backfill from property_details.listing_events for pre-trigger history.
Climate risk First Street
- Flood 1/10 Low FEMA zone A99 · 0% chance over 30 yrs
- Wildfire 4/10 Moderate
- Heat 5/10 Major 7 d/yr ≥86°F today · 23 d/yr by 30 yrs out
- Wind 1/10 Low
- Air quality 4/10 Moderate 5 unhealthy d/yr today · 5 by 30 yrs out
Nearby sold comps map
Loading sold comps map…
Walkable amenities ~0.75 mi
Loading nearby amenities…
Taxation est. · year 1
- Rental income
- $46,094
- − Mortgage interest
- −$15,404
- − Property taxes
- −$4,125
- − Insurance
- −$2,878
- − Repairs & maintenance
- −$3,688
- − Management
- −$3,688
- − Depreciation
- −$8,000
- Taxable income
- $8,312
- Est. tax owed @ 24.0%
- −$1,995
- After-tax cash flow
- $10,111/yr
For passive investors: Depreciation is non-cash, so a rental often shows a tax loss while cash-flowing — sheltering income. Rental losses are passive: they offset passive income freely, and up to $25,000/yr can offset ordinary (W-2) income if you actively participate and your MAGI is under $100k (phasing out to $0 by $150k); unused losses carry forward. On sale, claimed depreciation is recaptured at up to 25%, and gains may owe capital-gains tax (a 1031 exchange can defer both). Figures are a year-1 estimate at your 24.0% rate — not tax advice; consult a CPA.
Condition & rehab AI · 30 photos
This manufactured home requires moderate repairs and maintenance to improve its condition and value. Upgrades to the exterior, windows, and landscaping would significantly enhance its curb appeal and marketability.
Repairs flagged
- Moderate Exterior siding — Weathered and needs repainting.
- Moderate Paint — Faded in some areas, needs touch-up.
- Moderate Windows — Old and may need replacement or sealing.
- Minor Kitchen cabinets — Dated but not structurally damaged.
- Minor Bathroom fixtures — Functional but dated design.
Value-add opportunities
- Both Paint and exterior siding — Enhances curb appeal and interior aesthetics.
- Both New windows — Improves energy efficiency and aesthetics.
- Both New flooring — Enhances interior aesthetics and comfort.
- Both Landscaping — Improves curb appeal and adds value to the property.
Renovation cost estimate screening
| Repair item | Severity | Est. cost |
|---|---|---|
| Exterior siding · Weathered and needs repainting. | Moderate | $3,000–15,000 |
| Paint · Faded in some areas, needs touch-up. | Moderate | $3,000–15,000 |
| Windows · Old and may need replacement or sealing. | Moderate | $3,000–15,000 |
| Kitchen cabinets · Dated but not structurally damaged. | Minor | $500–3,000 |
| Bathroom fixtures · Functional but dated design. | Minor | $500–3,000 |
| Total estimated repair cost · 5 items | $10,000–51,000 |
Value-add ROI direction
- Both Paint and exterior siding — Enhances curb appeal and interior aesthetics. ↑
- Both New windows — Improves energy efficiency and aesthetics. ↑
- Both New flooring — Enhances interior aesthetics and comfort. ↑
- Both Landscaping — Improves curb appeal and adds value to the property. ↑
ⓘ Cost ranges are severity-bucket heuristics (US national rule-of-thumb). Get contractor quotes + a written scope before underwriting a rehab budget.
Schools (NCES district)
- District
- Oceanside Unified
- NCES district ID
- 0628250
- Math proficiency
- 31% ▼ -5.00%
- Reading proficiency
- 51% ▲ 6.00%
- Median HH income
- $55,158
- Composite
- 35.74/100
- National rank
- #4853
- State rank
- #221 of 517 in CA
Livability — Oceanside
- Score
- 64/100
- State rank
- #413
- US rank
- #14081
Category grades
Schools grade is shown separately in the Schools card above.
Census & demographics
- Census place
- Oceanside, CA
- County
- San Diego County · 3,178,799 people
- City population
- 198,702
- Metro
- San Diego-Chula Vista-Carlsbad, CA
- Population (ZIP)
- 49,834
- Household income
- $69,970
- Rent vs Own
- Severe rent burden
- 4169.0
Population outlook (San Diego County) Hauer SSP2
- Today (2025)
- 3,678,185 people
- By 2030
- 3,856,546 · +4.8%
- By 2040
- 4,171,407 · +13.4%
- By 2050
- 4,421,607 · +20.2%
- By 2075
- 4,831,599 · +31.4%
- By 2100
- 4,832,502 · +31.4%
Race, ethnicity, and origin ACS 2023
- Neighborhood character
- Diverse neighborhood (Simpson 0.66)
- Race & ethnicity
- Hispanic / Latino 43% White 38% Two or more races 25% Black 6% Asian 5% Native American 1%
- Hispanic origin (detail)
- Mexican 34% Puerto Rican 2%
- Common ancestry
- Italian 4% Lithuanian 1% Romanian 1%
- Foreign-born
- 15% · Canada, Vietnam, Jamaica
- Languages at home
- 68% English-only · Spanish 26% Tagalog/Filipino 2% Other Asian/Pacific 1%
Political lean MEDSL · San Diego
- 2024 margin
- D (+16.8) · D 56.9% · R 40.1% · Other 2.9%
- 2008→2024 swing
- +6.6pp toward D · 2008: 10.2pp · 2024: 16.8pp
- All cycles
- 2024: D+16.8 2020: D+22.8 2016: D+17.8 2012: D+5.1 2008: D+10.2
Not yet ingested
- Civics
- —
Market trends
- HPI YoY
- ▼ -223.54%
- Current HPI
- 417.6464
- Rent YoY
- ▼ -0.11%
- Metro
- San Diego-Chula Vista-Carlsbad, CA
- State GDP YoY
- ▲ 3.21%
- F500 in state
- 116
Industry mix (Fortune 500 HQ in CA)
| Industry | F500 HQs | Revenue |
|---|---|---|
| Technology | 27 | $1,492B |
|
||
| Financial Services | 3 | $174B |
|
||
| Retail | 3 | $44B |
|
||
| Insurance | 3 | $26B |
|
||
| Media / Entertainment | 2 | $115B |
|
||
| Pharmaceuticals / Biotech | 2 | $62B |
|
||
Price history
-15.4% since first listed3 events — show timeline
- 2026-06-10 Price Changed $275,000 CRMLS
- 2026-05-29 Price Changed $295,000 CRMLS
- 2026-05-07 Listed $325,000 CRMLS
Cash-flow waterfall
monthlySold comps — $/sqft
last 12 mo · ≤1 miLoading sold comps…