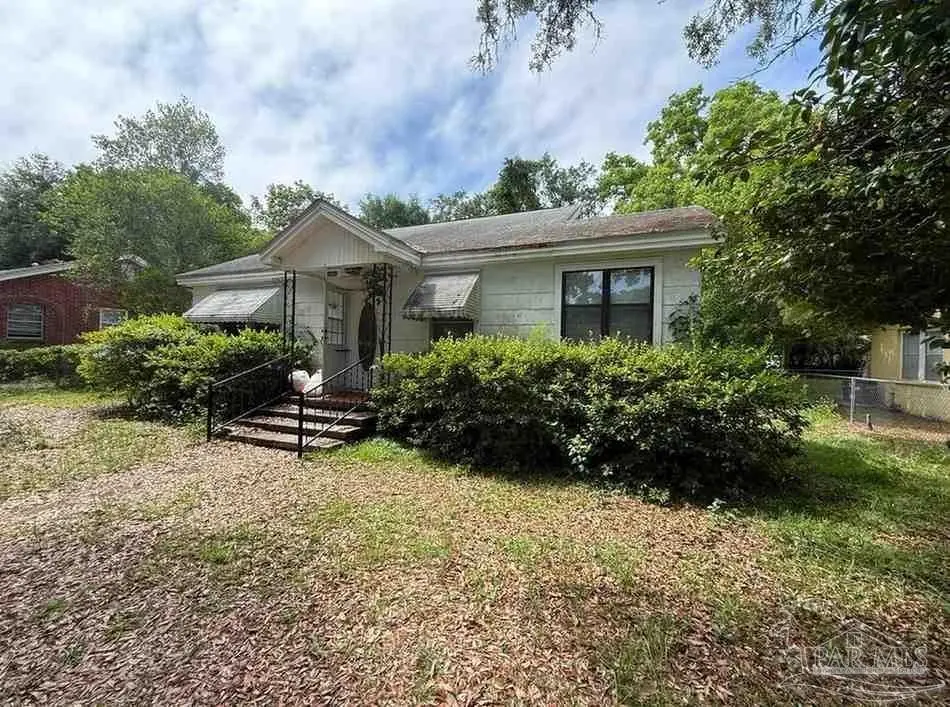
1412 Wisteria Ave · Warrington, FL
Flood risk 1/10 · Minimal
- FEMA flood zone
- X (unshaded)
- Chance of flooding over 30 yrs
- 0.0%
- Est. flood insurance / yr
- $507 – $1,088
Fire risk 3/10 · Minor
- Est. fire insurance / yr
- $947 – $1,759
Heat risk 10/10 · Severe
- Hot days now (above 105°F)
- 7 days/yr
- Hot days in 30 yrs
- 24 days/yr
Wind risk 9/10 · Severe
- Chance of severe wind over 30 yrs
- 99.0%
Air-quality risk 1/10 · Minimal
- Unhealthy air days now
- 0 days/yr
- Unhealthy air days in 30 yrs
- 0 days/yr
Risk factors via First Street. Map © Google.
Why this score? — see what drove the B+ grade
The composite is a weighted blend of 9 inputs, each scored 0–100. Each bar is that input's sub-score; the figure is the points it added to the 100-point composite (weight × sub-score).
- Cash flow +30.0/30.0
- ARV discount +15.0/15.0
- DSCR +10.0/10.0
- 1% rule +8.6/10.0
- Schools +3.6/10.0
- Livability +3.2/5.0
- Rent growth +2.8/5.0
- Condition / age +2.5/5.0
- Appreciation +0.0/10.0
$109,900
🖨 Deal sheet 📄 Offer letter ✓ Due diligence
Listing remarks
Charming 2-bedroom, 1-bath home in Pensacola with solid upside and plenty of potential. Offering 1,172 sq ft, this inherited property is a great opportunity for an investor, first-time buyer, or anyone looking to add value with cosmetic updates. The home has a comfortable layout and is ready for fresh flooring, paint, and personal touches throughout. Seller is not aware of any major issues, but age of systems, including the roof, is unknown and should be verified by buyer. With the right updates, this property could make a great rental, flip, or affordable primary residence. Conveniently located near Navy Point, downtown Pensacola, NAS Pensacola, shopping, dining, and the beaches. Priced wi
Key facts
- Downtown pensacola
- Shopping
- Beaches
Tags
Property features AI
Finance
- Other: Lot size approximately 0.24 acres; Property condition: resale; New construction: no
- HOA & community: No association
Exterior
- Parking: Driveway with open parking
- Security: No security details provided
- Utilities: Public water; Public sewer; Electric service with circuit breakers
- Home design: Single-story home; Resale property; Not attached to other properties; Paved road access; No road maintenance responsibility
- Construction: Frame construction; Slab foundation; Built on one level; Total building area: 1,172 square feet
- Exterior features: Composition roof; Open-loop geothermal heat pump
Interior
- Kitchen: No water heater (as listed); Kitchen details not updated
- Bedrooms: Master bedroom on the first floor (approx. 10' x 10'); Bedroom 1 on the first floor (approx. 10' x 10'); Bedroom 2 on the first floor (approx. 10' x 10')
- Flooring: Tile; Carpet
- Bathrooms: 1 full bathroom
- Heating & cooling: Ceiling fan(s)
- Interior features: Tile and carpet flooring; Living/dining combo
- Laundry & utility: Laundry/utility details not provided
Neighborhood map
What this means for you Summary
Snapshot
- This is a 2-bed/1.0-bath single-family listed at $110k.
Deal economics
- At list price, monthly cash flow is $440 ($5k/yr) — positive.
- The deal already cash-flows at list — no discount required.
- Meets the 1% rule at list price ($2k rent vs $110k).
- Cap rate 11.1% vs local median 4.3% in Warrington — top-decile yield for the area; either an underpriced asset or a hidden risk that comps aren't pricing in. Stress-test before assuming the spread holds.
Location & tenants
- Location reads 65/100 on livability (#631 in FL) — a middle-class / working-renter tenant base. Strengths: cost of living A+, housing A+; Watch: schools D, amenities F, commute F.
- Escambia (suburban): math 40% / reading 45% proficiency, ranked #56 of 73 in FL (top 77%) — families likely to look elsewhere, expect single-tenant / working-renter base with shorter leases.
- Market conditions: Rents rising (+1.2%/yr); 702 active listings in the ZIP; 17 comparable units currently listed for rent nearby; rentals at typical pace (median 24d on market — plan ~3-4 weeks tenant-placement turnaround); 1,479 units permitted in Escambia County in 2024 (0 in 5+ unit buildings).
Forward outlook
- Local home prices are declining (-3.0%/yr); year-one equity from $760 of loan paydown is wiped out by about $3k of value loss. Plan a longer hold.
- Escambia County population projected at +13% by 2050 — modest demand growth; plan on rents tracking national, not racing it.
- At projected returns (-3.0% appreciation + 1.2% rent growth), your $31k cash investment doubles in ~9 years — after that, you're playing with house money.
Negotiation context
- Only 13 days on market — expect competitive offers; lowballing is unlikely to land.
- Current owner paid $14k; list at $110k implies a 691% gain — meaningful room to come down on a strong offer.
Risks & watch-outs
- Watch-outs: built in 1942 — expect roof / HVAC / electrical / plumbing capex.
- Climate carrying-cost: severe wind risk, 99% chance of damaging wind over 30y; extreme-heat days projected 7→24/yr by 2055 (HVAC capex compounding) — expect insurance premiums to compound above CPI over the hold.
Questions for the listing agent
- Built in 1942 — when were the roof, HVAC, electrical panel, plumbing, and water heater last replaced?
- Is there a deadline driving the sale (1031 exchange, divorce, estate, relocation)? That informs how much negotiation room exists.
- Schools are D-rated, which usually means shorter tenancies and higher turnover. Who's the typical renter profile here, and what's been the actual vacancy rate?
- What's the average days-on-market for RENTAL listings here right now (not sales)? A rising rental-DOM trend means longer vacancies and softer asking-rent achievability than the comps imply.
- What's the recent tenant-quality profile in this submarket — average credit score on applications, eviction rate, late-payment / NSF rate, and stable-employment percentage? A property-management company in the area should have these aggregated.
- How much new for-sale + rental construction is in the pipeline within 1–3 miles? Heavy new supply typically softens prices + rents 12–24 months out; constrained supply supports both.
Investment metrics
- 1% rule
- 1.36% ✓
- Cap rate
- 11.10%
- Cash-on-cash
- 17.17%
- DSCR
- 1.76
- GRM
- 6.1
CMA / ARV
- ARV (on-the-fly)
- $214,476
- Comps found
- 12
Show comp detail 12 sales within ~0.75 mi
| Address | Dist | Beds/Ba | Sqft | Sold | Price | $/sf | Match |
|---|---|---|---|---|---|---|---|
| 4 Victoria Pl | 0.52mi | 3/1.0 (+1) | 1,184 (+1%) | 7mo | $225,000 | $190 | 63 |
| 413 S 2nd St | 0.68mi | 2/1.0 | 1,124 (-4%) | 2mo | $220,000 | $196 | 60 |
| 129 Manchester St | 0.27mi | 2/2.0 | 1,292 (+10%) | 8mo | $170,000 | $132 | 60 |
| 805 Rue Max St | 0.53mi | 3/1.0 (+1) | 1,106 (-6%) | 1mo | $200,000 | $181 | 60 |
| 14 Mindoro Cir | 0.57mi | 3/2.0 (+1) | 1,182 (+1%) | 6mo | $170,000 | $144 | 58 |
| 103 Fleet Rd | 0.54mi | 3/2.0 (+1) | 1,158 (-1%) | 8mo | $199,000 | $172 | 57 |
| 10 N Jamaica St | 0.69mi | 3/2.0 (+1) | 1,175 (+0%) | 2mo | $205,000 | $174 | 56 |
| 101 Brandywine Rd | 0.53mi | 2/1.0 | 1,084 (-8%) | 7mo | $198,000 | $183 | 56 |
| 10 N Runyan St | 0.64mi | 3/1.0 (+1) | 1,080 (-8%) | 3mo | $105,000 | $97 | 49 |
| 14 Sulu Dr | 0.51mi | 3/2.0 (+1) | 1,295 (+10%) | 2mo | $279,000 | $215 | 48 |
| 629 Rue Max St | 0.62mi | 3/1.0 (+1) | 1,020 (-13%) | 1mo | $222,000 | $218 | 44 |
| 206 W Winthrop Ave | 0.68mi | 3/2.0 (+1) | 1,288 (+10%) | 8mo | $265,000 | $206 | 36 |
Match score weights: distance 35% · size 25% · config 20% · recency 20%. Top-matched comps best support the ARV.
Projected returns pro-forma
-3.0% appreciation · 1.22% rent growth · sell at horizon
- IRR
- 6.5%
- Equity multiple
- 1.25×
- Total profit
- $7,615
- Equity at exit
- $16,386
- IRR
- 14.2%
- Equity multiple
- 2.05×
- Total profit
- $32,355
- Equity at exit
- $9,502
Cash invested: $30,772 (down + closing). Projections, not guarantees.
Landlord ↔ Tenant lean methodology
- Overall (STATE)
- 87 Strongly Landlord-Friendly
- State Florida
- 87 Strongly Landlord-Friendly · R+3
- County
- — inherits STATE
- City
- — inherits STATE
ZIP-level market 32507
- Home prices YoY
- -4.6%
- Rents YoY
- 1.2%
- Active inventory
- 702
- Price-to-rent
- 6.1×
Monthly cashflow live
- Estimated rent
- $1,500 high interval (Pro) →
- Mortgage (P&I)
- −$576
- Tax from tax record
- −$122 /mo · $1,467/yr
- Insurance
- −$46
- HOA
- −$0
- Vacancy / Maint / Mgmt
- −$315
- Net cashflow
- $440
Break-even live
UW: 25.0% down · 7.5% · 30yr · 1.5% tax · 5.0% vac · 8.0% maint · 8.0% mgmt
Financing live
Cash to close
- Down payment
- $27,475
- Closing costs
- $3,297
- Reserves months
- —
- Total cash needed
- —
Loan-product check · same deal, 3 products live
Conventional
25% down · 7.5% · 30yr
- Down + closing
- —
- Monthly P&I
- —
- Monthly cashflow
- —
- DSCR
- —
- Eligible?
- —
Personal DTI + credit; lowest rate.
DSCR
20% down · 8.5% · 30yr
- Down + closing
- —
- Monthly P&I
- —
- Monthly cashflow
- —
- DSCR
- —
- Eligible?
- —
No personal income docs; deal must DSCR.
Hard money
10% down · 12.0% · 12mo
- Down + closing
- —
- Monthly P&I
- —
- Monthly cashflow
- —
- DSCR
- —
- Eligible?
- —
Short-term bridge; refi at stabilization.
Rent comps 17 comps
| Address | Beds | Baths | Sqft | Rent | $/sqft | DOM | Units | Dist |
|---|---|---|---|---|---|---|---|---|
| 1120 S Old Corry Field Rd Pensacola, FL | 3.0 | 1.0 | 1000 | $1,295 | $1.29 | 23d | 1 | 0.11mi |
| 99 S 3rd St Unit 3 Pensacola, FL | 2.0 | 1.5 | 900 | $1,259 | $1.40 | 23d | 1 | 0.39mi |
| 405 E Palmetto Ave Pensacola, FL | 2.0 | 1.0 | 900 | $1,800 | $2.00 | 23d | 1 | 0.50mi |
| 210 S 2nd St Pensacola, FL | 3.0 | 2.0 | 1232 | $1,900 | $1.54 | 23d | 1 | 0.54mi |
| 7 Mindoro Cir Pensacola, FL | 3.0 | 1.0 | 924 | $1,395 | $1.51 | 23d | 1 | 0.60mi |
| 26 N Lincoln Rd Unit B Pensacola, FL | 2.0 | 1.0 | 759 | $1,050 | $1.38 | 13d | 1 | 0.69mi |
| 2 E Sunset Ave Unit 3 Pensacola, FL | 2.0 | 1.0 | 806 | $1,350 | $1.67 | 23d | 1 | 0.70mi |
| 45 W Carver Dr Pensacola, FL | 3.0 | 1.0 | 940 | $1,325 | $1.41 | 23d | 1 | 0.78mi |
| 113 Rue Max St Pensacola, FL | 3.0 | 1.0 | 862 | $1,395 | $1.62 | 23d | 1 | 0.79mi |
| 103 NW Kalash Rd Pensacola, FL | 2.0 | 1.0 | 1250 | $1,400 | $1.12 | 23d | 1 | 1.19mi |
| 615 Bayshore Dr #806 Pensacola, FL | 1.0 | 1.0 | 930 | $1,850 | $1.99 | 23d | 1 | 1.21mi |
| 315 Flannan Rd Pensacola, FL | 3.0 | 1.0 | 836 | $1,745 | $2.09 | 13d | 1 | 1.25mi |
| 5 Elegans Ave Pensacola, FL | 2.0 | 1.0 | 788 | $1,195 | $1.52 | 23d | 1 | 1.26mi |
| 190 N Old Corry Field Rd Pensacola, FL | 1.0–2.0 | 1.0–2.0 | 915 | $1,174 | $1.28 | 13d | 3 | 1.32mi |
| 300 Gibbs Rd Pensacola, FL | 3.0 | 2.5 | 1377 | $1,999 | $1.45 | 23d | 1 | 1.38mi |
| 718 Mills Ave Unit A Pensacola, FL | 2.0 | 1.0 | 728 | $1,200 | $1.65 | 23d | 1 | 1.41mi |
| 4600 Twin Oaks Dr Pensacola, FL | 1.0–2.0 | 1.0 | 838 | $1,499 | $1.79 | 13d | 29 | 1.47mi |
Listing history 15 events
-
2026-06-14status $109,900 Pending 13 DOM
-
2026-06-10days on market $109,900 Active 13 DOM
-
2026-06-09days on market $109,900 Active 12 DOM
-
2026-06-08days on market $109,900 Active 11 DOM
-
2026-06-07days on market $109,900 Active 10 DOM
-
2026-06-03days on market $109,900 Active 6 DOM
-
2026-06-02days on market $109,900 Active 5 DOM
-
2026-06-01days on market $109,900 Active 4 DOM
-
2026-05-31days on market $109,900 Active 3 DOM
-
2026-05-31days on market $109,900 Active 2 DOM
-
2026-05-28$109,900 Active
-
1974-01-01soldstatus $13,900
-
1973-01-01soldstatus $7,500
-
1969-01-01soldstatus $7,800
-
1969-01-01soldstatus $9,650
ⓘ Source: listings_history table (triggers on properties + properties_extension) + one-shot
backfill from property_details.listing_events for pre-trigger history.
Tax reassessment forecast FL · Resets to sale price
- Current annual tax
- $1,467 · $122/mo
- Projected year-2 tax
- $1,467 · $122/mo
- Expected delta
- $0/yr ($0/mo · 0.0%)
ⓘ Screening estimate from a state-policy table — verify with the county assessor before closing.
Climate risk First Street
- Flood 1/10 Low FEMA zone X (unshaded) · 0% chance over 30 yrs
- Wildfire 3/10 Moderate
- Heat 10/10 Extreme 7 d/yr ≥105°F today · 24 d/yr by 30 yrs out
- Wind 9/10 Extreme 99% chance of damaging wind over 30 yrs
- Air quality 1/10 Low 0 unhealthy d/yr today · 0 by 30 yrs out
Nearby sold comps map
Loading sold comps map…
Walkable amenities ~0.75 mi
Loading nearby amenities…
Taxation est. · year 1
- Rental income
- $17,997
- − Mortgage interest
- −$6,156
- − Property taxes
- −$1,467
- − Insurance
- −$550
- − Repairs & maintenance
- −$1,440
- − Management
- −$1,440
- − Depreciation
- −$3,197
- Taxable income
- $3,748
- Est. tax owed @ 24.0%
- −$899
- After-tax cash flow
- $4,386/yr
For passive investors: Depreciation is non-cash, so a rental often shows a tax loss while cash-flowing — sheltering income. Rental losses are passive: they offset passive income freely, and up to $25,000/yr can offset ordinary (W-2) income if you actively participate and your MAGI is under $100k (phasing out to $0 by $150k); unused losses carry forward. On sale, claimed depreciation is recaptured at up to 25%, and gains may owe capital-gains tax (a 1031 exchange can defer both). Figures are a year-1 estimate at your 24.0% rate — not tax advice; consult a CPA.
Schools (NCES district)
- District
- Escambia
- NCES district ID
- 1200510
- Math proficiency
- 40% ▼ -9.00%
- Reading proficiency
- 45% ▼ -4.00%
- Median HH income
- $44,649
- Composite
- 36.04/100
- National rank
- #4773
- State rank
- #56 of 73 in FL
Livability — Warrington
- Score
- 65/100
- State rank
- #631
- US rank
- #12396
Category grades
Schools grade is shown separately in the Schools card above.
Census & demographics
- Census place
- Warrington, FL
- County
- Escambia County · 301,722 people
- Metro
- Pensacola-Ferry Pass-Brent, FL
- Population (ZIP)
- 32,226
- Household income
- $73,540
- Rent vs Own
- Severe rent burden
- 1175.0
Population outlook (Escambia County) Hauer SSP2
- Today (2025)
- 334,637 people
- By 2030
- 345,779 · +3.3%
- By 2040
- 364,828 · +9.0%
- By 2050
- 378,514 · +13.1%
- By 2075
- 403,220 · +20.5%
- By 2100
- 386,125 · +15.4%
Race, ethnicity, and origin ACS 2023
- Neighborhood character
- Predominantly White (73%)
- Race & ethnicity
- White 73% Black 10% Two or more races 10% Hispanic / Latino 7% Asian 2%
- Hispanic origin (detail)
- Mexican 3% Puerto Rican 2%
- Common ancestry
- Slovak 3% Lithuanian 2% Romanian 2%
- Foreign-born
- 5% · Canada, Vietnam
- Languages at home
- 92% English-only · Spanish 4% Other Asian/Pacific 1% French/Haitian/Cajun 1%
Political lean MEDSL · Escambia
- 2024 margin
- R (+19.5) · D 39.7% · R 59.2% · Other 1.1%
- 2008→2024 swing
- -0.2pp no change · 2008: -19.3pp · 2024: -19.5pp
- All cycles
- 2024: R+19.5 2020: R+15.1 2016: R+20.6 2012: R+20.6 2008: R+19.3
Not yet ingested
- Civics
- —
Market trends
- HPI YoY
- ▼ -26.23%
- Current HPI
- 548.03
- Rent YoY
- ▲ 1.22%
- Metro
- Pensacola-Ferry Pass-Brent, FL
- State GDP YoY
- ▲ 3.28%
- F500 in state
- 36
Industry mix (Fortune 500 HQ in FL)
| Industry | F500 HQs | Revenue |
|---|---|---|
| Industrial Technology | 2 | $29B |
|
||
| Insurance | 2 | $17B |
|
||
| Retail | 1 | $60B |
|
||
| Technology Distribution | 1 | $58B |
|
||
| Homebuilding | 1 | $35B |
|
||
| Technology Manufacturing | 1 | $35B |
|
||
Price history
+1309.0% since first listed5 events — show timeline
- 2026-05-28 Listed $109,900 PARMLS
- 1974-01-01 Sold (Public Records) $13,900 Public Records
- 1973-01-01 Sold (Public Records) $7,500 Public Records
- 1969-01-01 Sold (Public Records) $9,650 Public Records
- 1969-01-01 Sold (Public Records) $7,800 Public Records
Property tax history
+19.8%/yrLatest (2025): $1,467 · +18.0% YoY. Source: county tax records.
Cash-flow waterfall
monthlySold comps — $/sqft
last 12 mo · ≤1 miLoading sold comps…