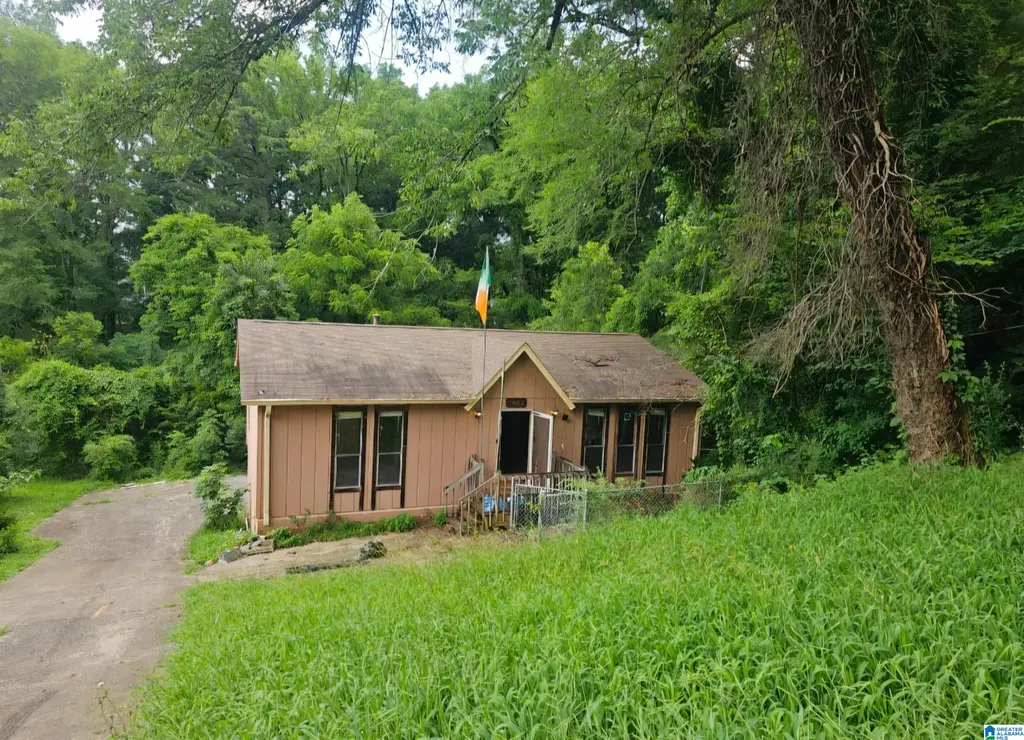
1652 Azalea Dr · Birmingham, AL
Flood risk 9/10 · Severe
- FEMA flood zone
- X (unshaded)
- Chance of flooding over 30 yrs
- 0.99%
- Est. flood insurance / yr
- $473 – $860
Fire risk 4/10 · Minor
- Est. fire insurance / yr
- $916 – $1,700
Heat risk 5/10 · Moderate
- Hot days now (above 105°F)
- 7 days/yr
- Hot days in 30 yrs
- 18 days/yr
Wind risk 6/10 · Moderate
- Chance of severe wind over 30 yrs
- 27.0%
Air-quality risk 5/10 · Moderate
- Unhealthy air days now
- 7 days/yr
- Unhealthy air days in 30 yrs
- 9 days/yr
Risk factors via First Street. Map © Google.
Why this score? — see what drove the B- grade
The composite is a weighted blend of 9 inputs, each scored 0–100. Each bar is that input's sub-score; the figure is the points it added to the 100-point composite (weight × sub-score).
- Cash flow +26.0/30.0
- ARV discount +15.0/15.0
- DSCR +8.8/10.0
- 1% rule +7.1/10.0
- Rent growth +3.8/5.0
- Livability +3.4/5.0
- Condition / age +2.5/5.0
- Schools +0.9/10.0
- Appreciation +0.0/10.0
$125,000
🖨 Deal sheet 📄 Offer letter ✓ Due diligence
Listing remarks MLS
One level living on dead end street with lots of wooded views abounding in this home. This home has a lot of major improvements which include: New HVAC 2019, New Roof 2019, New Gutters 2020, Kitchen Floor - 2020, New Garage Door 2020. This home also has a large fenced yard both on front, side and back of home ready for your furry friends. This home also has a full unfinished basement which is stubbed for a second bath and can be finished out for a lot more space. Make plans to see this one today!
Key facts
- Dead end street
- Oversized lot
- 0.52 acre lot
Tags
Property features AI
Finance
- Other: Lot size approximately 0.52 acres; Subdivision: SPRING LAKE MANOR
- HOA & community: No association fee
Exterior
- Parking: Rear garage entry; Driveway parking; 1 total garage space (basement level)
- Utilities: Public water; Connected sewer; Electric water heater; Internet availability: unknown
- Home design: Existing construction; Siding (other); Basement foundation; Not waterfront; No pool; No patio; No garden/patio
- Construction: Siding exterior; Basement foundation
- Exterior features: Fenced yard; Open deck
Interior
- Kitchen: Laminate countertops; Breakfast bar and eating area; Refrigerator; Some stainless appliances; Electric stove
- Bedrooms: Master bedroom on main level; Additional bedroom on main level
- Flooring: Carpet; Concrete; Hardwood laminate; Vinyl
- Bathrooms: One full bath on main level; One half bath in basement; Tub/shower combo; Linen closet
- Heating & cooling: Central heating (electric); Central cooling
- Interior features: Handyman special; Ceilings: other (see remarks); Walk-up attic; Full unfinished basement with plumbing stubbed and concrete block
- Laundry & utility: Laundry in basement (utilities in garage); Dryer hookup: electric; Electric water heater
Neighborhood map
What this means for you Summary
Snapshot
- This is a 3-bed/1.0-bath single-family listed at $125k.
Deal economics
- At list price, monthly cash flow is $257 ($3k/yr) — positive.
- The deal already cash-flows at list — no discount required.
- Meets the 1% rule at list price ($2k rent vs $125k).
- Cap rate 9.3% vs local median 6.2% in Birmingham — top-decile yield for the area; either an underpriced asset or a hidden risk that comps aren't pricing in. Stress-test before assuming the spread holds.
Location & tenants
- Location reads 67/100 on livability (#78 in AL) — a middle-class / working-renter tenant base. Strengths: commute A+, cost of living A+, housing A+; Watch: amenities C-, crime F, employment F.
- Birmingham City (urban): math 4% / reading 20% proficiency, ranked #116 of 129 in AL (top 90%) — low school quality limits family demand, transient renter base, plan for 1-2y turnover; 82% free/reduced lunch — lower-income household profile, screen leases tightly.
- Zoned schools: Huffman Academy (math 0% / reading 17%, grade F, #594 of 627 statewide, top 95%, 735 students, 79% FRL); Huffman High Schoolmagnet (math 2% / reading 2%, grade F, #291 of 305 statewide, top 100%, 1,147 students, 72% FRL).
- Market conditions: Rents rising fast (+5.4%/yr); 114 active listings in the ZIP; 16 comparable units currently listed for rent nearby; rentals at typical pace (median 24d on market — plan ~3-4 weeks tenant-placement turnaround); 2,114 units permitted in Jefferson County in 2024 (556 in 5+ unit buildings).
Forward outlook
- Local home prices are declining (-3.0%/yr); year-one equity from $864 of loan paydown is wiped out by about $4k of value loss. Plan a longer hold.
- Jefferson County population projected to shrink 4% by 2050 — rents likely to lag national; underwrite the cash flow, not the appreciation.
- At projected returns (-3.0% appreciation + 5.4% rent growth), your $35k cash investment doubles in ~9 years — after that, you're playing with house money.
Negotiation context
- Only 8 days on market — expect competitive offers; lowballing is unlikely to land.
- 2 sale attempts since 9y ago; this cycle's ask is 39% above the opening price — seller raised mid-cycle; expect resistance to lowballs.
- Current owner paid $80k; list at $125k implies a 56% gain — meaningful room to come down on a strong offer.
Risks & watch-outs
- Watch-outs: flood insurance adds $56/mo.
- Climate carrying-cost: severe flood risk; major wind risk, 27% chance of damaging wind over 30y; extreme-heat days projected 7→18/yr by 2055 (HVAC capex compounding) — expect insurance premiums to compound above CPI over the hold.
Questions for the listing agent
- Built in 1979 — when were the roof, HVAC, electrical panel, plumbing, and water heater last replaced?
- What's the actual annual flood-insurance premium (NFIP or private), and is the property in a SFHA with mandatory coverage?
- Is there a deadline driving the sale (1031 exchange, divorce, estate, relocation)? That informs how much negotiation room exists.
- Schools are F-rated, which usually means shorter tenancies and higher turnover. Who's the typical renter profile here, and what's been the actual vacancy rate?
- Crime grade is F in this area — have there been break-ins, vandalism, or insurance claims at this property in the last 3 years? What carrier currently insures it and at what premium?
- What's the average days-on-market for RENTAL listings here right now (not sales)? A rising rental-DOM trend means longer vacancies and softer asking-rent achievability than the comps imply.
- What's the recent tenant-quality profile in this submarket — average credit score on applications, eviction rate, late-payment / NSF rate, and stable-employment percentage? A property-management company in the area should have these aggregated.
- How much new for-sale + rental construction is in the pipeline within 1–3 miles? Heavy new supply typically softens prices + rents 12–24 months out; constrained supply supports both.
Investment metrics
- 1% rule
- 1.21% ✓
- Cap rate
- 9.30%
- Cash-on-cash
- 10.72%
- DSCR
- 1.48
- GRM
- 6.9
CMA / ARV
- ARV (on-the-fly)
- $157,920
- Comps found
- 4
Show comp detail 4 sales within ~0.75 mi
| Address | Dist | Beds/Ba | Sqft | Sold | Price | $/sf | Match |
|---|---|---|---|---|---|---|---|
| 1503 Wilderness Ln | 0.18mi | 4/2.0 (+1) | 1,209 (+8%) | 1mo | $135,000 | $112 | 69 |
| 1608 Azalea Dr | 0.16mi | 3/2.0 | 1,131 (+1%) | 22mo | $145,000 | $128 | 68 |
| 1801 Molly Ln | 0.74mi | 3/2.0 | 1,176 (+5%) | 5mo | $249,000 | $212 | 49 |
| 1709 Driftwood Ln | 0.49mi | 3/2.0 | 1,288 (+15%) | 15mo | $182,000 | $141 | 36 |
Match score weights: distance 35% · size 25% · config 20% · recency 20%. Top-matched comps best support the ARV.
Projected returns pro-forma
-3.0% appreciation · 5.39% rent growth · sell at horizon
- IRR
- -0.1%
- Equity multiple
- 1.00×
- Total profit
- $-92
- Equity at exit
- $18,638
- IRR
- 12.1%
- Equity multiple
- 2.07×
- Total profit
- $37,290
- Equity at exit
- $10,808
Cash invested: $35,000 (down + closing). Projections, not guarantees.
Landlord ↔ Tenant lean methodology
- Overall (STATE)
- 90 Strongly Landlord-Friendly
- State Alabama
- 90 Strongly Landlord-Friendly · R+15
- County
- — inherits STATE
- City
- — inherits STATE
ZIP-level market 35235
- Home prices YoY
- -21.1%
- Rents YoY
- 5.4%
- Active inventory
- 114
- Price-to-rent
- 6.9×
Monthly cashflow live
- Estimated rent
- $1,508 high interval (Pro) →
- Mortgage (P&I)
- −$656
- Tax from tax record
- −$171 /mo · $2,056/yr
- Insurance
- −$52
- Flood insurance flood zone
- −$56 /mo · $666/yr
- HOA
- −$0
- Vacancy / Maint / Mgmt
- −$317
- Net cashflow
- $257
Break-even live
UW: 25.0% down · 7.5% · 30yr · 1.5% tax · 5.0% vac · 8.0% maint · 8.0% mgmt
Financing live
Cash to close
- Down payment
- $31,250
- Closing costs
- $3,750
- Reserves months
- —
- Total cash needed
- —
Loan-product check · same deal, 3 products live
Conventional
25% down · 7.5% · 30yr
- Down + closing
- —
- Monthly P&I
- —
- Monthly cashflow
- —
- DSCR
- —
- Eligible?
- —
Personal DTI + credit; lowest rate.
DSCR
20% down · 8.5% · 30yr
- Down + closing
- —
- Monthly P&I
- —
- Monthly cashflow
- —
- DSCR
- —
- Eligible?
- —
No personal income docs; deal must DSCR.
Hard money
10% down · 12.0% · 12mo
- Down + closing
- —
- Monthly P&I
- —
- Monthly cashflow
- —
- DSCR
- —
- Eligible?
- —
Short-term bridge; refi at stabilization.
Rent comps 16 comps
| Address | Beds | Baths | Sqft | Rent | $/sqft | DOM | Units | Dist |
|---|---|---|---|---|---|---|---|---|
| 1753 Tall Oak Cir Birmingham, AL | 3.0 | 2.0 | 1380 | $1,225 | $0.89 | 3d | 1 | 0.07mi |
| 1729 Tall Oak Cir Birmingham, AL | 3.0 | 2.0 | 1403 | $1,630 | $1.16 | 2d | 1 | 0.11mi |
| 1421 Brewster Cir Birmingham, AL | 3.0 | 2.0 | 1439 | $1,525 | $1.06 | 2d | 1 | 0.31mi |
| 1516 Highland Dr Birmingham, AL | 4.0 | 2.0 | 1104 | $1,675 | $1.52 | 15d | 1 | 0.34mi |
| 1440 Hickory Ln Birmingham, AL | 3.0 | 2.0 | 1448 | $1,625 | $1.12 | 2d | 1 | 0.57mi |
| 1830 Christian St Birmingham, AL | 3.0 | 2.0 | 1468 | $1,375 | $0.94 | 3d | 1 | 0.85mi |
| 1748 Sonia Dr Birmingham, AL | 4.0 | 2.0 | 1401 | $1,395 | $1.00 | 44d | 1 | 0.95mi |
| 1360 Orlando Cir NE Birmingham, AL | 3.0 | 2.0 | 1489 | $1,455 | $0.98 | 24d | 1 | 1.14mi |
| 1935 Springlake Ct Unit 1 Birmingham, AL | 2.0 | 1.5 | 1152 | $1,095 | $0.95 | 44d | 1 | 1.18mi |
| 1845 Stonehenge Dr Birmingham, AL | 3.0 | 2.0 | 1358 | $1,323 | $0.97 | 15d | 1 | 1.19mi |
| 1340 Orlando Cir NE Birmingham, AL | 3.0 | 2.0 | 1329 | $1,166 | $0.88 | 24d | 1 | 1.22mi |
| 1817 Lyle Dr Birmingham, AL | 4.0 | 2.0 | 1361 | $1,605 | $1.18 | 24d | 1 | 1.24mi |
| 1814 Valley Run Cir Birmingham, AL | 3.0 | 1.0 | 1025 | $1,350 | $1.32 | 44d | 1 | 1.24mi |
| 341 Argonne Dr NE Center Point, AL | 3.0 | 1.0 | 1040 | $1,300 | $1.25 | 3d | 1 | 1.36mi |
| 2025 Brewster Rd Birmingham, AL | 3.0 | 2.0 | 1369 | $1,450 | $1.06 | 24d | 1 | 1.44mi |
| 213 Meadwood Dr NE Center Point, AL | 3.0 | 1.0 | 1194 | $995 | $0.83 | 44d | 1 | 1.50mi |
Listing history 6 events
-
2026-06-18days on market $125,000 Coming Soon 8 DOM
-
2026-06-17days on market $125,000 Coming Soon 7 DOM
-
2026-06-16days on market $125,000 Coming Soon 6 DOM
-
2026-06-15days on market $125,000 Coming Soon 5 DOM
-
2026-06-13remarks 335-char remark
-
2026-06-13$125,000 Coming Soon 3 DOM
ⓘ Source: listings_history table (triggers on properties + properties_extension) + one-shot
backfill from property_details.listing_events for pre-trigger history.
Tax reassessment forecast AL · Resets to sale price
- Current annual tax
- $2,056 · $171/mo
- Projected year-2 tax
- $2,056 · $171/mo
- Expected delta
- $0/yr ($0/mo · 0.0%)
ⓘ Screening estimate from a state-policy table — verify with the county assessor before closing.
Climate risk First Street
- Flood 9/10 Extreme FEMA zone X (unshaded) · 99% chance over 30 yrs
- Wildfire 4/10 Moderate
- Heat 5/10 Major 7 d/yr ≥105°F today · 18 d/yr by 30 yrs out
- Wind 6/10 Major 27% chance of damaging wind over 30 yrs
- Air quality 5/10 Major 7 unhealthy d/yr today · 9 by 30 yrs out
Nearby sold comps map
Loading sold comps map…
Walkable amenities ~0.75 mi
Loading nearby amenities…
Taxation est. · year 1
- Rental income
- $18,102
- − Mortgage interest
- −$7,002
- − Property taxes
- −$2,056
- − Insurance
- −$1,292
- − Repairs & maintenance
- −$1,448
- − Management
- −$1,448
- − Depreciation
- −$3,636
- Taxable income
- $1,220
- Est. tax owed @ 24.0%
- −$293
- After-tax cash flow
- $2,794/yr
For passive investors: Depreciation is non-cash, so a rental often shows a tax loss while cash-flowing — sheltering income. Rental losses are passive: they offset passive income freely, and up to $25,000/yr can offset ordinary (W-2) income if you actively participate and your MAGI is under $100k (phasing out to $0 by $150k); unused losses carry forward. On sale, claimed depreciation is recaptured at up to 25%, and gains may owe capital-gains tax (a 1031 exchange can defer both). Figures are a year-1 estimate at your 24.0% rate — not tax advice; consult a CPA.
Schools (NCES district)
- District
- Birmingham City
- NCES district ID
- 0100390
- Math proficiency
- 4% ▼ -17.00%
- Reading proficiency
- 20% ▼ -4.00%
- Median HH income
- $31,988
- Composite
- 9.49/100
- National rank
- #9850
- State rank
- #116 of 129 in AL
Livability — Birmingham
- Score
- 67/100
- State rank
- #78
- US rank
- #10412
Category grades
Schools grade is shown separately in the Schools card above.
Census & demographics
- Census place
- Birmingham, AL
- County
- Jefferson County · 527,445 people
- City population
- 210,422
- Metro
- Birmingham-Hoover, AL
- Population (ZIP)
- 20,526
- Household income
- $63,295
- Rent vs Own
- Severe rent burden
- 941.0
Population outlook (Jefferson County) Hauer SSP2
- Today (2025)
- 669,185 people
- By 2030
- 669,694 · +0.1%
- By 2040
- 661,388 · -1.2%
- By 2050
- 643,086 · -3.9%
- By 2075
- 577,267 · -13.7%
- By 2100
- 474,758 · -29.1%
Race, ethnicity, and origin ACS 2023
- Neighborhood character
- Majority Black (63%)
- Race & ethnicity
- Black 63% White 30% Two or more races 3% Asian 2% Hispanic / Latino 2%
- Common ancestry
- Slovak 2% Serbian 1% Italian 1%
- Foreign-born
- 3% · Canada
- Languages at home
- 96% English-only · Spanish 2% Other Asian/Pacific 1%
Political lean MEDSL · Jefferson
- 2024 margin
- D (+10.4) · D 54.6% · R 44.2% · Other 1.2%
- 2008→2024 swing
- +5.4pp toward D · 2008: 5.1pp · 2024: 10.4pp
- All cycles
- 2024: D+10.4 2020: D+13.2 2016: D+7.2 2012: D+6.0 2008: D+5.1
Not yet ingested
- Civics
- —
Market trends
- HPI YoY
- ▼ -54.62%
- Current HPI
- 204.6532
- Rent YoY
- ▲ 5.39%
- Metro
- Birmingham-Hoover, AL
- State GDP YoY
- ▲ 2.94%
- F500 in state
- 4
Industry mix (Fortune 500 HQ in AL)
| Industry | F500 HQs | Revenue |
|---|---|---|
| Financial Services | 1 | $8B |
|
||
| Healthcare | 1 | $5B |
|
||
Price history
+237.8% since first listed12 events — show timeline
- 2026-06-11 Coming Soon $125,000 Greater Alabama MLS
- 2020-12-03 Sold (Public Records) $80,000 Public Records
- 2020-12-02 Sold (MLS) $80,000 Greater Alabama MLS
- 2020-11-20 Contingent — Greater Alabama MLS
- 2020-11-09 Price Changed $85,000 Greater Alabama MLS
- 2020-11-05 Listed $90,000 Greater Alabama MLS
- 2020-11-01 Coming Soon $90,000 Greater Alabama MLS
- 2018-01-09 Sold (Public Records) $68,000 Public Records
- 2018-01-08 Sold (MLS) $68,000 Greater Alabama MLS
- 2017-12-15 Delisted — Greater Alabama MLS
- 2017-11-02 Listed $69,900 Greater Alabama MLS
- 1978-12-27 Sold (Public Records) $37,000 Public Records
Property tax history
+12.4%/yrLatest (2025): $2,056 · +6.9% YoY. Source: county tax records.
Cash-flow waterfall
monthlySold comps — $/sqft
last 12 mo · ≤1 miLoading sold comps…