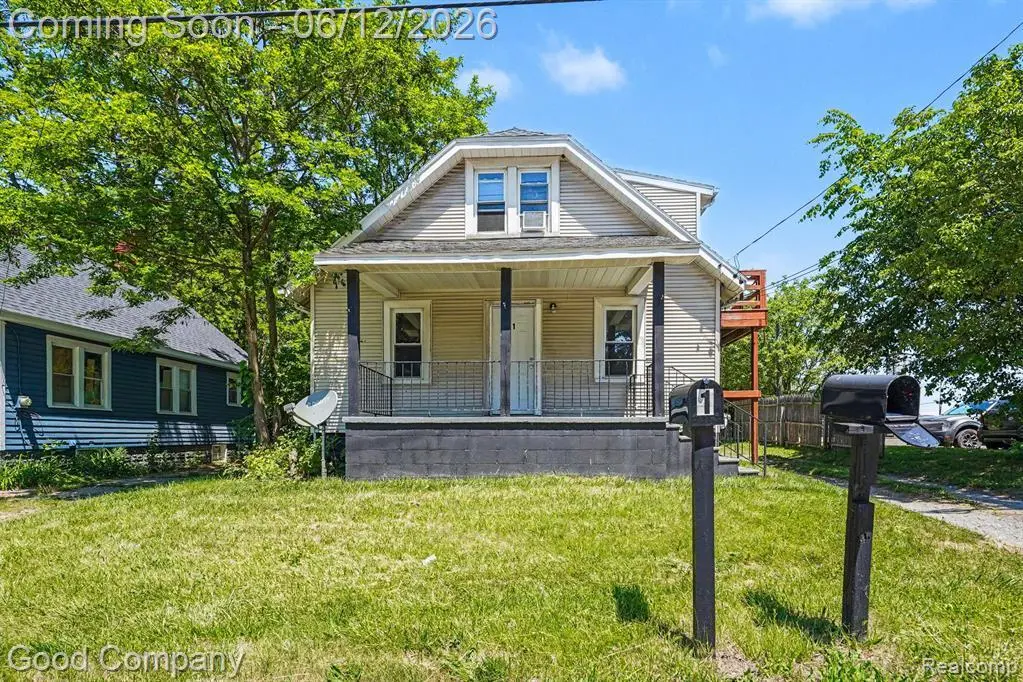
3499 E Atherton Rd · Burton, MI
Flood risk 1/10 · Minimal
- FEMA flood zone
- X (unshaded)
- Chance of flooding over 30 yrs
- 0.0%
- Est. flood insurance / yr
- $473 – $860
Fire risk 1/10 · Minimal
- Est. fire insurance / yr
- $784 – $1,456
Heat risk 2/10 · Minimal
- Hot days now (above 96°F)
- 7 days/yr
- Hot days in 30 yrs
- 15 days/yr
Wind risk 2/10 · Minimal
- Chance of severe wind over 30 yrs
- —
Air-quality risk 3/10 · Minor
- Unhealthy air days now
- 2 days/yr
- Unhealthy air days in 30 yrs
- 3 days/yr
Risk factors via First Street. Map © Google.
Why this score? — see what drove the D+ grade
The composite is a weighted blend of 9 inputs, each scored 0–100. Each bar is that input's sub-score; the figure is the points it added to the 100-point composite (weight × sub-score).
- ARV discount +15.0/15.0
- Cash flow +14.8/30.0
- DSCR +4.5/10.0
- 1% rule +4.3/10.0
- Livability +3.1/5.0
- Rent growth +2.5/5.0
- Condition / age +2.5/5.0
- Schools +1.5/10.0
- Appreciation +0.0/10.0
$149,000
🖨 Deal sheet (PDF) 📄 Offer letter ✓ Due diligence
Listing remarks MLS
Duplex Generating $1,800 Monthly Rental Income! Welcome to your new investment opportunity at 3499 E Atherton, Burton. This exceptional duplex features two beautifully appointed units, each offering modern comforts after recent renovations. With a brand-new water heater and updated plumbing, you can rest assured of efficient and reliable systems. Situated in the heart of Burton, this property offers easy access to local stores and amenities. There's also ample outdoor space for relaxation and outdoor activities. Whether you're a seasoned investor or a first-time buyer, this property provides a hassle-free income stream and a prime location. Don't miss out; schedule a viewing today to make this outstanding property yours! 48 HOUR NOTICE REQUIRED FOR ALL SHOWINGS
Key facts
- 4,356 sq ft lot
- Built 1946
- Listed 10 days
Property features AI
Exterior
- Utilities: Public water; Natural gas service
- Home design: Residential 2-story structure; Built in 1946; Basement level present
- Construction: Brick and vinyl siding construction; Basement foundation
- Exterior features: Brick and vinyl siding exterior; Paved street frontage; Frontage of about 40 feet
Interior
- Kitchen: Entry-level kitchen (approximately 9 x 9); Adjacent dining room (approximately 12 x 8)
- Bedrooms: Two entry-level bedrooms (approximately 9 x 10 and 9 x 9); One second-floor bedroom (approximately 10')
- Bathrooms: Two full bathrooms; Main-level bathroom roughly 6 x 7; Second-floor bathroom
- Heating & cooling: Natural gas heating; Forced-air heating system
- Interior features: Total of 8 rooms; Unfinished basement
- Laundry & utility: Basement access for utilities/laundry
Neighborhood map
What this means for you Summary
Snapshot
- This is a 3-bed/2.0-bath single-family listed at $149k.
Deal economics
- At list price, monthly cash flow is $40 ($486/yr) — positive.
- The deal already cash-flows at list — no discount required.
- To meet the 1% rule (rent ≥ 1% of price), the offer needs to be $139k (6.9% below list).
- Recommended offer: $139k (6.9% below list) — sets the bar for 1% rule.
- Cap rate 6.6% vs local median 3.7% in Burton — top-decile yield for the area; either an underpriced asset or a hidden risk that comps aren't pricing in. Stress-test before assuming the spread holds.
Location & tenants
- Location reads 61/100 on livability (#555 in MI) — a middle-class / working-renter tenant base. Strengths: cost of living A+, housing A+; Watch: employment D, crime F, amenities F.
- Atherton Community Schools (suburban): math 13% / reading 23% proficiency, ranked #481 of 540 in MI (top 89%) — low school quality limits family demand, transient renter base, plan for 1-2y turnover; 67% free/reduced lunch — lower-income household profile, screen leases tightly.
- Zoned schools: Atherton Elementary School (math 17% / reading 17%, grade F, #1,149 of 1,397 statewide, top 84%, 331 students, 91% FRL); Atherton Jr Sr High School (math 12% / reading 32%, grade F, #582 of 713 statewide, top 83%, 370 students, 94% FRL) — zoned schools average 92% FRL vs 67% district-wide (25 pts higher); higher-poverty schools than district average — tighter screening recommended.
- Market conditions: 54 active listings in the ZIP; 2 comparable units currently listed for rent nearby; 419 units permitted in Genesee County in 2024 (68 in 5+ unit buildings).
Forward outlook
- Local home prices are declining (-3.0%/yr); year-one equity from $1k of loan paydown is wiped out by about $4k of value loss. Plan a longer hold.
- Genesee County population projected at -27% by 2050 — secular population decline; favor cash flow + early exit over multi-decade hold.
Negotiation context
- Only 10 days on market — expect competitive offers; lowballing is unlikely to land.
- 8 sale attempts since 4y ago; this cycle's ask is 24% above the opening price — seller raised mid-cycle; expect resistance to lowballs.
- Current owner paid $120k; 24% above their basis — modest negotiation headroom, anchor on the comps not their cost.
Risks & watch-outs
- Watch-outs: built in 1946 — expect roof / HVAC / electrical / plumbing capex.
Questions for the listing agent
- Built in 1946 — when were the roof, HVAC, electrical panel, plumbing, and water heater last replaced?
- Is there a deadline driving the sale (1031 exchange, divorce, estate, relocation)? That informs how much negotiation room exists.
- Schools are F-rated, which usually means shorter tenancies and higher turnover. Who's the typical renter profile here, and what's been the actual vacancy rate?
- Crime grade is F in this area — have there been break-ins, vandalism, or insurance claims at this property in the last 3 years? What carrier currently insures it and at what premium?
- The area grade is low — what's the realistic commute time and amenity access for the typical tenant pool here? Any planned neighborhood developments (good or bad) we should know about?
- What's the average days-on-market for RENTAL listings here right now (not sales)? A rising rental-DOM trend means longer vacancies and softer asking-rent achievability than the comps imply.
- What's the recent tenant-quality profile in this submarket — average credit score on applications, eviction rate, late-payment / NSF rate, and stable-employment percentage? A property-management company in the area should have these aggregated.
- How much new for-sale + rental construction is in the pipeline within 1–3 miles? Heavy new supply typically softens prices + rents 12–24 months out; constrained supply supports both.
Investment metrics
- 1% rule
- 0.93% ✗
- Cap rate
- 6.62%
- Cash-on-cash
- 1.16%
- DSCR
- 1.05
- GRM
- 8.9
CMA / ARV
- ARV (on-the-fly)
- $198,378
- Comps found
- 11
Show comp detail 11 sales within ~0.75 mi
| Address | Dist | Beds/Ba | Sqft | Sold | Price | $/sf | Match |
|---|---|---|---|---|---|---|---|
| 3052 S Center Rd | 0.12mi | 3/1.5 | 1,736 (-6%) | 6mo | $74,000 | $43 | 77 |
| 3085 S Center Rd | 0.19mi | 3/1.5 | 2,066 (+11%) | 7mo | $120,000 | $58 | 64 |
| 2400 Meadowcroft Dr | 0.68mi | 3/1.5 | 1,716 (-7%) | 13mo | $261,950 | $153 | 43 |
| 3525 Chambers St | 0.66mi | 3/1.0 | 1,932 (+4%) | 24mo | $79,900 | $41 | 38 |
| 3474 Bilsky St | 0.56mi | 3/1.0 | 1,606 (-13%) | 11mo | $225,000 | $140 | 38 |
| 4056 E Hemphill Rd. Rd | 0.55mi | 3/2.0 | 1,600 (-14%) | 20mo | $210,000 | $131 | 35 |
| 4354 E Atherton Rd | 0.72mi | 3/2.0 | 2,094 (+13%) | 15mo | $224,000 | $107 | 32 |
| 4342 Sunnymead Ave | 0.70mi | 3/1.5 | 1,592 (-14%) | 13mo | $207,000 | $130 | 31 |
| 2480 Meadowcroft Dr | 0.65mi | 4/2.0 (+1) | 1,642 (-11%) | 17mo | $155,000 | $94 | 31 |
| 2283 Howe Rd | 0.71mi | 3/1.5 | 1,642 (-11%) | 19mo | $139,900 | $85 | 30 |
| 4370 Sunnymead Ave | 0.75mi | 4/1.5 (+1) | 2,074 (+12%) | 23mo | $230,000 | $111 | 19 |
Match score weights: distance 35% · size 25% · config 20% · recency 20%. Top-matched comps best support the ARV.
Projected returns pro-forma
-3.0% appreciation · 3.0% rent growth · sell at horizon
- IRR
- -14.4%
- Equity multiple
- 0.48×
- Total profit
- $-21,530
- Equity at exit
- $22,216
- IRR
- -5.6%
- Equity multiple
- 0.63×
- Total profit
- $-15,278
- Equity at exit
- $12,883
Cash invested: $41,720 (down + closing). Projections, not guarantees.
Landlord ↔ Tenant lean methodology
- Overall (STATE)
- 62 Landlord-Friendly
- State Michigan
- 62 Landlord-Friendly · EVEN
- County
- — inherits STATE
- City
- — inherits STATE
ZIP-level market 48529
- Home prices YoY
- -26.5%
- Active inventory
- 54
- Price-to-rent
- 8.9×
Monthly cashflow live
- Estimated rent
- $1,388 medium interval (Pro) →
- Mortgage (P&I)
- −$781
- Tax from tax record
- −$212 /mo · $2,548/yr
- Insurance
- −$62
- HOA
- −$0
- Vacancy / Maint / Mgmt
- −$291
- Net cashflow
- $40
Break-even live
Sensitivity live
| Price | -10% $125 | -5% $83 | +0% $40 | +5% $-2 | +10% $-44 |
|---|---|---|---|---|---|
| Rent | -10% $-69 | -5% $-14 | +0% $40 | +5% $95 | +10% $150 |
| Rate | -1.0pp $116 | -0.5pp $78 | base $40 | +0.5pp $2 | +1.0pp $-37 |
UW: 25.0% down · 7.5% · 30yr · 1.5% tax · 5.0% vac · 8.0% maint · 8.0% mgmt
Financing live
Cash to close
- Down payment
- $37,250
- Closing costs
- $4,470
- Reserves months
- —
- Total cash needed
- —
Loan-product check · same deal, 3 products live
Conventional
25% down · 7.5% · 30yr
- Down + closing
- —
- Monthly P&I
- —
- Monthly cashflow
- —
- DSCR
- —
- Eligible?
- —
Personal DTI + credit; lowest rate.
DSCR
20% down · 8.5% · 30yr
- Down + closing
- —
- Monthly P&I
- —
- Monthly cashflow
- —
- DSCR
- —
- Eligible?
- —
No personal income docs; deal must DSCR.
Hard money
10% down · 12.0% · 12mo
- Down + closing
- —
- Monthly P&I
- —
- Monthly cashflow
- —
- DSCR
- —
- Eligible?
- —
Short-term bridge; refi at stabilization.
Rent comps 2 comps
| Address | Beds | Baths | Sqft | Rent | $/sqft | DOM | Units | Dist |
|---|---|---|---|---|---|---|---|---|
| 3440 Creekside Blvd Burton, MI | 3.0 | 2.0 | 1512 | $1,424 | $0.94 | 15d | 1 | 0.95mi |
| 3908 Cherokee Ave Flint, MI | 4.0 | 2.5 | 1824 | $1,350 | $0.74 | 15d | 1 | 1.19mi |
Listing history 12 events
-
2026-06-21days on market $149,000 Active 10 DOM
-
2026-06-18days on market $149,000 Active 7 DOM
-
2026-06-17days on market $149,000 Active 6 DOM
-
2026-06-16days on market $149,000 Active 5 DOM
-
2026-06-15days on market $149,000 Active 4 DOM
-
2026-06-14days on market $149,000 Active 2 DOM
-
2026-06-13statusdays on market $149,000 Active 1 DOM
-
2026-06-10days on market $149,000 Coming Soon 5 DOM
-
2026-06-09days on market $149,000 Coming Soon 4 DOM
-
2026-06-08days on market $149,000 Coming Soon 3 DOM
-
2026-06-07remarks 699-char remark
-
2026-06-07$149,000 Coming Soon 2 DOM
ⓘ Source: listings_history table (triggers on properties + properties_extension) + one-shot
backfill from property_details.listing_events for pre-trigger history.
Tax reassessment forecast MI · Partial reset (capped growth)
- Current annual tax
- $2,548 · $212/mo
- Projected year-2 tax
- $2,548 · $212/mo
- Expected delta
- $0/yr ($0/mo · 0.0%)
ⓘ Screening estimate from a state-policy table — verify with the county assessor before closing.
Climate risk First Street
- Flood 1/10 Low FEMA zone X (unshaded) · 0% chance over 30 yrs
- Wildfire 1/10 Low
- Heat 2/10 Low 7 d/yr ≥96°F today · 15 d/yr by 30 yrs out
- Wind 2/10 Low
- Air quality 3/10 Moderate 2 unhealthy d/yr today · 3 by 30 yrs out
Nearby sold comps map
Loading sold comps map…
Walkable amenities ~0.75 mi
Loading nearby amenities…
Taxation est. · year 1
- Rental income
- $16,652
- − Mortgage interest
- −$8,346
- − Property taxes
- −$2,548
- − Insurance
- −$745
- − Repairs & maintenance
- −$1,332
- − Management
- −$1,332
- − Depreciation
- −$4,335
- Taxable loss
- −$1,986
- Est. tax savings @ 24.0%
- +$477
- After-tax cash flow
- $962/yr
For passive investors: Depreciation is non-cash, so a rental often shows a tax loss while cash-flowing — sheltering income. Rental losses are passive: they offset passive income freely, and up to $25,000/yr can offset ordinary (W-2) income if you actively participate and your MAGI is under $100k (phasing out to $0 by $150k); unused losses carry forward. On sale, claimed depreciation is recaptured at up to 25%, and gains may owe capital-gains tax (a 1031 exchange can defer both). Figures are a year-1 estimate at your 24.0% rate — not tax advice; consult a CPA.
Schools (NCES district)
- District
- Atherton Community Schools
- NCES district ID
- 2603540
- Math proficiency
- 13% ▼ -2.00%
- Reading proficiency
- 23% ▼ -9.00%
- Median HH income
- $39,416
- Composite
- 15.21/100
- National rank
- #9341
- State rank
- #481 of 540 in MI
Livability — Burton
- Score
- 61/100
- State rank
- #555
- US rank
- #17380
Category grades
Schools grade is shown separately in the Schools card above.
Census & demographics
- Census place
- Burton, MI
- City population
- 26,014
- Population (ZIP)
- 8,959
Population outlook (Genesee County) Hauer SSP2
- Today (2025)
- 381,312 people
- By 2030
- 362,731 · -4.9%
- By 2040
- 321,550 · -15.7%
- By 2050
- 279,212 · -26.8%
- By 2075
- 193,336 · -49.3%
- By 2100
- 128,118 · -66.4%
Race, ethnicity, and origin ACS 2023
- Neighborhood character
- Predominantly White (82%)
- Race & ethnicity
- White 82% Black 9% Hispanic / Latino 6% Two or more races 4%
- Hispanic origin (detail)
- Mexican 6%
- Common ancestry
- Romanian 6% Lithuanian 4% Slovak 4%
- Foreign-born
- 1% · Canada
- Languages at home
- 99% English-only · Spanish 1%
Political lean MEDSL · Genesee
- 2024 margin
- Toss-up / Even · D 51.4% · R 47.2% · Other 1.4%
- 2008→2024 swing
- -28.3pp toward R · 2008: 32.5pp · 2024: 4.2pp
- All cycles
- 2024: D+4.2 2020: D+9.3 2016: D+9.5 2012: D+28.2 2008: D+32.5
Not yet ingested
- Civics
- —
Market trends
- HPI YoY
- ▼ -82.30%
- Current HPI
- 228.5338
- Rent YoY
- —
- Metro
- —
- State GDP YoY
- ▲ 1.37%
- F500 in state
- 28
Industry mix (Fortune 500 HQ in MI)
| Industry | F500 HQs | Revenue |
|---|---|---|
| Automotive Parts | 3 | $48B |
|
||
| Automotive | 2 | $372B |
|
||
| Chemicals | 1 | $45B |
|
||
| Automotive Retail | 1 | $29B |
|
||
| Healthcare / Medical Devices | 1 | $23B |
|
||
| Automotive Technology | 1 | $20B |
|
||
Price history
+171.4% since first listed23 events — show timeline
- 2026-06-05 Coming Soon $149,000 MiRealSource-MiMLS
- 2023-10-28 Sold (Public Records) $119,999 Public Records
- 2023-10-24 Sold (MLS) $119,999 MiRealSource-MiMLS
- 2023-10-24 Sold (MLS) $119,999 MiRealSource-MiMLS
- 2023-10-24 Sold (MLS) $119,999 REALCOMP
- 2023-10-24 Sold (MLS) $119,999 REALCOMP
- 2023-09-15 Pending — MiRealSource-MiMLS
- 2023-09-15 Pending — MiRealSource-MiMLS
- 2023-09-12 Listed $119,999 MiRealSource-MiMLS
- 2023-09-12 Listed $119,999 MiRealSource-MiMLS
- 2023-09-12 Listed $119,999 REALCOMP
- 2023-09-11 Coming Soon $119,999 MiRealSource-MiMLS
- 2023-09-11 Listed $119,999 REALCOMP
- 2022-04-29 Sold (MLS) $42,000 MiRealSource-MiMLS
- 2022-04-29 Sold (MLS) $42,000 REALCOMP
- 2022-04-25 Pending — REALCOMP
- 2022-04-25 Pending — MiRealSource-MiMLS
- 2022-04-11 Relisted — REALCOMP
- 2022-04-11 Relisted — MiRealSource-MiMLS
- 2022-03-23 Pending — REALCOMP
- 2022-03-23 Pending — MiRealSource-MiMLS
- 2022-03-18 Listed $54,900 MiRealSource-MiMLS
- 2022-03-18 Listed $54,900 REALCOMP
Property tax history
+8.4%/yrLatest (2025): $2,548 · +4.2% YoY. Source: county tax records.
Cash-flow waterfall
monthlySold comps — $/sqft
last 12 mo · ≤1 miLoading sold comps…